
Houses for sale in Belmont, Grantham
House Prices in Belmont
Properties in Belmont have an average house price of £240k and had 287 Property Transactions within the last 3 years¹.
Belmont is an area in Grantham, Lincolnshire with 2,150 households², where the most expensive property was sold for £795k.
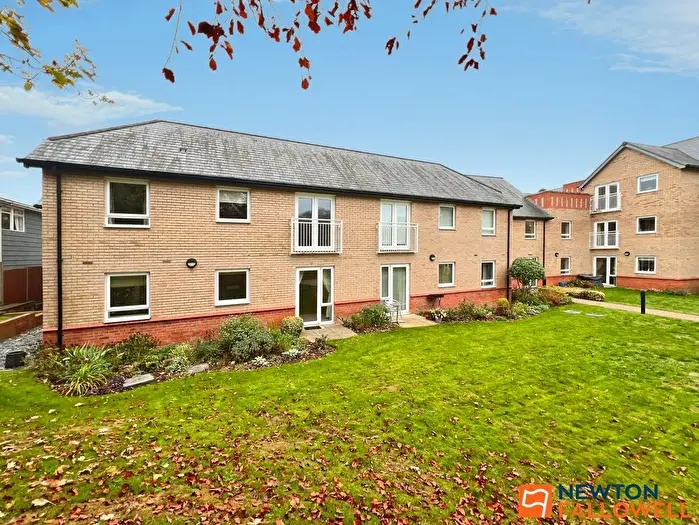
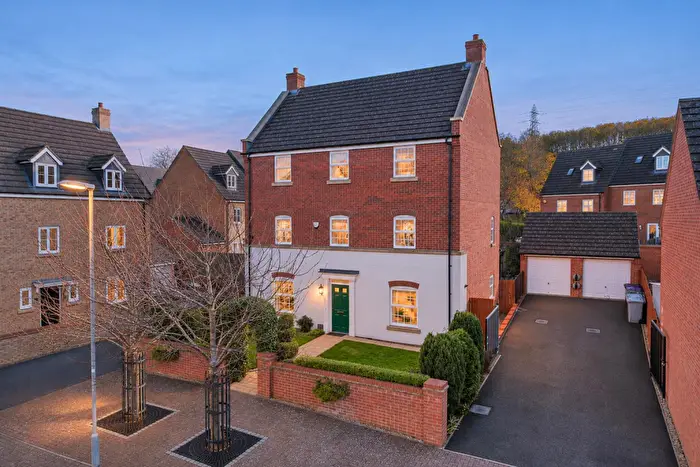
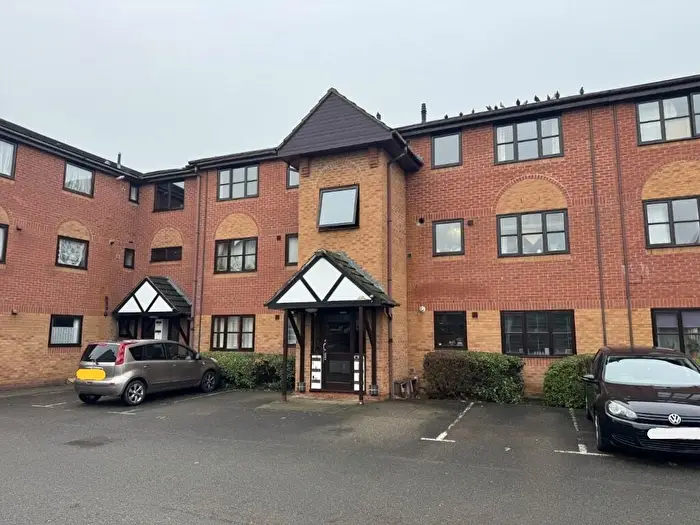
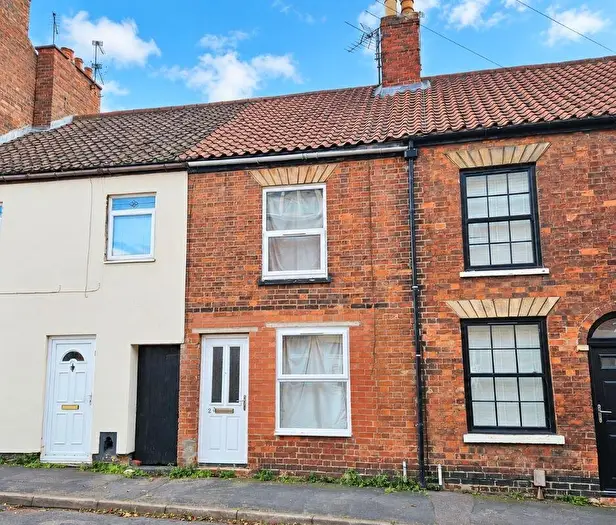
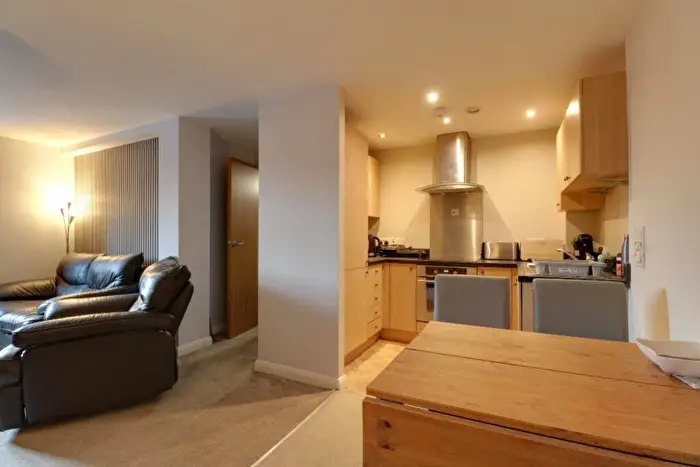
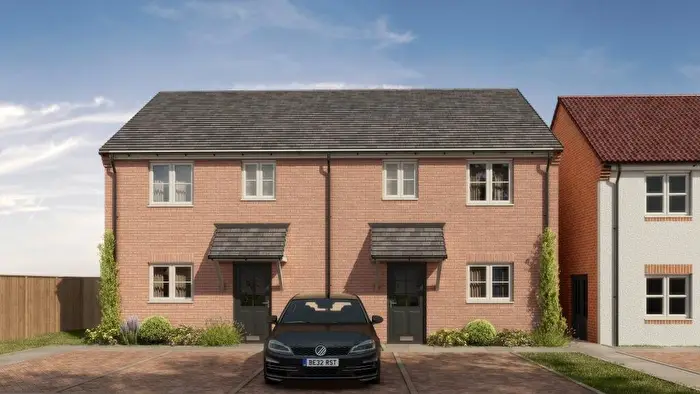
Properties for sale in Belmont

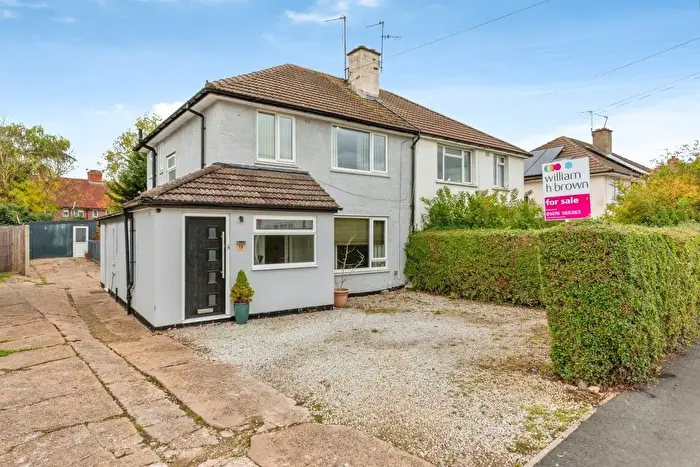

 3 Bedrooms
 1 Bathroom



If you are looking to sell your house, let it out, or receive a property valuation, an expert can help you.
Click the button below to get started.






Roads and Postcodes in Belmont
Navigate through our locations to find the location of your next house in Belmont, Grantham for sale or to rent.
| Streets | Postcodes |
|---|---|
| Alma Park Close | NG31 9UL |
| Alma Park Road | NG31 9SE NG31 9SP NG31 9RZ NG31 9SU NG31 9SX |
| Ascot Drive | NG31 9TB |
| Bedford Close | NG31 9UQ |
| Belton Lane | NG31 9PW NG31 9SQ |
| Belton Park | NG31 9SH |
| Belvoir Avenue | NG31 7TA |
| Berkshire Drive | NG31 9GF |
| Birkdale Close | NG31 9RS |
| Blairgowie Close | NG31 9FJ |
| Braemar Close | NG31 9PB |
| Bridge End Grove | NG31 7HN |
| Bridge End Road | NG31 7HE NG31 7TR NG31 7TS NG31 7TT |
| Burleigh Close | NG31 9UF |
| Carnoustie Close | NG31 9FF |
| Cavendish Way | NG31 9FN NG31 9FP |
| Chatsworth Avenue | NG31 9UG |
| Church Lane | NG31 9RX |
| Coxmoor Close | NG31 9FG |
| Cromer Close | NG31 9FE |
| Crossgill Close | NG31 9TZ |
| Earls Place | NG31 9HF |
| Eastwood Drive | NG31 7GZ |
| Fifth Avenue | NG31 9SY NG31 9SZ NG31 9TG NG31 9TH NG31 9TJ NG31 9TQ |
| First Avenue | NG31 9TL NG31 9TN |
| Formby Close | NG31 9PD |
| Fourth Avenue | NG31 9TS |
| Fulford Close | NG31 9UW |
| Ganton Way | NG31 9FD |
| Gleneagles | NG31 9QJ |
| Hall Lane | NG31 9HP |
| Harrowby Crescent | NG31 7TG |
| Harrowby Hall Estate | NG31 9HA |
| Harrowby Lane | NG31 9LR NG31 9HB NG31 9HG NG31 9HQ NG31 9LP NG31 9TT |
| Heath Farm Lane | NG31 9EX |
| Hebden Walk | NG31 9TU |
| High Dyke | NG31 9ER NG32 2BS |
| High Road | NG31 9RU |
| Hill Crest | NG31 7TD |
| Hillside Drive | NG31 7EZ |
| Hoylake | NG31 9FS |
| Isaac Newton Way | NG31 9RT |
| Kenilworth Road | NG31 9TX NG31 9UH NG31 9UN |
| Killarney Close | NG31 9GA |
| Lindrick Close | NG31 9SS |
| Londonthorpe Road | NG31 9SJ NG31 9SL NG31 9SN |
| Lytham Close | NG31 9GE |
| Meadow End | NG31 7HF |
| Montrose Close | NG31 9TE |
| Moortown Close | NG31 9GG |
| Muirfield | NG31 9QH |
| Newgate Lane | NG31 9HD NG31 9RY |
| Ninth Avenue | NG31 9TF |
| Pasture Close | NG31 7HW |
| Polygon Walk | NG31 9UJ |
| Ponton Avenue | NG31 7TF |
| Porthcawl Close | NG31 9GH |
| Portmarnock Way | NG31 9FL |
| Portrush Drive | NG31 9GD |
| Prestwick Close | NG31 9GB |
| Prince Wm Of Glos Barracks | NG31 7TQ |
| Ruston Road | NG31 9SW |
| Saltersford Grove | NG31 7HP |
| Saltersford Road | NG31 7HG NG31 7HH NG31 7HL |
| Sandringham Drive | NG31 9UD |
| Scotney Drive | NG31 9UA |
| Seacroft Close | NG31 9GL |
| Second Avenue | NG31 9TP |
| Seventh Avenue | NG31 9TD |
| Sixth Avenue | NG31 9TA |
| Somerby Place | NG31 7TE |
| St Andrews | NG31 9PE |
| St Georges Way | NG31 9GJ |
| St Mellion Drive | NG31 9FB |
| St Pierre Avenue | NG31 9FH |
| Sunningdale | NG31 9PF NG31 9SB |
| The Belfry | NG31 9QL |
| Third Avenue | NG31 9TR |
| Tom Childs Close | NG31 9FR |
| Troon Close | NG31 9UP |
| Turnberry Close | NG31 9PQ |
| Turnor Road | NG31 9ET |
| Walton Heath Close | NG31 9PN |
| Wardour Drive | NG31 9TY |
| Warren Way | NG31 9SG |
| Wentworth Drive | NG31 9QQ |
| Whalebone Lane | NG31 7TU |
| Willow Tree Drive | NG31 9FW |
| Windsor Drive | NG31 9UB |
| Withambrook Park Industrial Estate | NG31 9ST |
| Woburn Drive | NG31 9UE |
| Woodbrook | NG31 9FT |
| Woodland Drive | NG31 9SR |
| Wulfram Drive | NG31 7TB |
| NG31 7TJ NG31 8NH |
Property price trends in Belmont
According to the latest Land Registry data, the average home in Belmont sold for £217,523 in 2026. That figure comes from 3,786 sales logged over the past 31 years.
Prices have fallen back over the last three years. Compared with 2023, when the typical sale came in around £238,396, that's a fall of roughly 8.8%.
Looking back five years, average prices are up about 4.1% since 2021, a gain of around £8,636 in cash terms.
Zoom out to the past decade for the fuller picture. Back in 2016, homes here averaged £166,932, so the typical sold price has climbed about 30.3% since then, roughly 2.7% a year. Stretch the view to fifteen years and that annual pace edges up closer to 3.2%.
Frequently asked questions about Belmont
What is the average price for a property for sale in Belmont?
The average price for a property for sale in Belmont is £239,746. This amount is 6% lower than the average price in Grantham. There are 2,616 property listings for sale in Belmont.
What streets have the most expensive properties for sale in Belmont?
The streets with the most expensive properties for sale in Belmont are High Road at an average of £390,750, Lindrick Close at an average of £377,642 and Braemar Close at an average of £377,500.
What streets have the most affordable properties for sale in Belmont?
The streets with the most affordable properties for sale in Belmont are Alma Park Close at an average of £113,750, Lytham Close at an average of £143,750 and Bedford Close at an average of £159,500.
Which train stations are available in or near Belmont?
Some of the train stations available in or near Belmont are Grantham, Ancaster and Bottesford.
Property Price Paid in Belmont by Year
The average sold property price by year was:
| Year | Average Sold Price | Price Change |
Sold Properties

|
|---|---|---|---|
| 2026 | £217,523 | 
-19% |
49 Properties |
| 2025 | £258,300 | 
9% |
86 Properties |
| 2024 | £234,807 |
-2% |
84 Properties |
| 2023 | £238,396 |
2% |
68 Properties |
| 2022 | £233,343 |
10% |
90 Properties |
| 2021 | £208,887 |
6% |
120 Properties |
| 2020 | £196,254 |
11% |
76 Properties |
| 2019 | £175,457 |
-7% |
78 Properties |
| 2018 | £187,672 |
1% |
103 Properties |
| 2017 | £185,989 |
10% |
110 Properties |
Property Price per Property Type in Belmont
Here you can find historic sold price data in order to help with your property search.
The average Property Paid Price for specific property types in the last three years are:
| Property Type | Average Sold Price | Sold Properties |
|---|---|---|
| Detached House | £280,976.00 | 138 Detached Houses |
| Semi Detached House | £212,542.00 | 119 Semi Detached Houses |
| Terraced House | £158,000.00 | 30 Terraced Houses |
