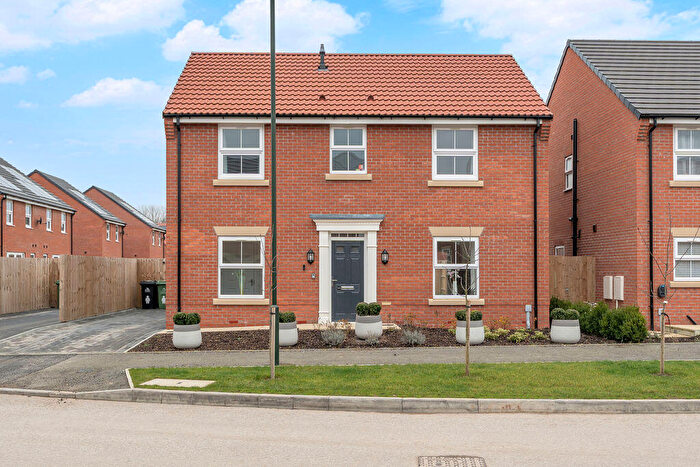
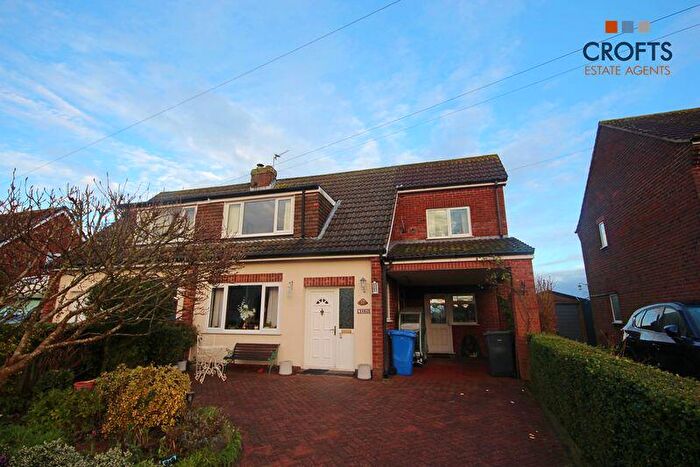
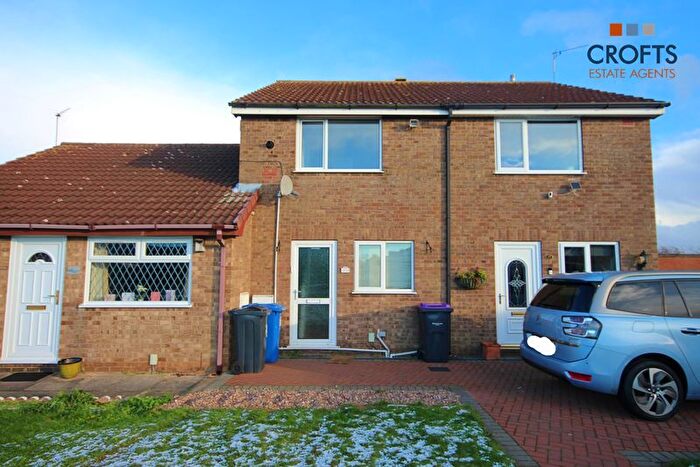
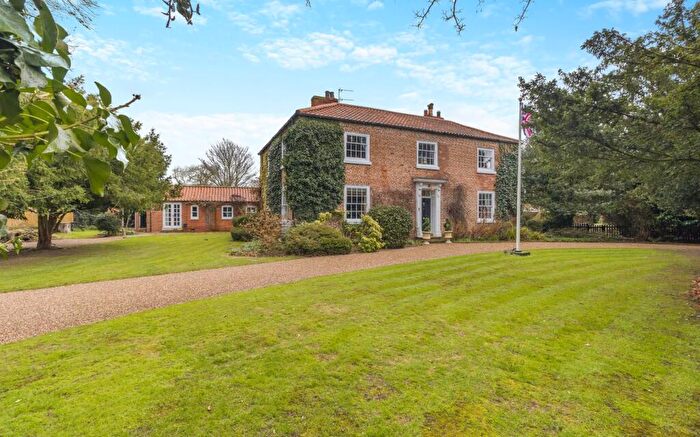
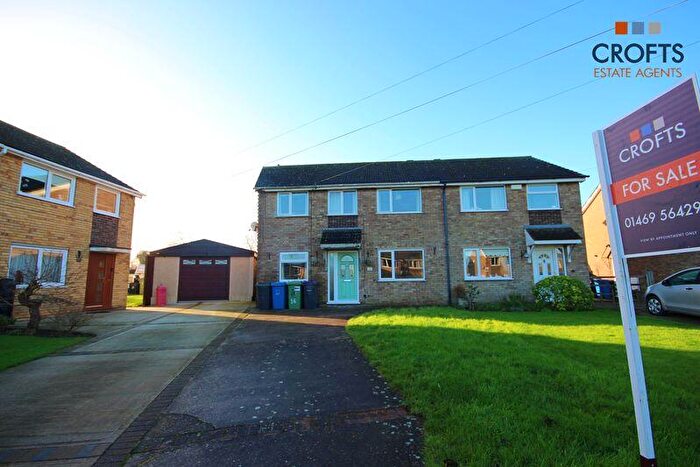
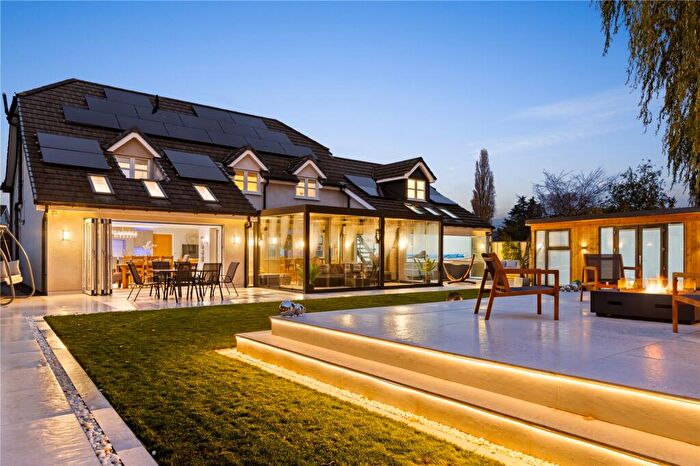
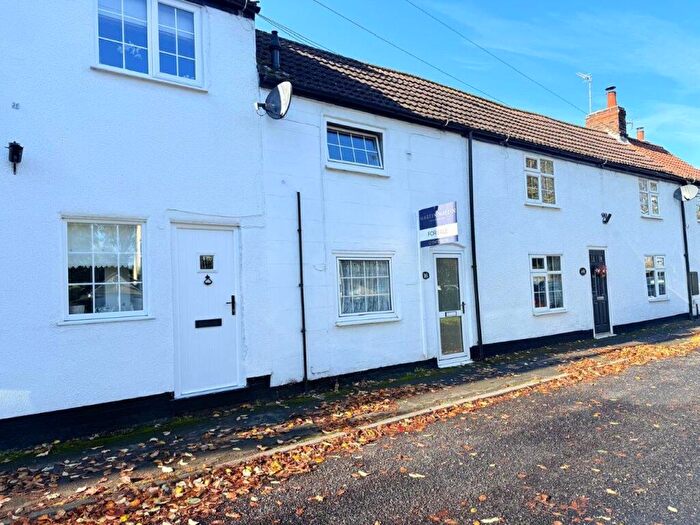
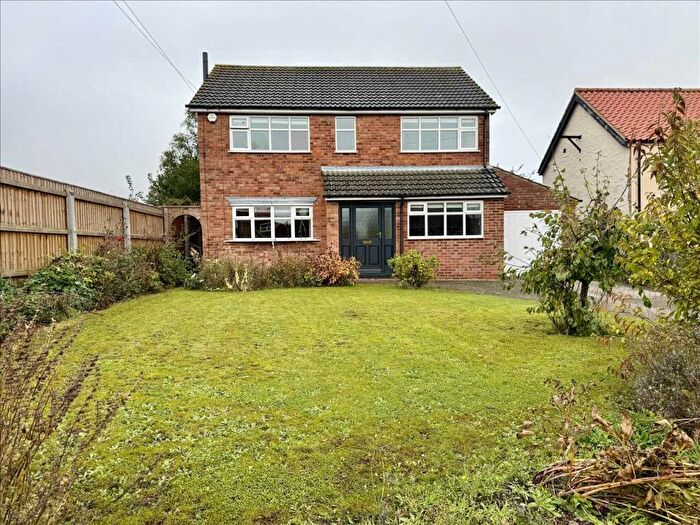
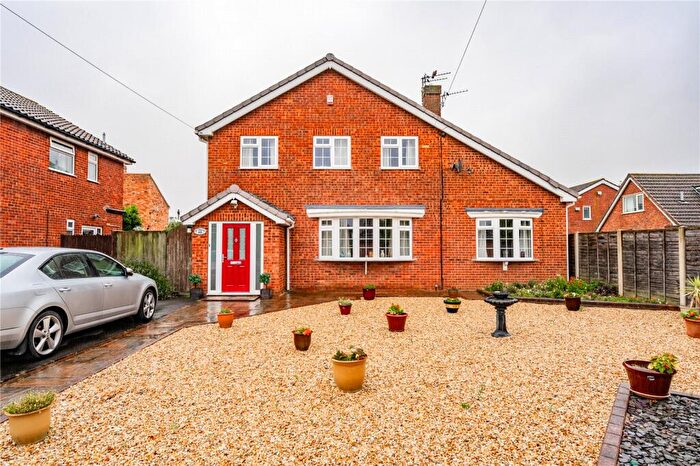
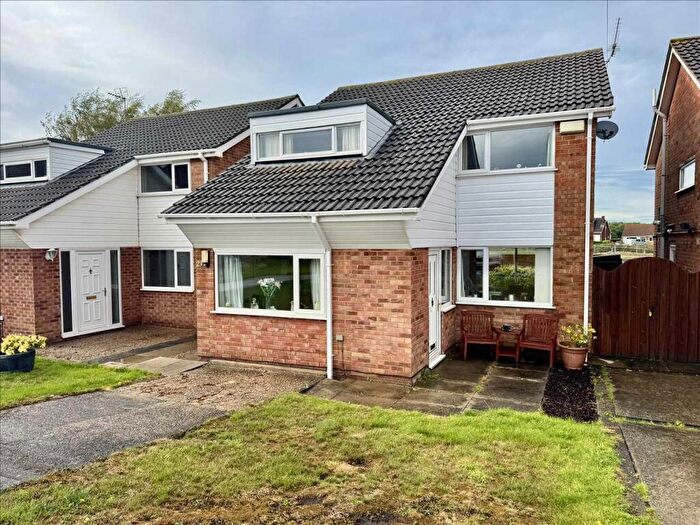
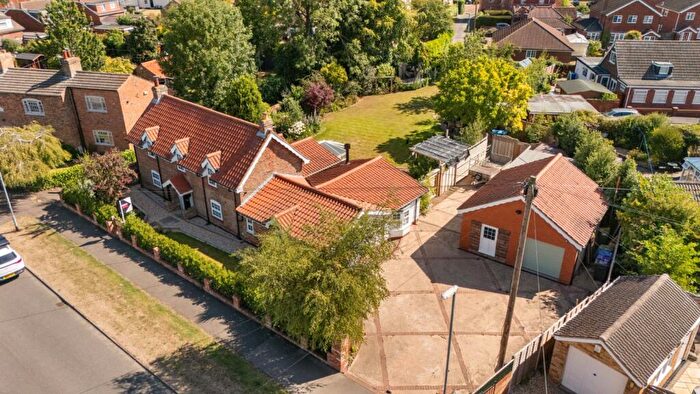
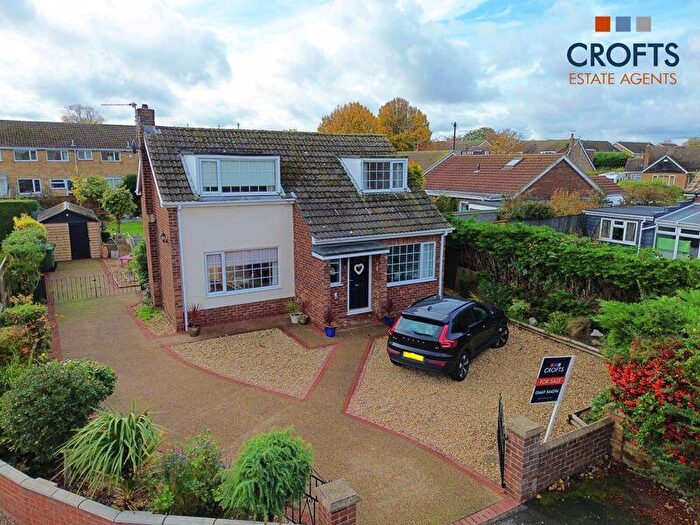
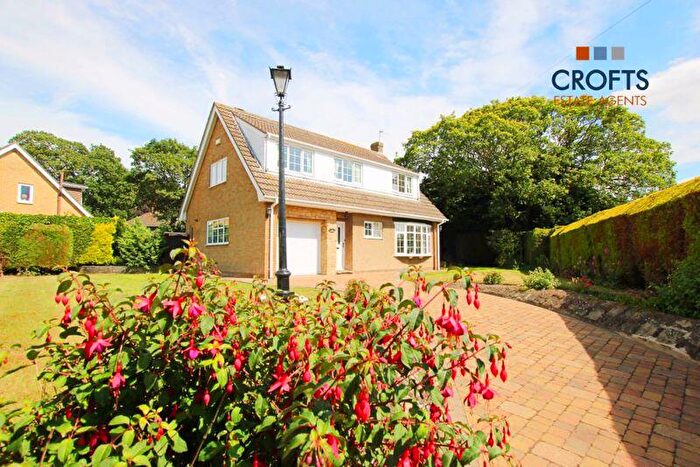
Houses for sale & to rent in Caistor and Yarborough, Grimsby
House Prices in Caistor and Yarborough
Properties in Caistor and Yarborough have an average house price of £475,000.00 and had 1 Property Transaction within the last 3 years¹.
Caistor and Yarborough is an area in Grimsby, Lincolnshire with 124 households², where the most expensive property was sold for £475,000.00.
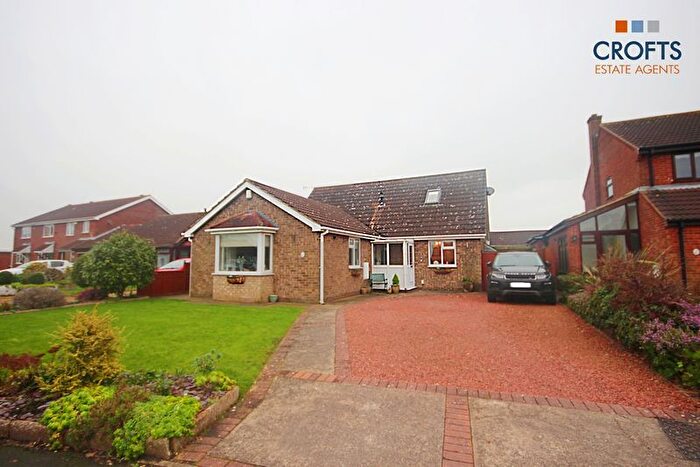
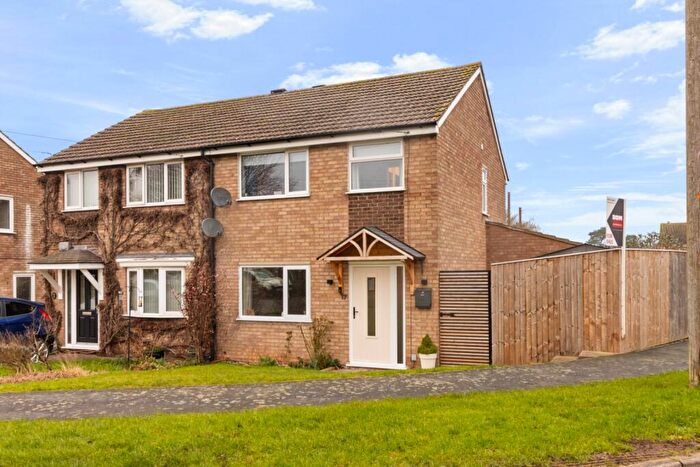
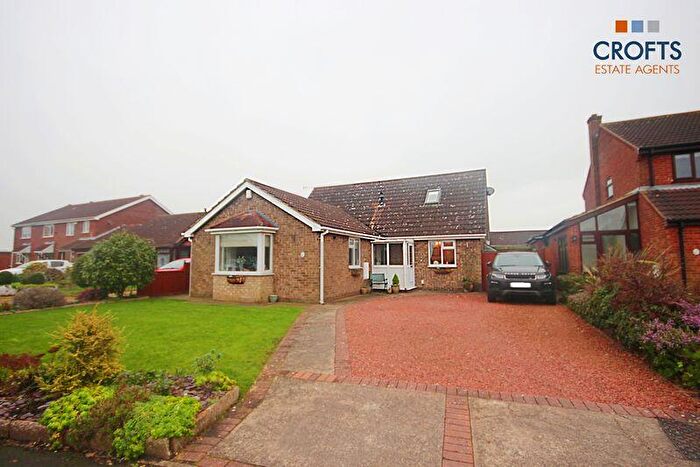
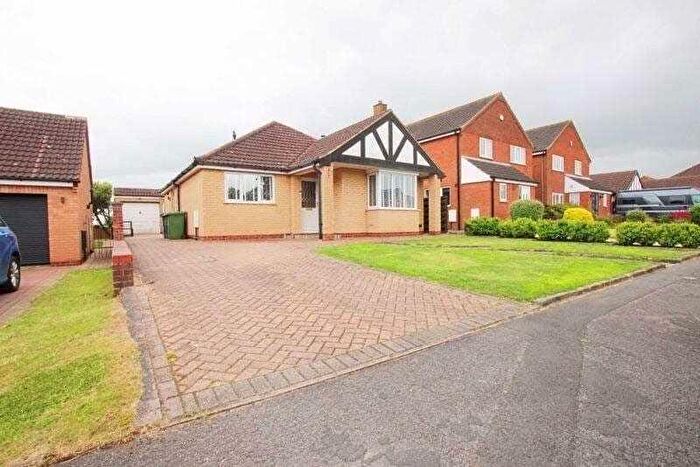
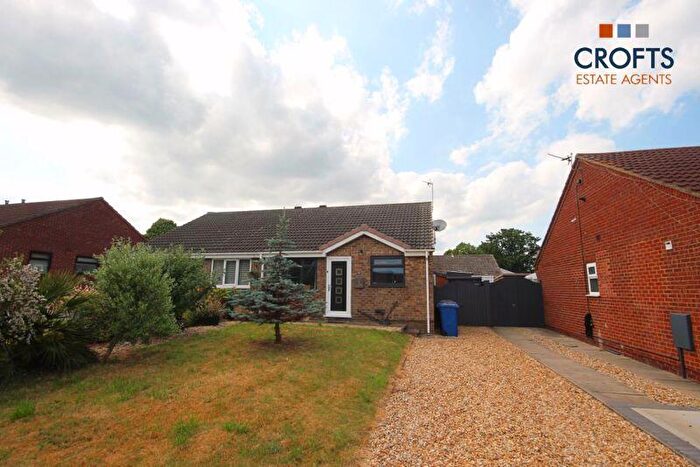
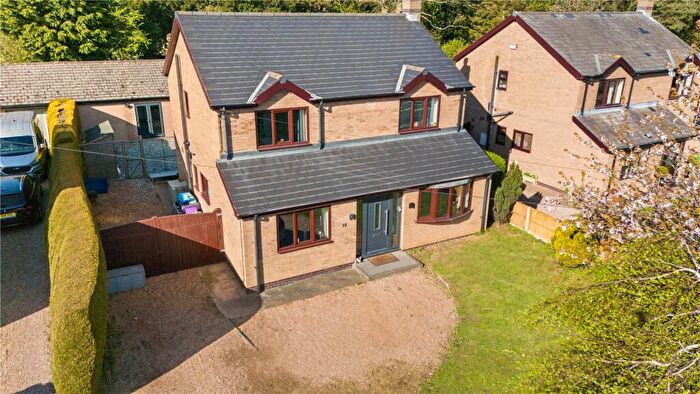
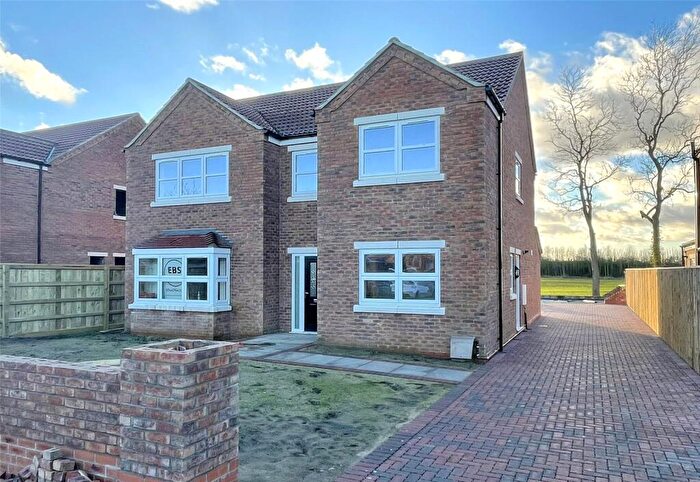
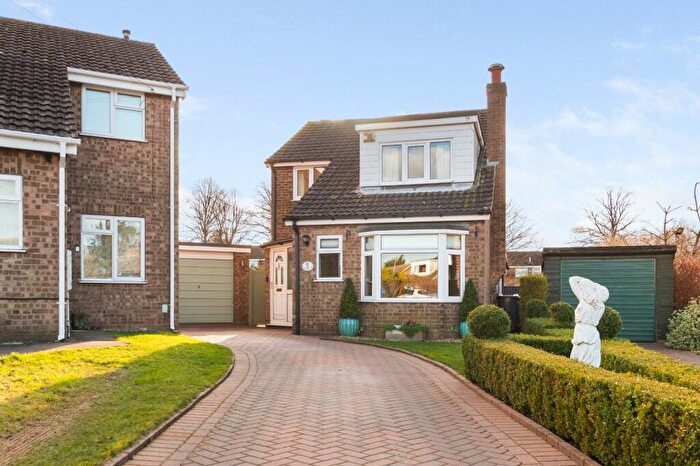
Properties for sale in Caistor and Yarborough
Roads and Postcodes in Caistor and Yarborough
Navigate through our locations to find the location of your next house in Caistor and Yarborough, Grimsby for sale or to rent.
| Streets | Postcodes |
|---|---|
| Addison Crescent | DN37 8NL |
| Barton Street | DN41 8TP |
| Brigg Road | DN37 8LQ |
| Broadway | DN41 8HW |
| Brocklesby Park | DN41 8FB DN41 8PJ DN41 8PN DN41 8PW |
| Caistor Road | DN37 8BF |
| Church Lane | DN37 8JN |
| Dixon Close | DN41 8JH |
| Halls Lane | DN41 8DE |
| Limber Hill | DN37 8NA |
| Little Limber | DN37 8LH DN37 8LJ |
| Main Road | DN41 8PP |
| Maux Hall | DN37 8LW |
| Mill Lane | DN41 8HB |
| North End | DN41 8JQ |
| Old Oak Tree Drive | DN41 8FP |
| Riby Church Hill | DN37 8NX |
| Riby Park | DN37 8NU |
| St Annes Road | DN41 8HH |
| St Martins Place | DN41 8EA |
| Stone Pit Lane | DN41 8NB |
| The Paddocks | DN41 8FA |
| Vicarage View | DN37 8JR |
| DN37 8JT DN37 8LY DN37 8LZ DN37 8NF DN37 8NP DN37 8NR DN37 8NS DN37 8NT DN41 8HS |
Transport near Caistor and Yarborough
- FAQ
- Price Paid By Year
- Property Type Price
Frequently asked questions about Caistor and Yarborough
What is the average price for a property for sale in Caistor and Yarborough?
The average price for a property for sale in Caistor and Yarborough is £475,000. This amount is 97% higher than the average price in Grimsby. There are 254 property listings for sale in Caistor and Yarborough.
Which train stations are available in or near Caistor and Yarborough?
Some of the train stations available in or near Caistor and Yarborough are Habrough, Stallingborough and Ulceby.
Property Price Paid in Caistor and Yarborough by Year
The average sold property price by year was:
| Year | Average Sold Price | Price Change |
Sold Properties
|
|---|---|---|---|
| 2024 | £475,000 | 16% |
1 Property |
| 2022 | £400,000 | -25% |
1 Property |
| 2021 | £499,000 | 75% |
1 Property |
| 2020 | £123,000 | 1% |
1 Property |
| 2019 | £122,000 | -58% |
2 Properties |
| 2018 | £193,000 | 8% |
4 Properties |
| 2017 | £177,625 | 16% |
4 Properties |
| 2016 | £150,000 | -8% |
1 Property |
| 2008 | £162,000 | 17% |
1 Property |
| 2004 | £135,000 | 56% |
1 Property |
| 2002 | £59,950 | - |
1 Property |
Property Price per Property Type in Caistor and Yarborough
Here you can find historic sold price data in order to help with your property search.
The average Property Paid Price for specific property types in the last three years are:
| Property Type | Average Sold Price | Sold Properties |
|---|---|---|
| Detached House | £475,000.00 | 1 Detached House |

