
Houses for sale & to rent in Grimoldby, Louth
House Prices in Grimoldby
Properties in Grimoldby have an average house price of £231k and had 84 Property Transactions within the last 3 years¹.
Grimoldby is an area in Louth, Lincolnshire with 914 households², where the most expensive property was sold for £585k.
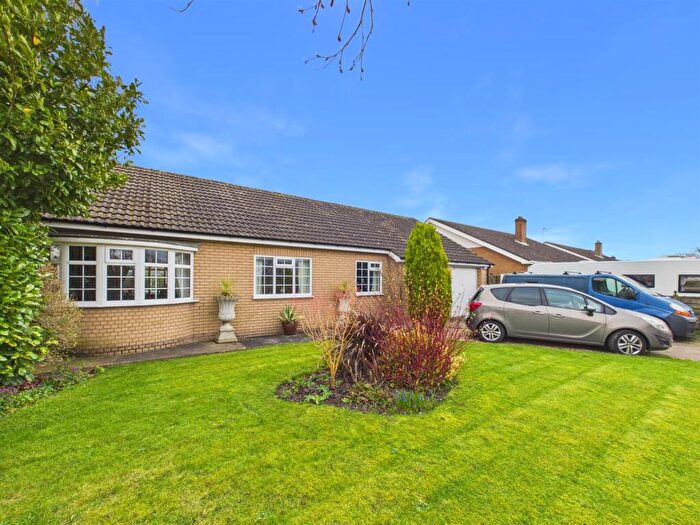
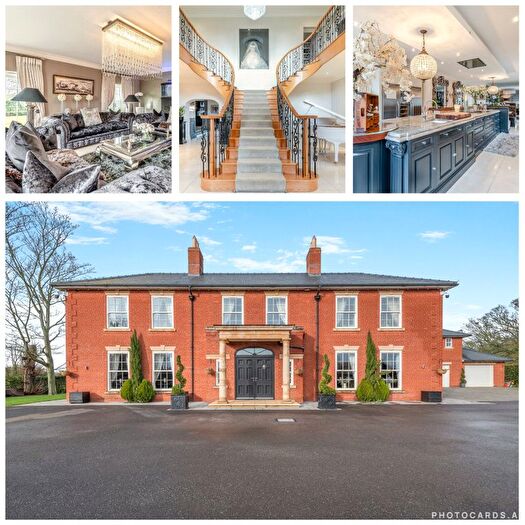
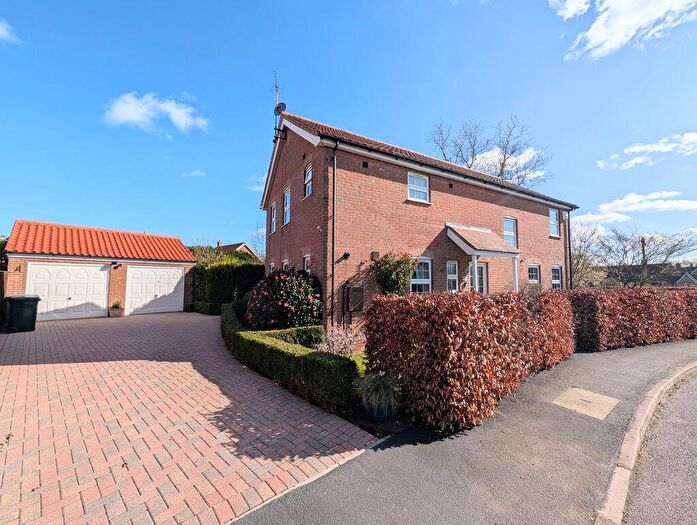
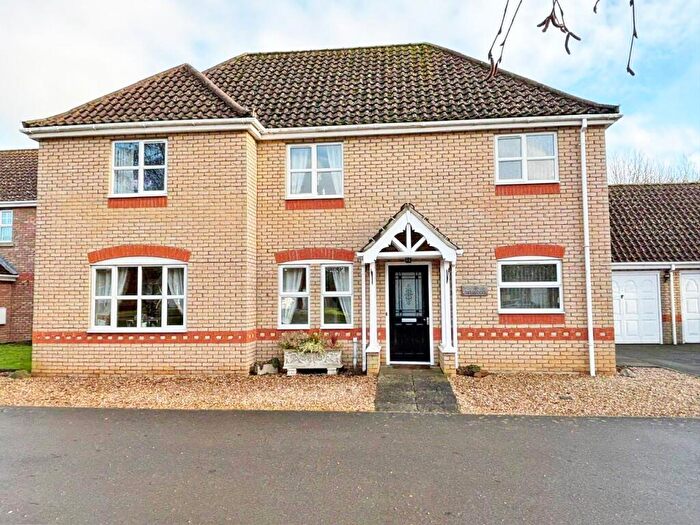
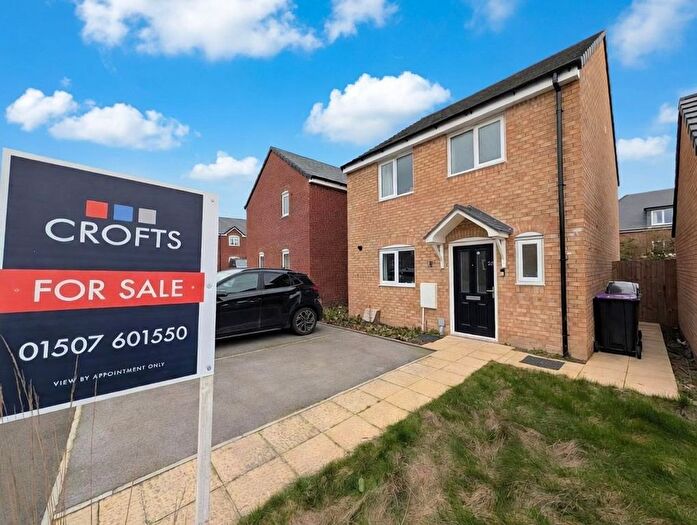
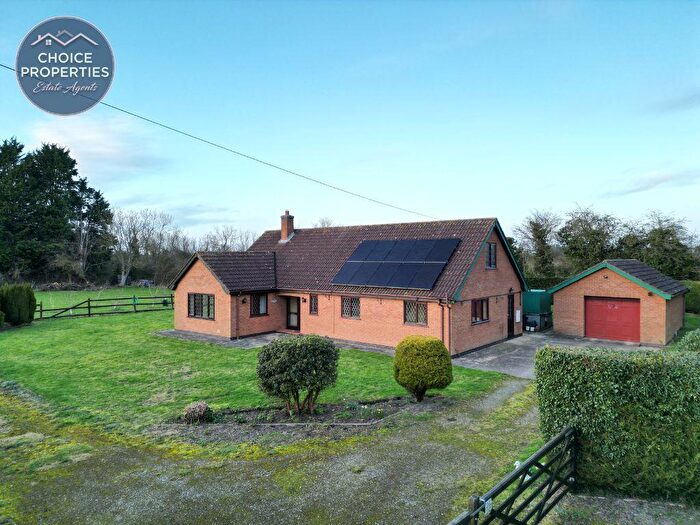
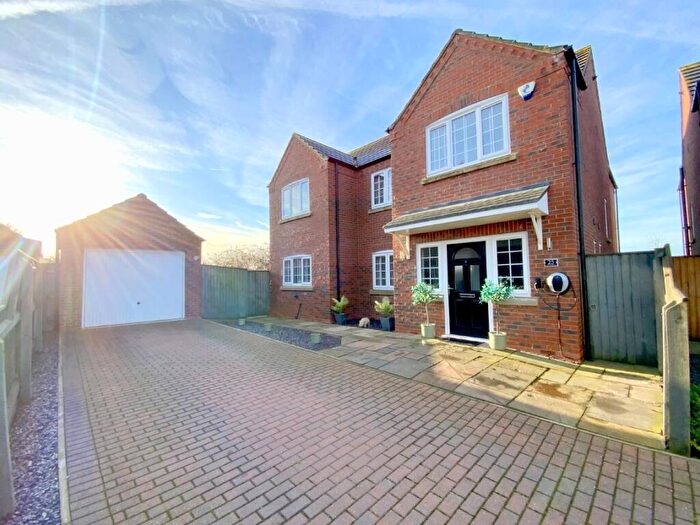
Properties for sale in Grimoldby
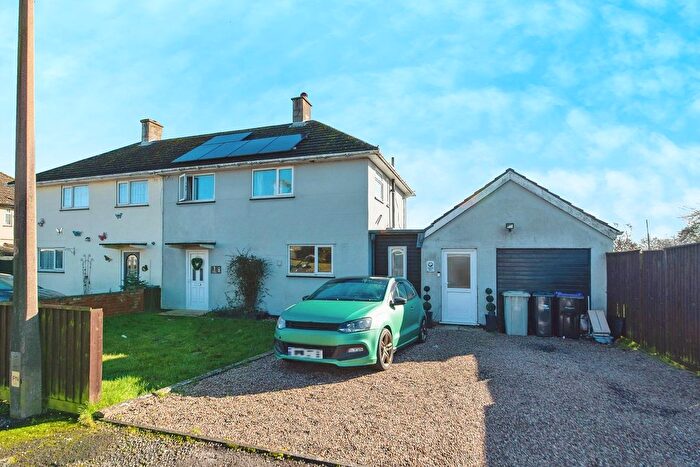
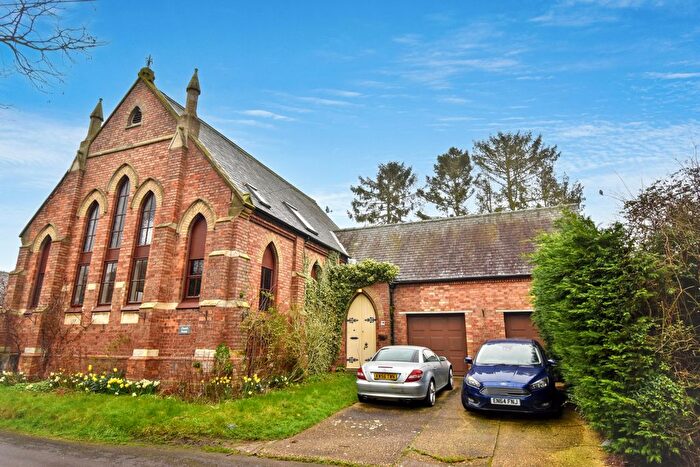
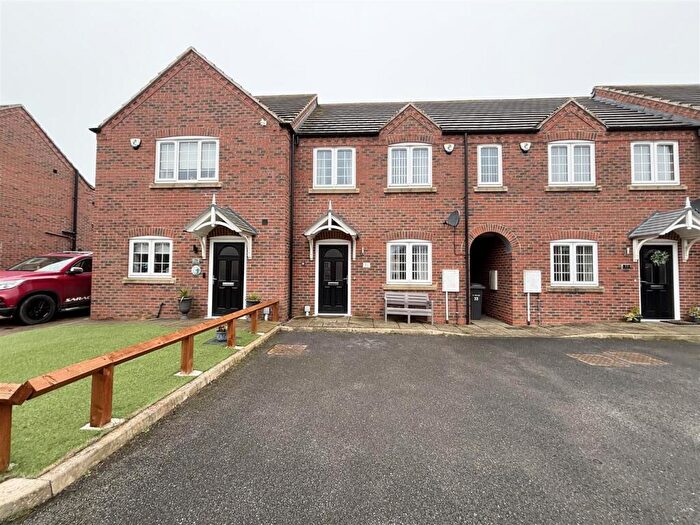
![]()
If you are looking to sell your house, let it out, or receive a property valuation, an expert can help you.
Click the button below to get started.


Roads and Postcodes in Grimoldby
Navigate through our locations to find the location of your next house in Grimoldby, Louth for sale or to rent.
Transport near Grimoldby
-
 Cleethorpes Station
 -
Grimsby Town Station
-
New Clee Station
-
Grimsby Docks Station
-
Great Coates Station
-
Thorpe Culvert Station
-
Market Rasen Station
-
Healing Station
-
Skegness Station
-
Stallingborough Station
- FAQ
- Price Paid By Year
- Property Type Price
Frequently asked questions about Grimoldby
What is the average price for a property for sale in Grimoldby?
The average price for a property for sale in Grimoldby is £230,635. This amount is 8% lower than the average price in Louth. There are 561 property listings for sale in Grimoldby.
What streets have the most expensive properties for sale in Grimoldby?
The streets with the most expensive properties for sale in Grimoldby are Church Lane at an average of £391,250, Meadow Lane at an average of £377,500 and Northgate Lane at an average of £376,500.
What streets have the most affordable properties for sale in Grimoldby?
The streets with the most affordable properties for sale in Grimoldby are Carlton Park at an average of £122,700, Gauntlet Road at an average of £129,000 and Spitfire Avenue at an average of £140,500.
Which train stations are available in or near Grimoldby?
Some of the train stations available in or near Grimoldby are Cleethorpes, Grimsby Town and New Clee.
Property Price Paid in Grimoldby by Year
The average sold property price by year was:
| Year | Average Sold Price | Price Change |
Sold Properties
|
|---|---|---|---|
| 2025 | £221,196 | -7% |
28 Properties |
| 2024 | £235,790 | 0,3% |
22 Properties |
| 2023 | £235,073 | -25% |
34 Properties |
| 2022 | £295,015 | 27% |
33 Properties |
| 2021 | £216,799 | 10% |
63 Properties |
| 2020 | £195,930 | -6% |
36 Properties |
| 2019 | £208,372 | 9% |
46 Properties |
| 2018 | £189,357 | 1% |
66 Properties |
| 2017 | £186,587 | 2% |
59 Properties |
| 2016 | £183,311 | -5% |
46 Properties |
| 2015 | £192,640 | 28% |
32 Properties |
| 2014 | £139,393 | -10% |
38 Properties |
| 2013 | £153,961 | 3% |
43 Properties |
| 2012 | £148,863 | -8% |
26 Properties |
| 2011 | £160,791 | 16% |
24 Properties |
| 2010 | £135,270 | -9% |
31 Properties |
| 2009 | £147,833 | 5% |
21 Properties |
| 2008 | £140,055 | -25% |
27 Properties |
| 2007 | £175,547 | 13% |
49 Properties |
| 2006 | £153,264 | 8% |
55 Properties |
| 2005 | £140,367 | 9% |
46 Properties |
| 2004 | £127,245 | 6% |
60 Properties |
| 2003 | £120,018 | 13% |
51 Properties |
| 2002 | £104,852 | 35% |
54 Properties |
| 2001 | £68,091 | -2% |
55 Properties |
| 2000 | £69,302 | 14% |
49 Properties |
| 1999 | £59,857 | -17% |
44 Properties |
| 1998 | £70,234 | 31% |
41 Properties |
| 1997 | £48,577 | -7% |
56 Properties |
| 1996 | £52,203 | 6% |
41 Properties |
| 1995 | £49,049 | - |
36 Properties |
Property Price per Property Type in Grimoldby
Here you can find historic sold price data in order to help with your property search.
The average Property Paid Price for specific property types in the last three years are:
| Property Type | Average Sold Price | Sold Properties |
|---|---|---|
| Semi Detached House | £172,125.00 | 27 Semi Detached Houses |
| Detached House | £290,411.00 | 45 Detached Houses |
| Terraced House | £138,125.00 | 12 Terraced Houses |