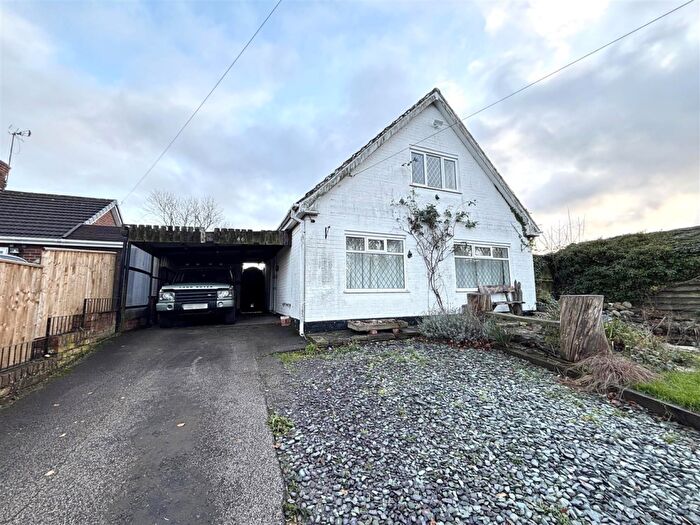
Houses for sale & to rent in St Michaels, Louth
House Prices in St Michaels
Properties in St Michaels have an average house price of £220,196.76 and had 111 Property Transactions within the last 3 years¹.
St Michaels is an area in Louth, Lincolnshire with 1,078 households², where the most expensive property was sold for £445,000.00.
Properties for sale in St Michaels
Roads and Postcodes in St Michaels
Navigate through our locations to find the location of your next house in St Michaels, Louth for sale or to rent.
| Streets | Postcodes |
|---|---|
| Alder Close | LN11 8XB |
| Alexander Drive | LN11 8QG |
| Beck Way | LN11 8XH |
| Beckside Court | LN11 8ED |
| Beeton Close | LN11 8FE |
| Birch Road | LN11 8DU |
| Blanchard Road | LN11 8YH |
| Bradley Close | LN11 8YL |
| Buddleia Drive | LN11 8FX |
| Burton Court | LN11 8RJ |
| Camellia Grove | LN11 8FP |
| Cullingford Way | LN11 9FN |
| Eresbie Road | LN11 8YG |
| Florence Wright Avenue | LN11 8EJ |
| Forsythia Avenue | LN11 8FT |
| Fowler Close | LN11 8FF |
| Graye Drive | LN11 8YJ |
| Gresley Road | LN11 8FD LN11 8FG |
| Havelock Close | LN11 8SJ |
| Hawker Drive | LN11 8SH |
| Hazel Grove | LN11 8RU |
| Holly Crescent | LN11 8FQ |
| Honeysuckle Close | LN11 8GF |
| Kenwick Close | LN11 8EP |
| Kenwick Gardens | LN11 8EZ |
| Kenwick Road | LN11 8EF LN11 8EH LN11 8EL LN11 8NL |
| Laburnum Crescent | LN11 8SG |
| Langley Close | LN11 8YP |
| Lavender Way | LN11 8FN LN11 8GH |
| Legbourne Road | LN11 8ER LN11 8ES |
| Lindsey Way | LN11 8RP |
| Marjorie Lane | LN11 9EU |
| Mayfield Crescent | LN11 8EQ |
| Minster Drive | LN11 8SN |
| Mount Pleasant | LN11 9DN |
| Mount Pleasant Avenue | LN11 9DH LN11 9DJ |
| Newmarket | LN11 9EJ |
| Oak Close | LN11 8SQ GU15 3FG |
| Pasture Drive | LN11 8XA |
| Queens Court | LN11 8RR |
| Queensway | LN11 8AZ |
| Quorn Gardens | LN11 8QF |
| Sherwood Close | LN11 9YX |
| Simons Close | LN11 8XJ |
| Southlands Avenue | LN11 8EW |
| Spire View Road | LN11 8SL |
| St Bernards Avenue | LN11 8BH LN11 8BQ |
| Stewton Lane | LN11 8RZ LN11 8SB |
| Stutte Close | LN11 8YN |
| Sycamore Drive | LN11 8RT |
| Taylors Garden | LN11 9DP |
| Wallis Road | LN11 8DS |
| Watts Lane | LN11 9DG |
| Wood Lane | LN11 8RS LN11 8RX LN11 8RY LN11 8SA |
| Woodway | LN11 8BG |
Transport near St Michaels
- FAQ
- Price Paid By Year
- Property Type Price
Frequently asked questions about St Michaels
What is the average price for a property for sale in St Michaels?
The average price for a property for sale in St Michaels is £220,197. This amount is 12% lower than the average price in Louth. There are 1,653 property listings for sale in St Michaels.
What streets have the most expensive properties for sale in St Michaels?
The streets with the most expensive properties for sale in St Michaels are Blanchard Road at an average of £345,880, Langley Close at an average of £303,333 and Eresbie Road at an average of £263,750.
What streets have the most affordable properties for sale in St Michaels?
The streets with the most affordable properties for sale in St Michaels are Burton Court at an average of £142,500, Newmarket at an average of £143,750 and Watts Lane at an average of £158,857.
Which train stations are available in or near St Michaels?
Some of the train stations available in or near St Michaels are Cleethorpes, Market Rasen and Grimsby Town.
Property Price Paid in St Michaels by Year
The average sold property price by year was:
| Year | Average Sold Price | Price Change |
Sold Properties
|
|---|---|---|---|
| 2025 | £226,300 | -0,1% |
25 Properties |
| 2024 | £226,422.72 | 8% |
46 Properties |
| 2023 | £209,222.38 | -20% |
40 Properties |
| 2022 | £251,755 | 11% |
39 Properties |
| 2021 | £223,518.63 | 17% |
51 Properties |
| 2020 | £185,750 | -7% |
27 Properties |
| 2019 | £198,122.55 | 5% |
51 Properties |
| 2018 | £188,576 | 14% |
43 Properties |
| 2017 | £162,227.16 | -6% |
58 Properties |
| 2016 | £171,423.36 | -0,4% |
55 Properties |
| 2015 | £172,110 | 4% |
53 Properties |
| 2014 | £164,582 | 10% |
49 Properties |
| 2013 | £148,669 | 4% |
42 Properties |
| 2012 | £142,536 | -4% |
41 Properties |
| 2011 | £148,336 | 3% |
33 Properties |
| 2010 | £143,545 | -1% |
31 Properties |
| 2009 | £145,197 | -3% |
33 Properties |
| 2008 | £149,363 | -4% |
22 Properties |
| 2007 | £155,864 | 1% |
44 Properties |
| 2006 | £154,916 | 5% |
62 Properties |
| 2005 | £147,806 | 8% |
46 Properties |
| 2004 | £136,312 | 15% |
50 Properties |
| 2003 | £116,415 | 26% |
55 Properties |
| 2002 | £86,537 | -2% |
104 Properties |
| 2001 | £88,287 | 16% |
102 Properties |
| 2000 | £74,456 | 16% |
87 Properties |
| 1999 | £62,188 | 1% |
105 Properties |
| 1998 | £61,648 | 16% |
64 Properties |
| 1997 | £51,945 | 11% |
62 Properties |
| 1996 | £46,218 | -9% |
48 Properties |
| 1995 | £50,604 | - |
35 Properties |
Property Price per Property Type in St Michaels
Here you can find historic sold price data in order to help with your property search.
The average Property Paid Price for specific property types in the last three years are:
| Property Type | Average Sold Price | Sold Properties |
|---|---|---|
| Semi Detached House | £206,311.90 | 50 Semi Detached Houses |
| Detached House | £286,656.76 | 37 Detached Houses |
| Terraced House | £147,823.00 | 23 Terraced Houses |
| Flat | £120,000.00 | 1 Flat |

