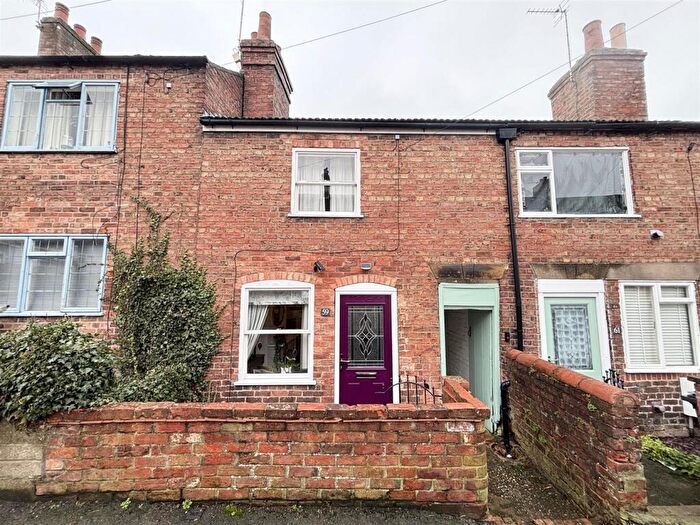
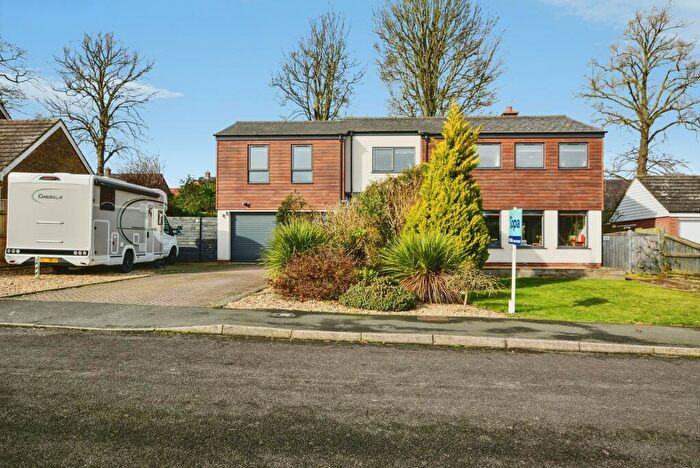
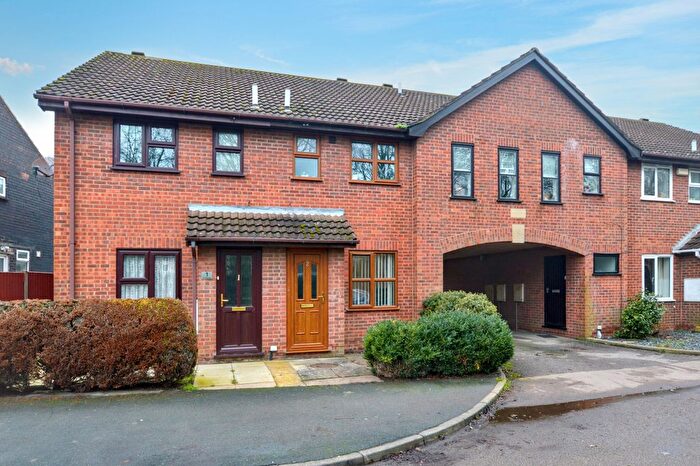
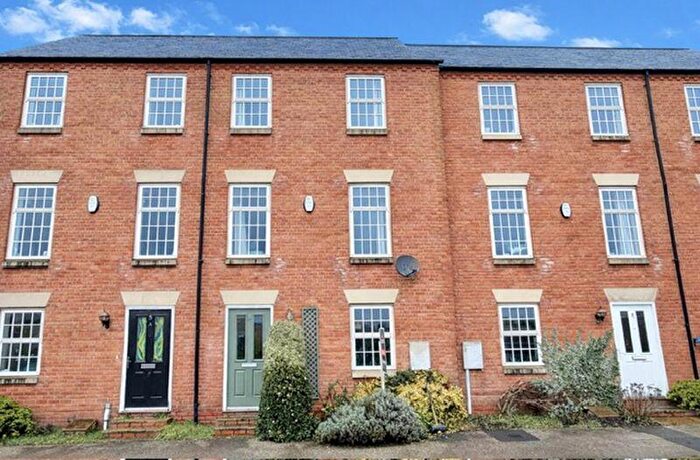
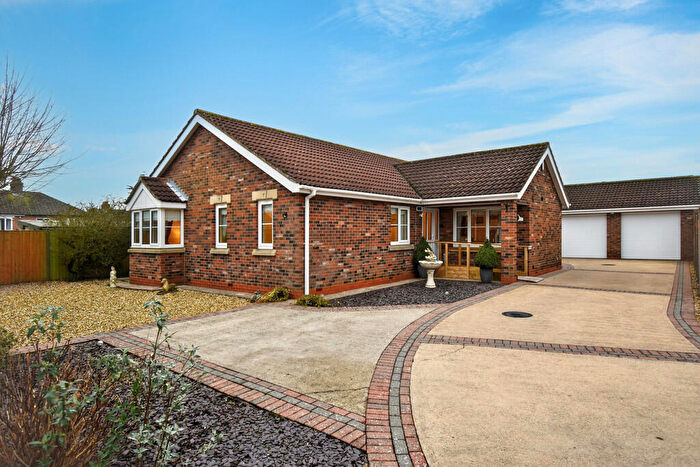
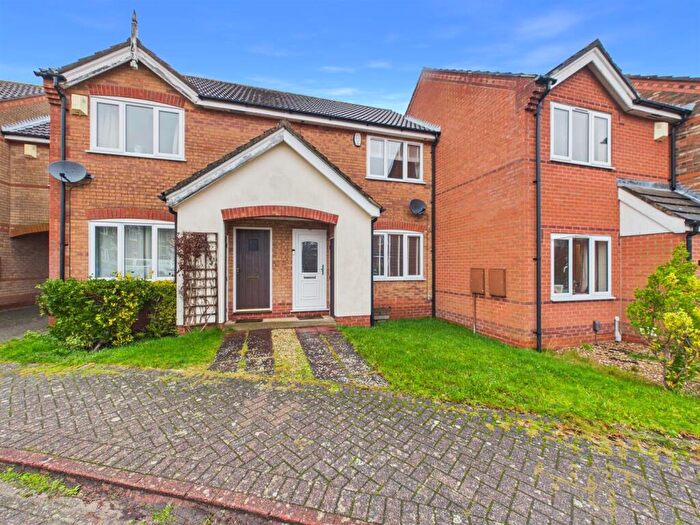
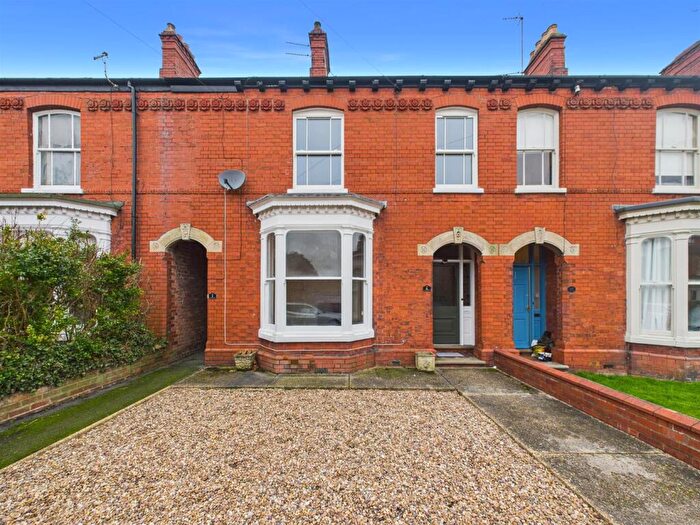
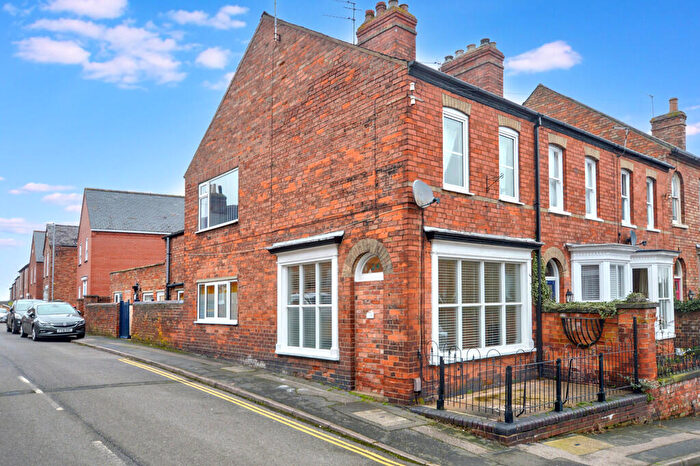
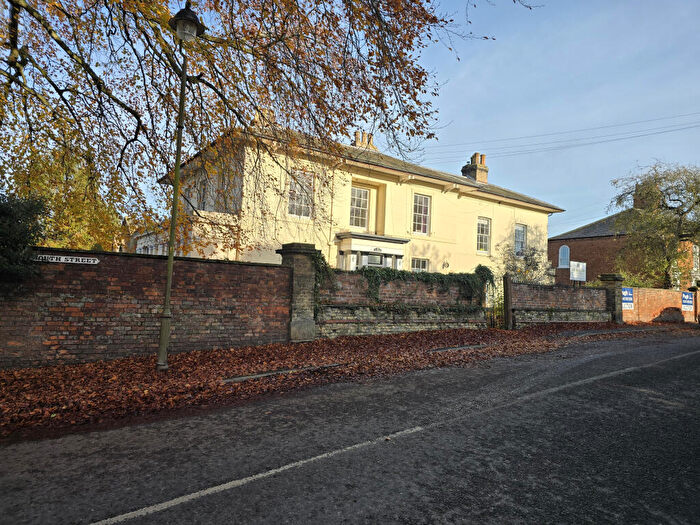
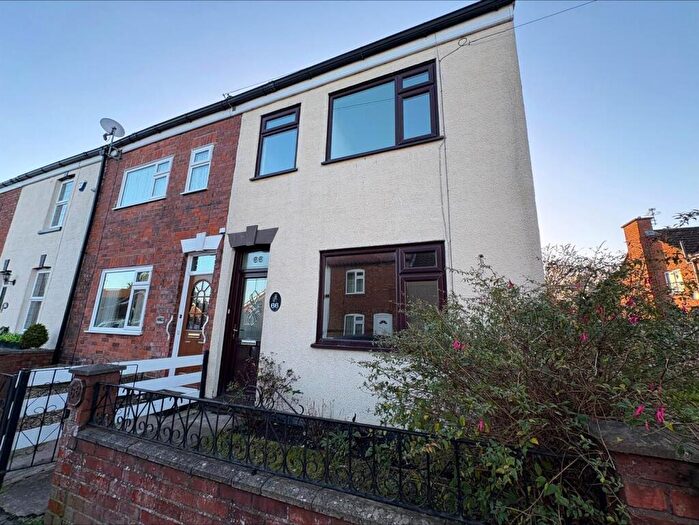
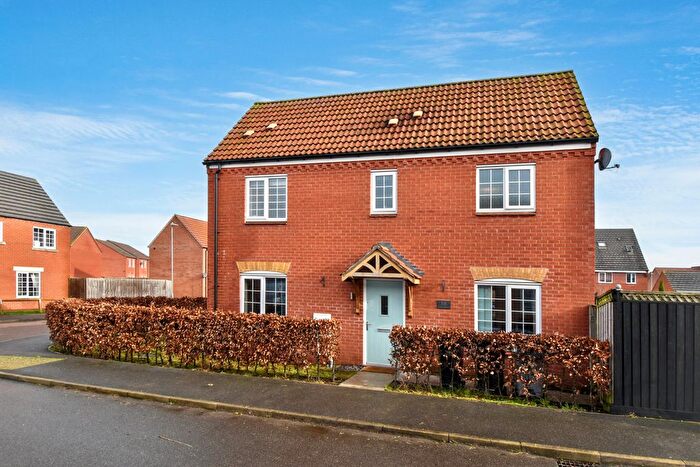
Houses for sale & to rent in St James, Louth
House Prices in St James
Properties in St James have an average house price of £218,409.00 and had 121 Property Transactions within the last 3 years¹.
St James is an area in Louth, Lincolnshire with 1,127 households², where the most expensive property was sold for £910,000.00.
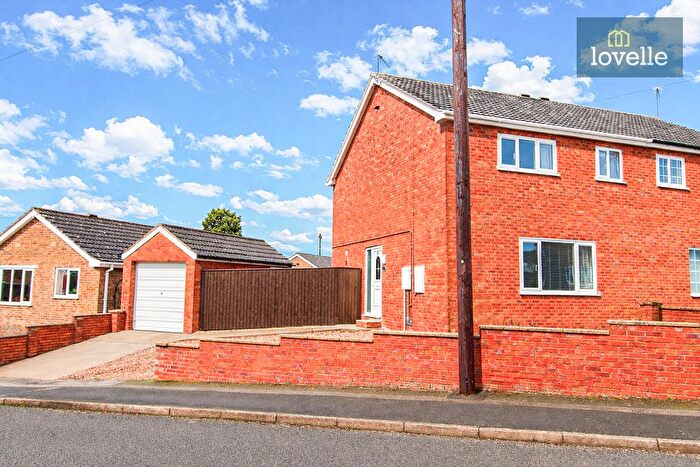
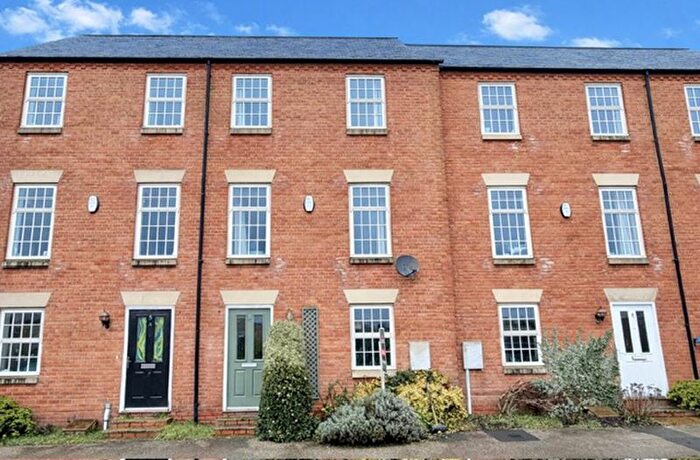
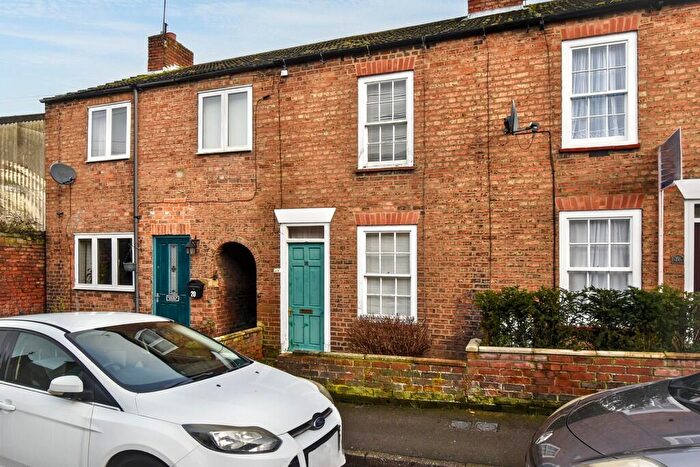
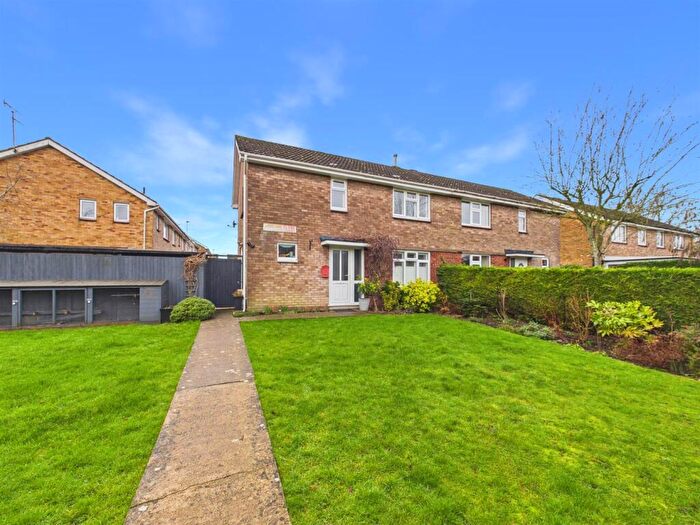
Properties for sale in St James
Roads and Postcodes in St James
Navigate through our locations to find the location of your next house in St James, Louth for sale or to rent.
| Streets | Postcodes |
|---|---|
| Alexandra Road | LN11 0ND |
| Allison Road | LN11 0GL |
| Avalon Way | LN11 0GW |
| Bolle Road | LN11 0GR |
| Bridge Close | LN11 0PT |
| Bridge Street | LN11 0DP LN11 0DR |
| Broadbank | LN11 0EN LN11 0EQ LN11 0EW |
| Cannon Street | LN11 9NL |
| Cedar Close | LN11 0EH |
| Charles Street | LN11 0LB LN11 0LE |
| Chequergate | LN11 0LH |
| Cistern Gate | LN11 0ER |
| Commercial Road | LN11 7AA |
| Cornish Way | LN11 0GS |
| Eastgate | LN11 8DB LN11 9AJ LN11 9PL LN11 9QE |
| Eve Street | LN11 0JJ LN11 0JL |
| Grays Court | LN11 0FG |
| Grays Road | LN11 0EL |
| Grimsby Road | LN11 0DX |
| Hawthorne Avenue | LN11 0LD |
| High Holme Road | LN11 0ET LN11 0EY LN11 0HE LN11 0JX |
| James Court | LN11 0JY |
| James Street | LN11 0JN LN11 0JR LN11 0JW LN11 0NN |
| Kiln Lane | LN11 0LG LN11 0LU |
| Kings Mews | LN11 0HW |
| Michael Foale Lane | LN11 0GT |
| Millers Court | LN11 0BF |
| Newbridge Hill | LN11 0JU LN11 0NQ |
| Nichol Hill | LN11 9NQ |
| Northgate | LN11 0LN LN11 0LR LN11 0LT LN11 0LY |
| Northgate Court | LN11 0LZ |
| Old Mill Park | LN11 0NY |
| Orchard Close | LN11 0BS |
| Parsons Halt | LN11 0UB |
| Pleasant Place | LN11 0NA |
| Pullman Terrace | LN11 0NH |
| Ramsgate | LN11 0NB LN11 0NE LN11 0NG |
| Ramsgate Road | LN11 0NJ |
| Spaw Lane | LN11 0EJ |
| Spout Yard | LN11 0LW |
| Spring Terrace | LN11 0LP |
| St Marys Lane | LN11 0DU |
| Station Approach | LN11 0PS |
| Temple Terrace | LN11 0EP |
| The Sidings | LN11 0PX |
| Trinity Court | LN11 7AZ |
| Union Street | LN11 0ES |
| Vickers Lane | LN11 9PJ |
| Victoria Road | LN11 0BU |
| Wellington Mews | LN11 0GH |
| Wellington Street | LN11 0JS |
| Westgate | LN11 9YD LN11 9YH |
| Woodlands | LN11 0WS |
Transport near St James
-
Cleethorpes Station
-
Grimsby Town Station
-
Market Rasen Station
-
New Clee Station
-
Grimsby Docks Station
- FAQ
- Price Paid By Year
- Property Type Price
Frequently asked questions about St James
What is the average price for a property for sale in St James?
The average price for a property for sale in St James is £218,409. This amount is 13% lower than the average price in Louth. There are 1,906 property listings for sale in St James.
What streets have the most expensive properties for sale in St James?
The streets with the most expensive properties for sale in St James are St Marys Lane at an average of £675,000, Woodlands at an average of £540,000 and Kiln Lane at an average of £372,600.
What streets have the most affordable properties for sale in St James?
The streets with the most affordable properties for sale in St James are Northgate Court at an average of £88,000, Eve Street at an average of £102,500 and Northgate at an average of £126,375.
Which train stations are available in or near St James?
Some of the train stations available in or near St James are Cleethorpes, Grimsby Town and Market Rasen.
Property Price Paid in St James by Year
The average sold property price by year was:
| Year | Average Sold Price | Price Change |
Sold Properties
|
|---|---|---|---|
| 2025 | £202,020 | -24% |
40 Properties |
| 2024 | £250,793 | 23% |
47 Properties |
| 2023 | £192,926 | 2% |
34 Properties |
| 2022 | £189,559 | 16% |
58 Properties |
| 2021 | £159,407 | -7% |
72 Properties |
| 2020 | £169,818 | 10% |
58 Properties |
| 2019 | £153,426 | -6% |
47 Properties |
| 2018 | £162,426 | 0,1% |
58 Properties |
| 2017 | £162,296 | 5% |
58 Properties |
| 2016 | £154,209 | 15% |
66 Properties |
| 2015 | £131,603 | -14% |
74 Properties |
| 2014 | £150,543 | 6% |
54 Properties |
| 2013 | £141,848 | 20% |
53 Properties |
| 2012 | £113,191 | -25% |
54 Properties |
| 2011 | £141,840 | 6% |
38 Properties |
| 2010 | £132,625 | -18% |
40 Properties |
| 2009 | £156,449 | 11% |
45 Properties |
| 2008 | £140,011 | -1% |
70 Properties |
| 2007 | £141,518 | 9% |
95 Properties |
| 2006 | £129,005 | 2% |
108 Properties |
| 2005 | £126,001 | 2% |
76 Properties |
| 2004 | £123,495 | 22% |
93 Properties |
| 2003 | £96,275 | 30% |
77 Properties |
| 2002 | £67,394 | 7% |
80 Properties |
| 2001 | £62,615 | 18% |
79 Properties |
| 2000 | £51,072 | -9% |
74 Properties |
| 1999 | £55,817 | 12% |
66 Properties |
| 1998 | £48,882 | -9% |
79 Properties |
| 1997 | £53,232 | 19% |
81 Properties |
| 1996 | £42,986 | 4% |
81 Properties |
| 1995 | £41,206 | - |
80 Properties |
Property Price per Property Type in St James
Here you can find historic sold price data in order to help with your property search.
The average Property Paid Price for specific property types in the last three years are:
| Property Type | Average Sold Price | Sold Properties |
|---|---|---|
| Semi Detached House | £206,761.00 | 21 Semi Detached Houses |
| Detached House | £362,422.00 | 25 Detached Houses |
| Terraced House | £176,272.00 | 70 Terraced Houses |
| Flat | £137,200.00 | 5 Flats |

