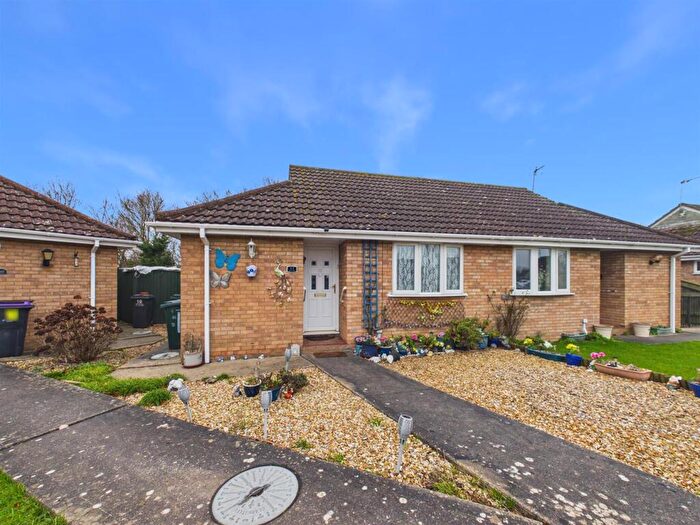
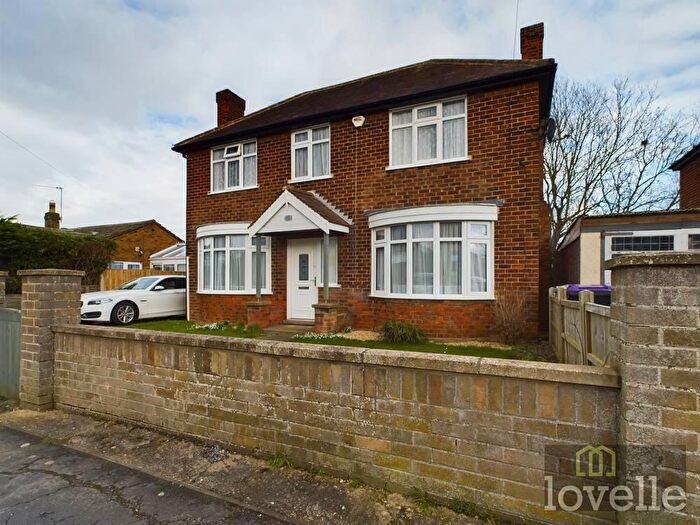
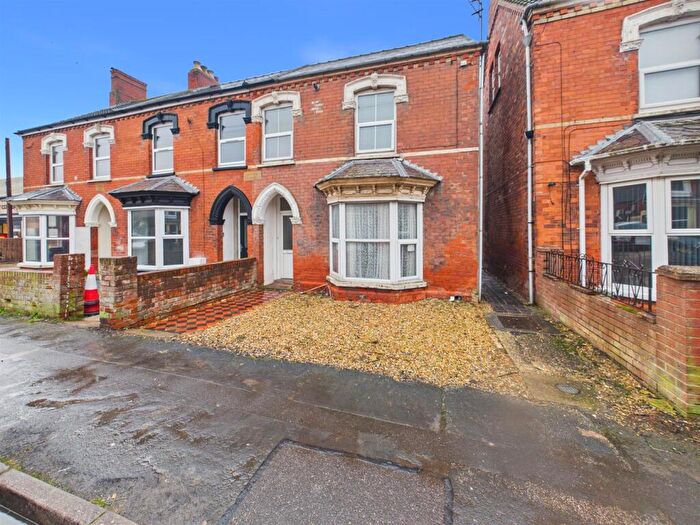
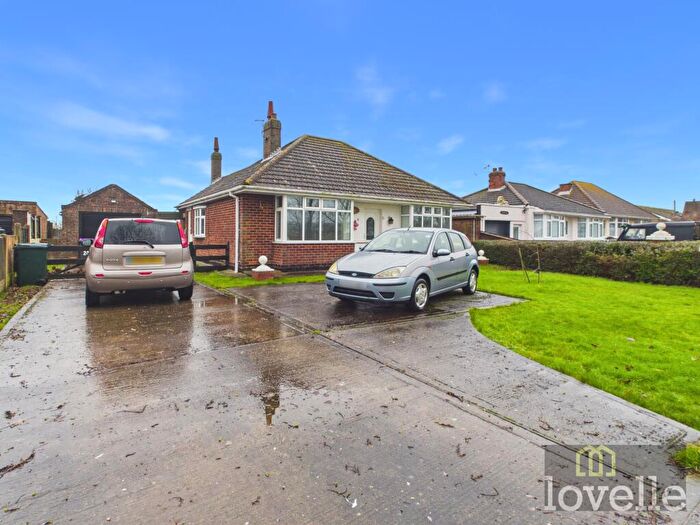
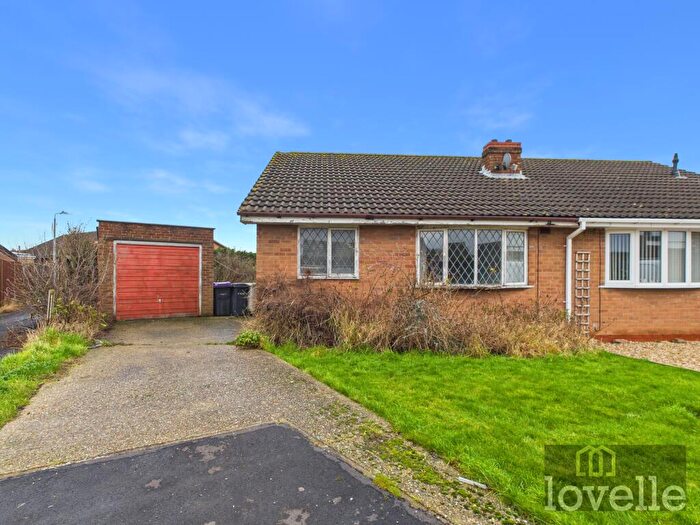
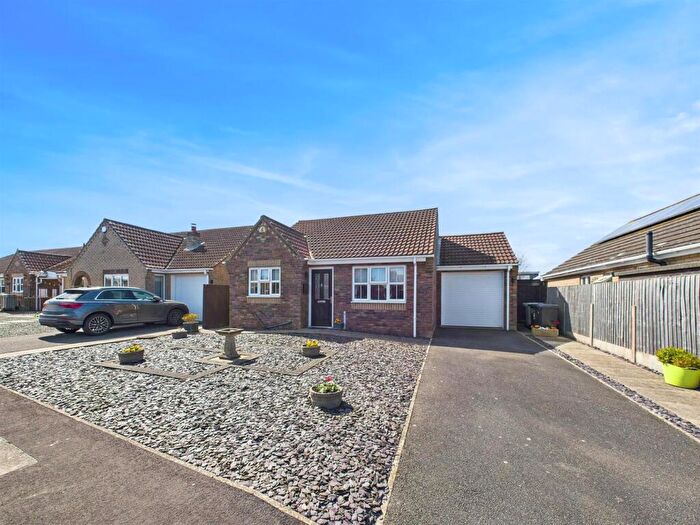
Houses for sale & to rent in Mablethorpe North, Mablethorpe
House Prices in Mablethorpe North
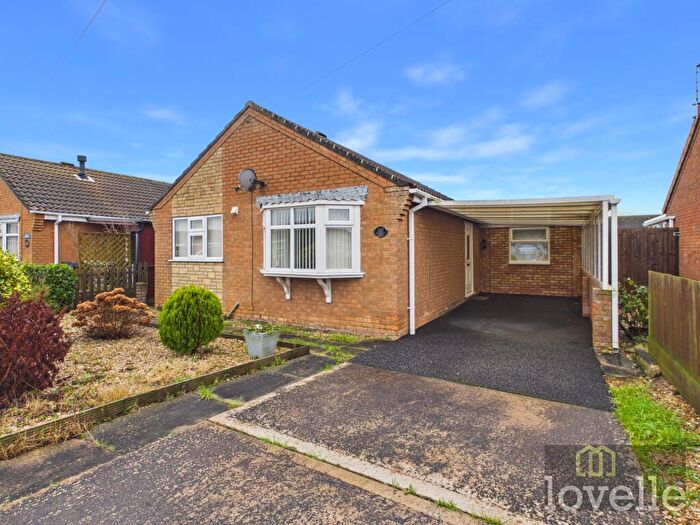
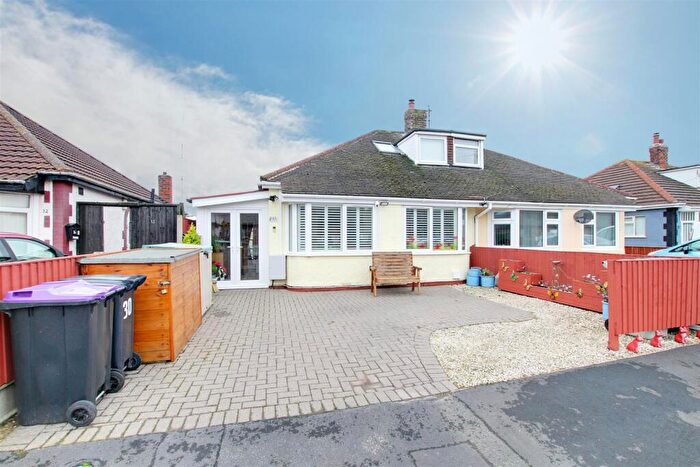
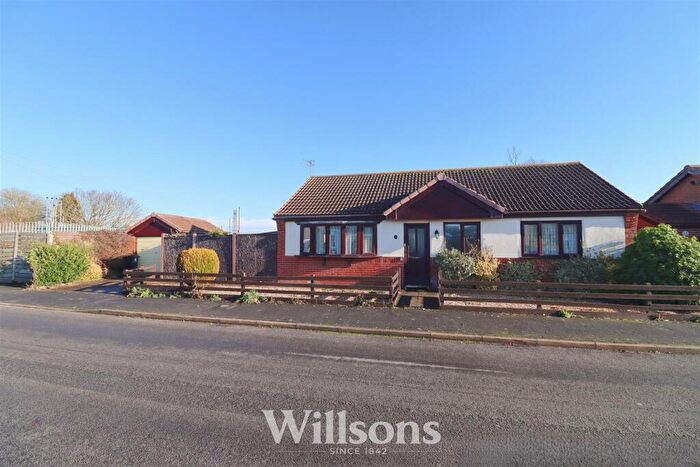
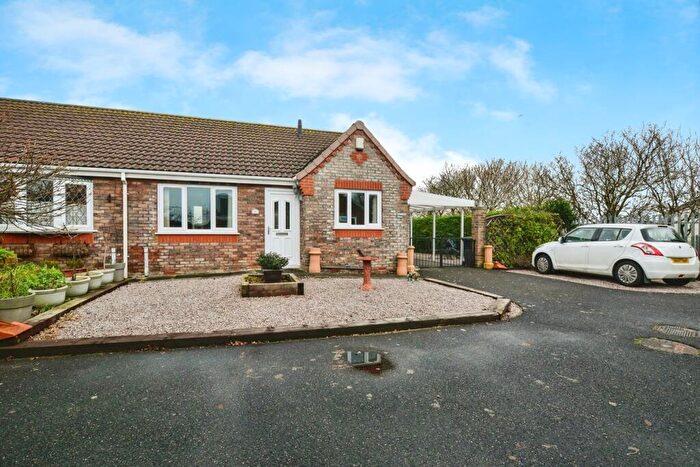
Properties in Mablethorpe North have an average house price of £179,824.00 and had 74 Property Transactions within the last 3 years¹.
Mablethorpe North is an area in Mablethorpe, Lincolnshire with 864 households², where the most expensive property was sold for £342,000.00.
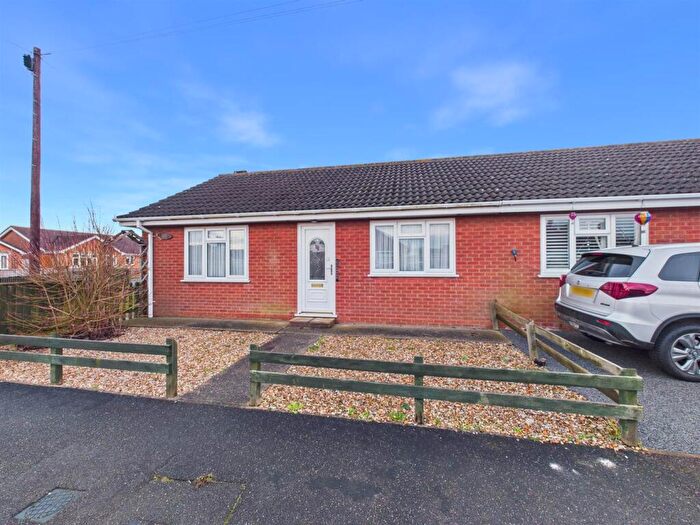
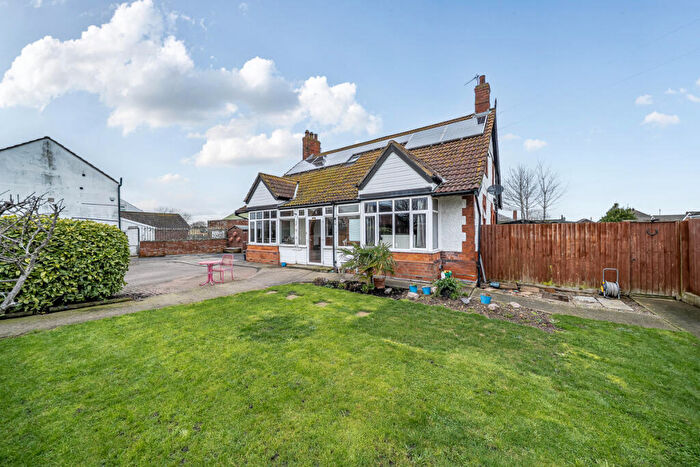
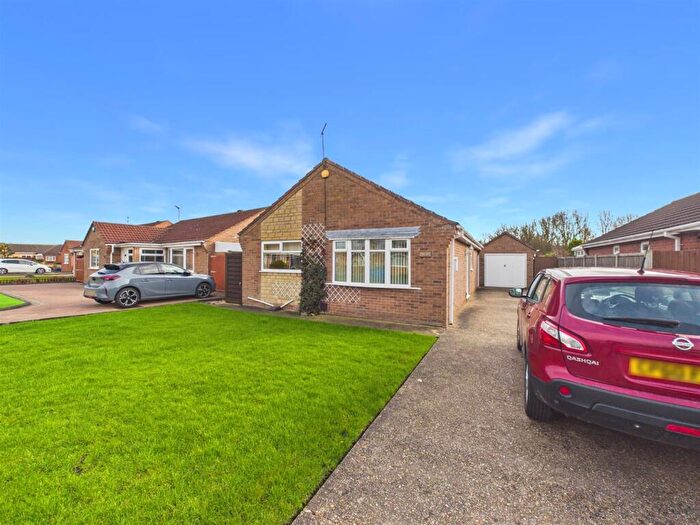
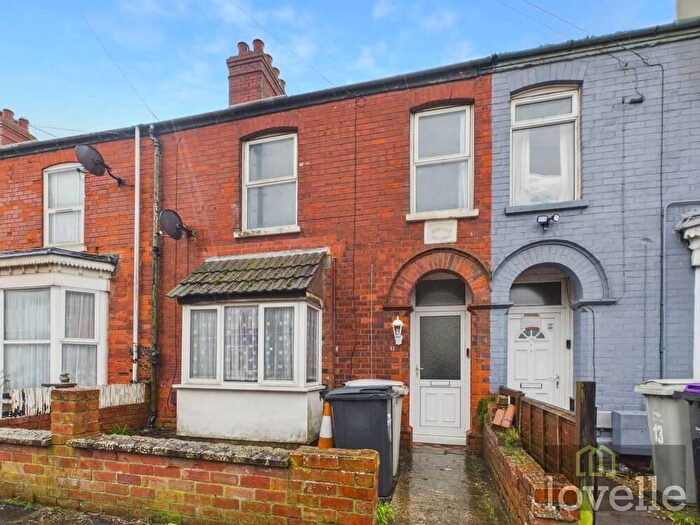
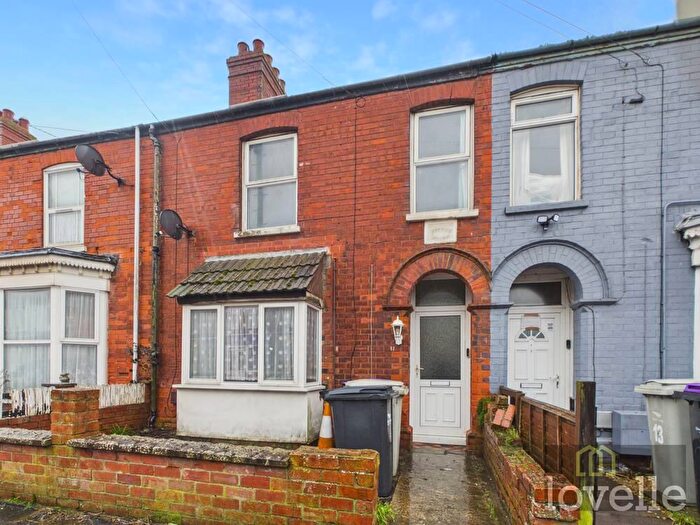
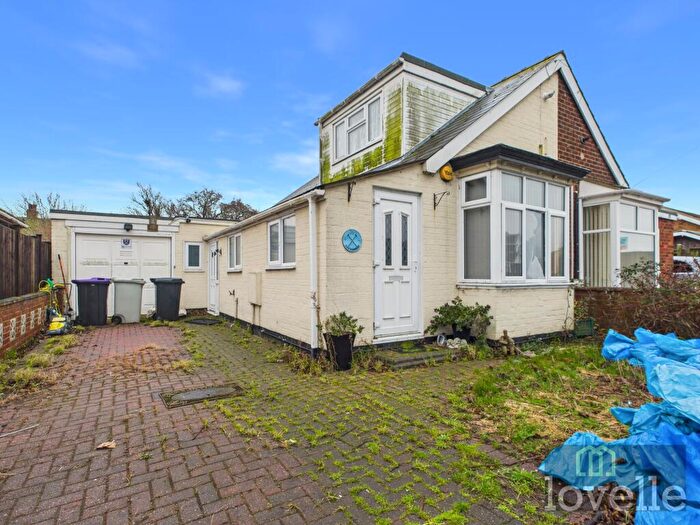
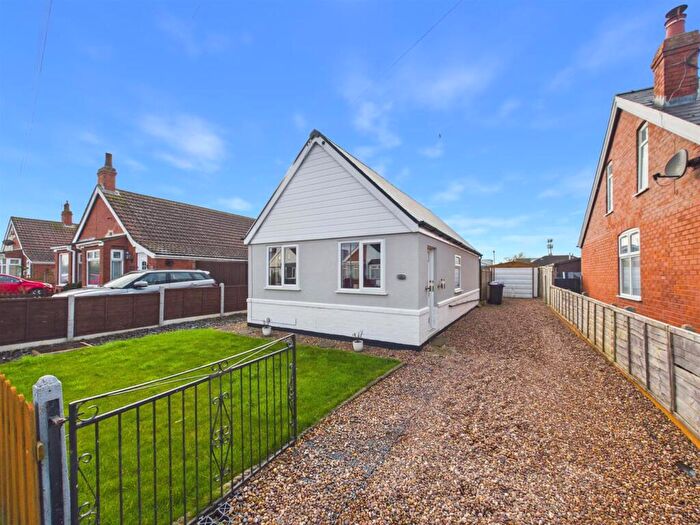
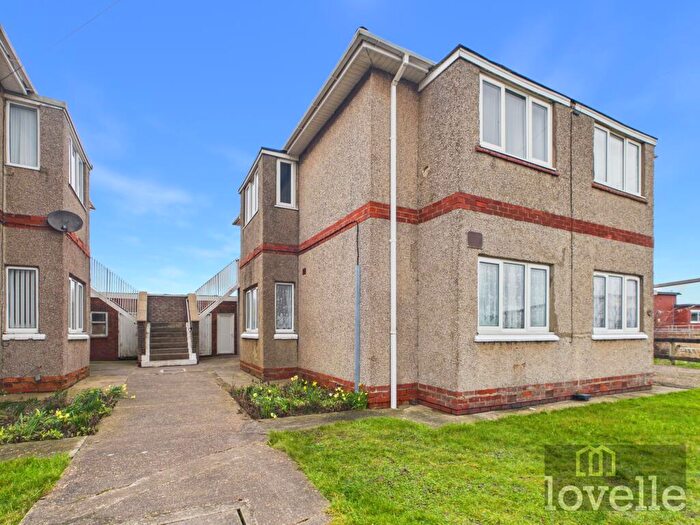
Properties for sale in Mablethorpe North
Roads and Postcodes in Mablethorpe North
Navigate through our locations to find the location of your next house in Mablethorpe North, Mablethorpe for sale or to rent.
| Streets | Postcodes |
|---|---|
| Alford Road | LN12 1NE |
| Byron Close | LN12 1LF |
| Byron Road | LN12 1HZ LN12 1JD LN12 1JE |
| Cambridge Road North | LN12 1QR |
| Cambridge Road South | LN12 1QW |
| Chalfont Avenue | LN12 1QP |
| Eagle Close | LN12 1JJ |
| Faldos Way | LN12 1NF |
| Golf Estate | LN12 1LN |
| Golf Road | LN12 1EZ LN12 1LH LN12 1LJ LN12 1LP LN12 1LR LN12 1LS LN12 1LW |
| Harrow Road | LN12 1JZ |
| Hickory Way | LN12 1NG |
| Ivel Close | LN12 1LZ LN12 1NA |
| Ivel Grove | LN12 1LY |
| Jacklin Crescent | LN12 1JH |
| Lindum Terrace | LN12 1QT |
| Links Avenue | LN12 1QL |
| Links Close | LN12 1QY |
| Long Acre | LN12 1JF |
| Lyle Close | LN12 1RH |
| Malvern Road | LN12 1LB |
| North End | LN12 1QG |
| Poplar Avenue | LN12 1QS |
| Quebec Road | LN12 1LT LN12 1LU |
| Queensway | LN12 1HW |
| Regent Road | LN12 1LG LN12 1LQ |
| Repton Road | LN12 1JY |
| Rose Grove | LN12 1NZ |
| Rugby Road | LN12 1LD |
| Sherwood Road | LN12 1HU |
| St Andrews Road | LN12 1JA LN12 1JB |
| The Drive | LN12 1LX |
| The Fairway | LN12 1LL |
| The Green | LN12 1JS |
| Theddlethorpe Road | LN12 1PZ LN12 1QA |
| Waterloo Road | LN12 1JU LN12 1JX LN12 1LA LN12 1LE |
| Wellington Road | LN12 1HT LN12 1HY |
| Windsor Road | LN12 1JW |
Transport near Mablethorpe North
- FAQ
- Price Paid By Year
- Property Type Price
Frequently asked questions about Mablethorpe North
What is the average price for a property for sale in Mablethorpe North?
The average price for a property for sale in Mablethorpe North is £179,824. This amount is 11% lower than the average price in Mablethorpe. There are 1,077 property listings for sale in Mablethorpe North.
What streets have the most expensive properties for sale in Mablethorpe North?
The streets with the most expensive properties for sale in Mablethorpe North are Alford Road at an average of £342,000, Faldos Way at an average of £214,000 and Byron Road at an average of £203,500.
What streets have the most affordable properties for sale in Mablethorpe North?
The streets with the most affordable properties for sale in Mablethorpe North are Quebec Road at an average of £95,000, Regent Road at an average of £125,000 and Waterloo Road at an average of £131,333.
Which train stations are available in or near Mablethorpe North?
Some of the train stations available in or near Mablethorpe North are Skegness, Thorpe Culvert and Havenhouse.
Property Price Paid in Mablethorpe North by Year
The average sold property price by year was:
| Year | Average Sold Price | Price Change |
Sold Properties
|
|---|---|---|---|
| 2025 | £167,789 | -8% |
23 Properties |
| 2024 | £181,664 | -4% |
27 Properties |
| 2023 | £189,287 | 11% |
24 Properties |
| 2022 | £167,525 | 9% |
49 Properties |
| 2021 | £152,640 | 15% |
60 Properties |
| 2020 | £129,676 | 2% |
36 Properties |
| 2019 | £126,638 | -3% |
42 Properties |
| 2018 | £130,041 | 5% |
53 Properties |
| 2017 | £123,125 | 6% |
54 Properties |
| 2016 | £115,843 | 8% |
65 Properties |
| 2015 | £107,144 | 5% |
48 Properties |
| 2014 | £101,744 | 2% |
46 Properties |
| 2013 | £99,510 | 7% |
28 Properties |
| 2012 | £92,207 | -1% |
32 Properties |
| 2011 | £93,055 | -11% |
41 Properties |
| 2010 | £103,169 | 2% |
34 Properties |
| 2009 | £100,813 | -13% |
30 Properties |
| 2008 | £114,416 | -8% |
34 Properties |
| 2007 | £124,059 | 8% |
58 Properties |
| 2006 | £114,009 | 7% |
53 Properties |
| 2005 | £106,396 | 4% |
38 Properties |
| 2004 | £102,249 | 17% |
50 Properties |
| 2003 | £84,994 | 24% |
66 Properties |
| 2002 | £64,556 | 30% |
63 Properties |
| 2001 | £45,290 | 7% |
68 Properties |
| 2000 | £41,914 | 6% |
53 Properties |
| 1999 | £39,231 | 6% |
66 Properties |
| 1998 | £36,681 | 5% |
54 Properties |
| 1997 | £34,720 | -0,4% |
52 Properties |
| 1996 | £34,871 | -6% |
40 Properties |
| 1995 | £36,980 | - |
39 Properties |
Property Price per Property Type in Mablethorpe North
Here you can find historic sold price data in order to help with your property search.
The average Property Paid Price for specific property types in the last three years are:
| Property Type | Average Sold Price | Sold Properties |
|---|---|---|
| Semi Detached House | £175,640.00 | 52 Semi Detached Houses |
| Detached House | £207,816.00 | 18 Detached Houses |
| Terraced House | £136,500.00 | 2 Terraced Houses |
| Flat | £80,000.00 | 2 Flats |

