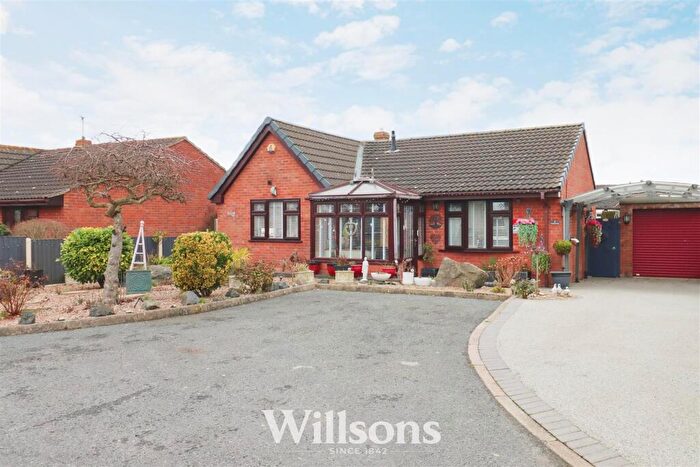
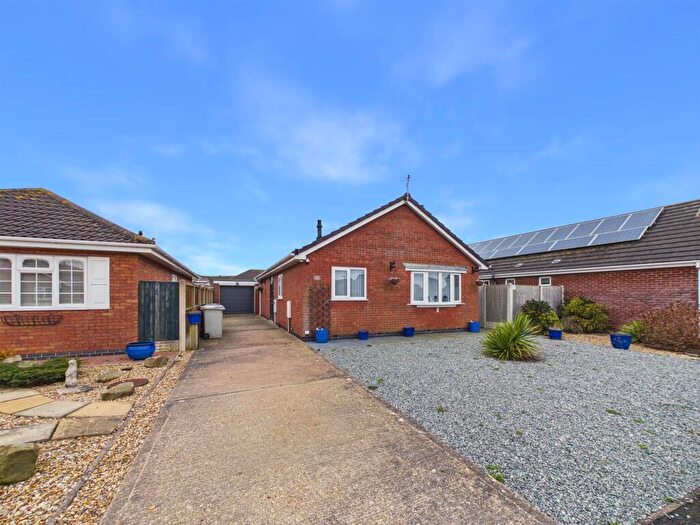
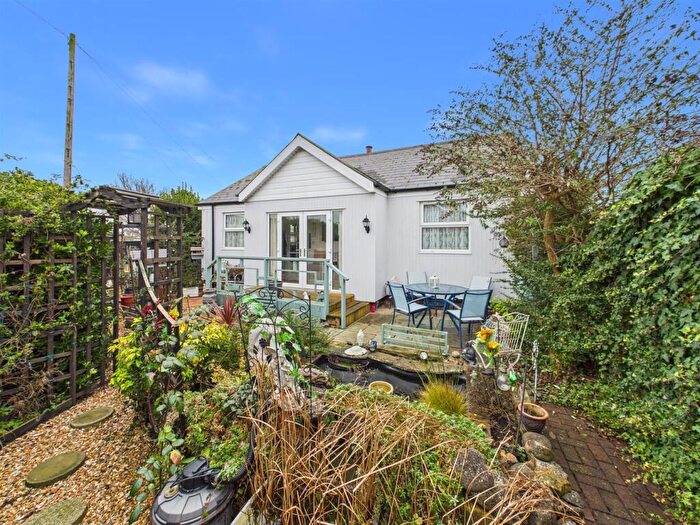
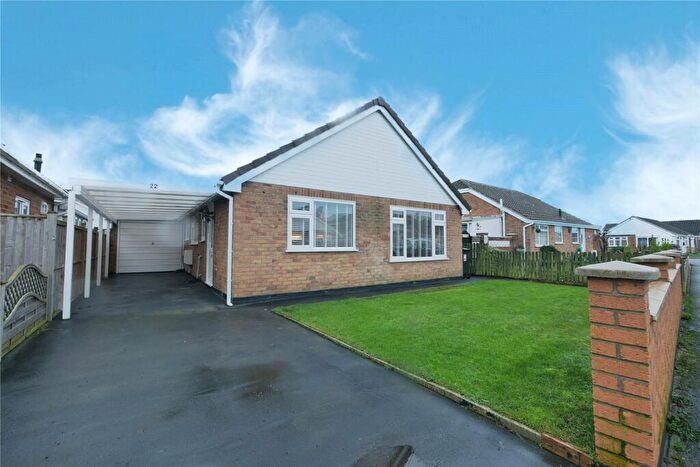
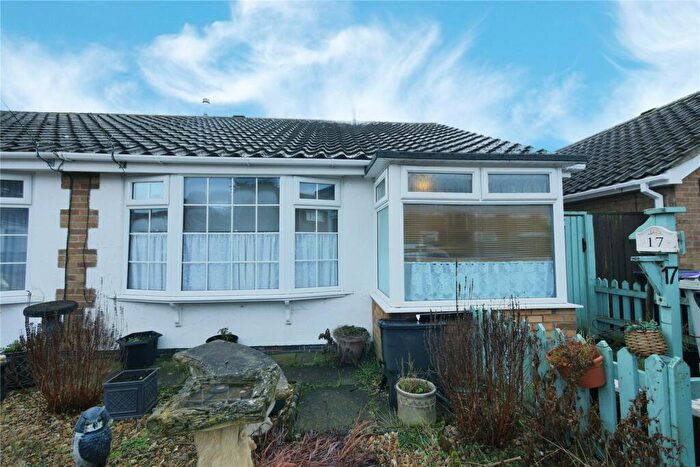
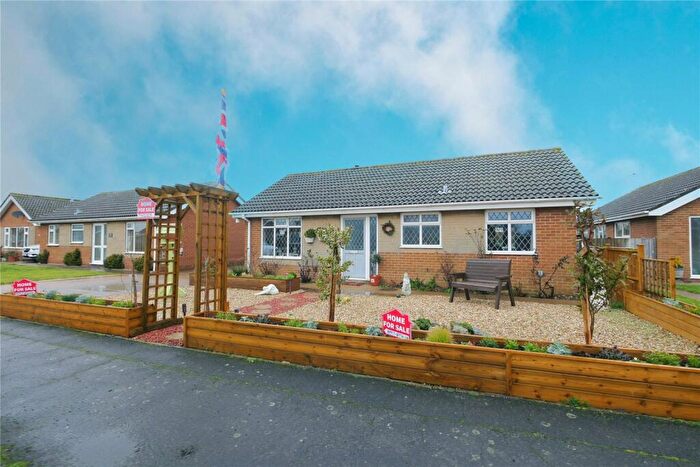
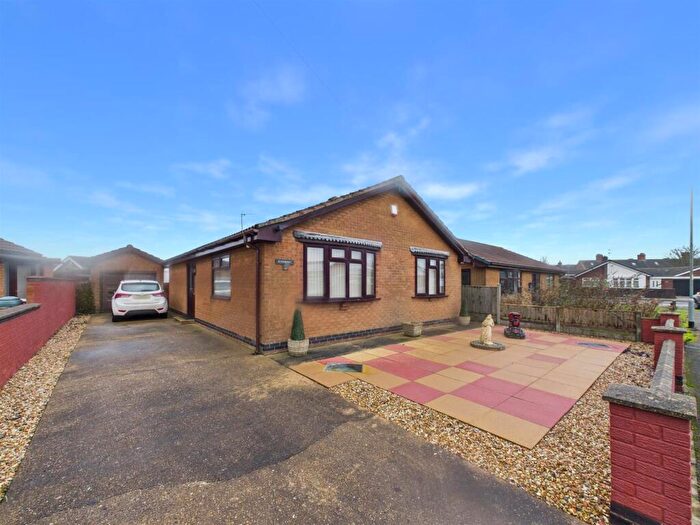
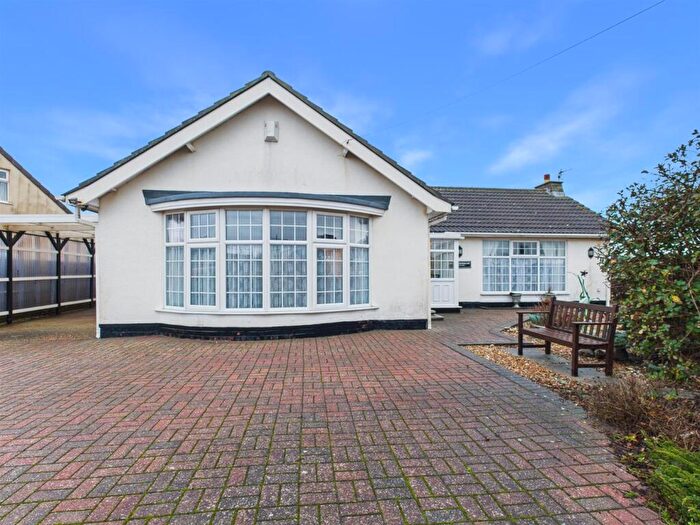
Houses for sale & to rent in Sutton On Sea North, Mablethorpe
House Prices in Sutton On Sea North
Properties in Sutton On Sea North have an average house price of £208,840.00 and had 105 Property Transactions within the last 3 years¹.
Sutton On Sea North is an area in Mablethorpe, Lincolnshire with 896 households², where the most expensive property was sold for £425,000.00.
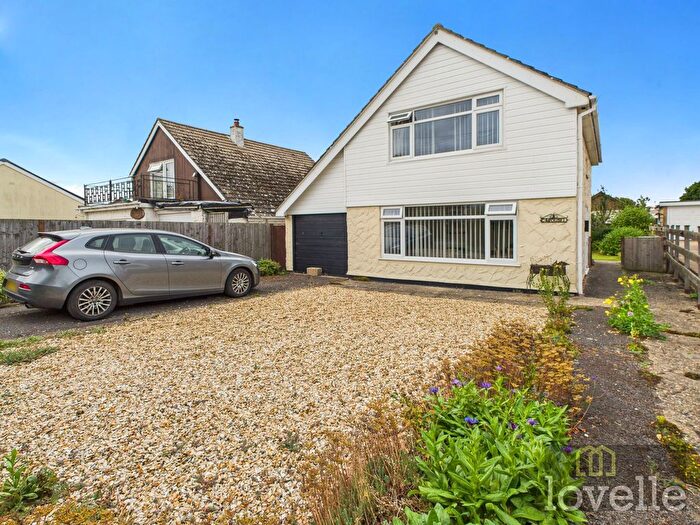
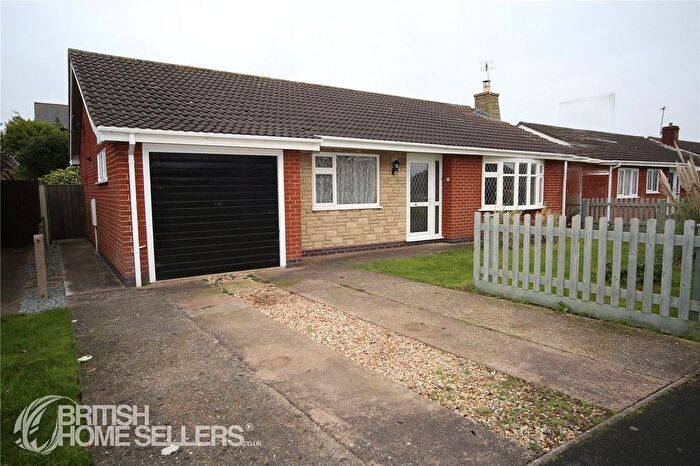
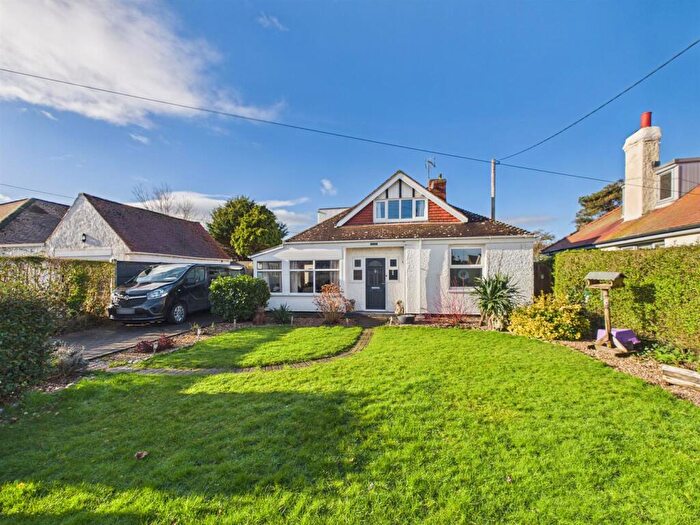
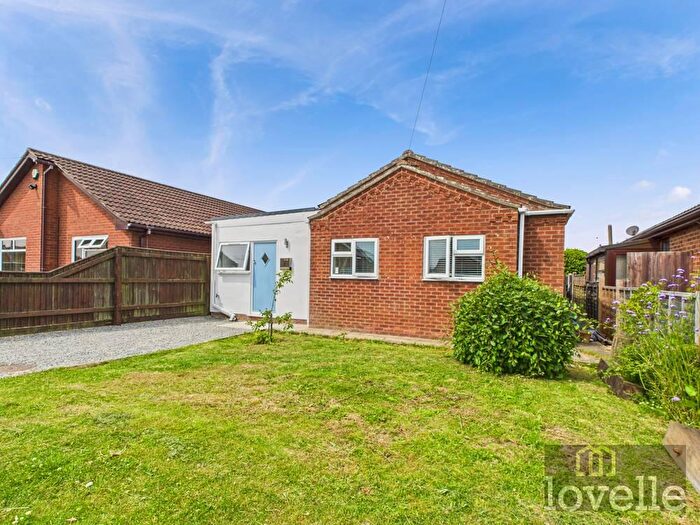
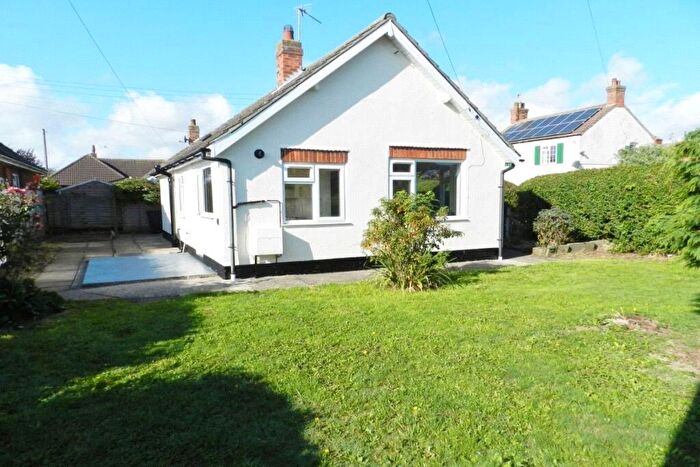
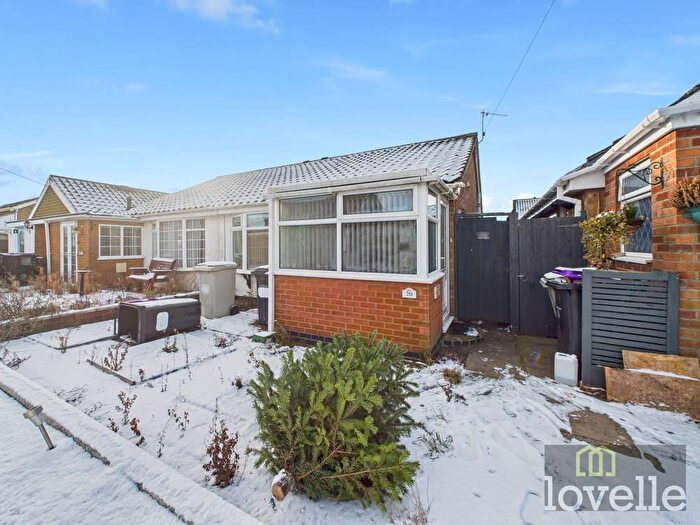
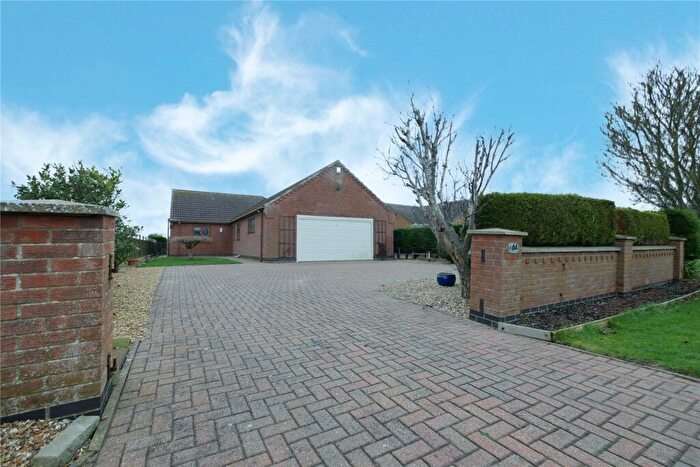
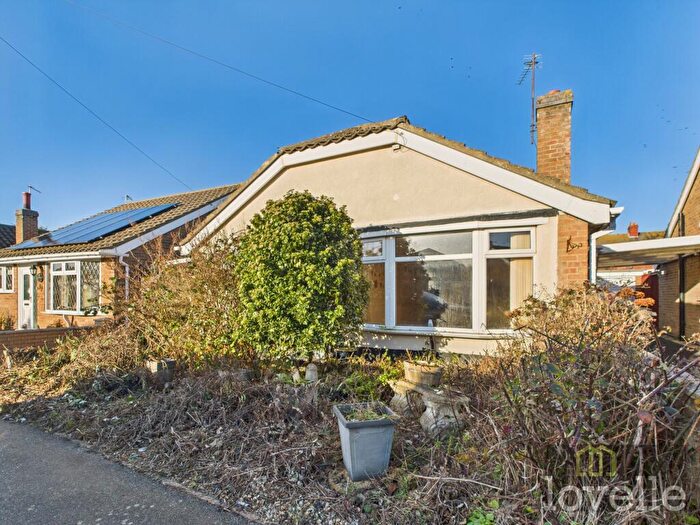
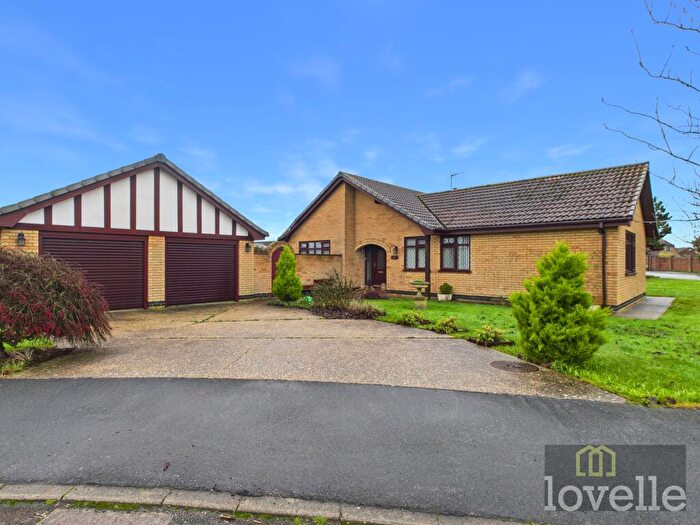
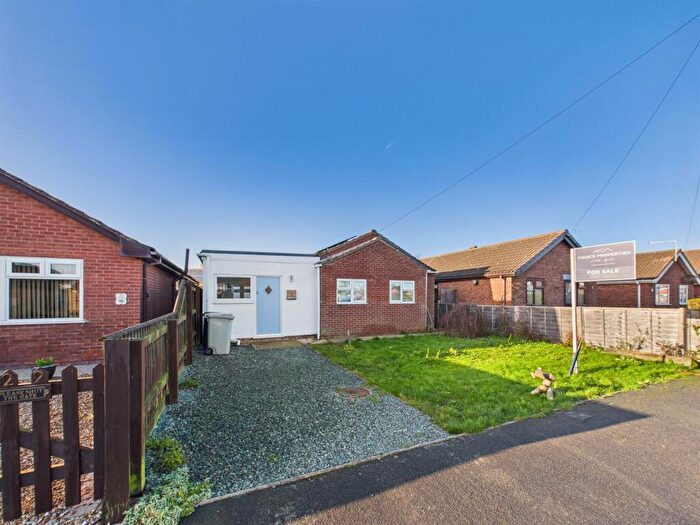
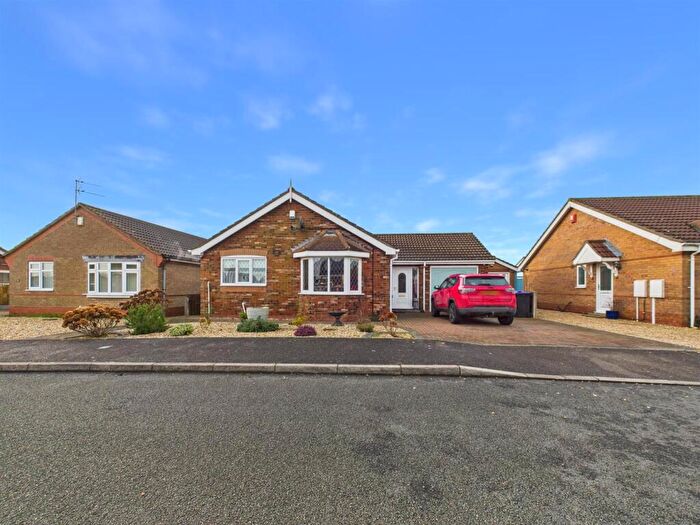
Properties for sale in Sutton On Sea North
Roads and Postcodes in Sutton On Sea North
Navigate through our locations to find the location of your next house in Sutton On Sea North, Mablethorpe for sale or to rent.
| Streets | Postcodes |
|---|---|
| Acorn Close | LN12 2GR |
| Alford Road | LN12 2GY LN12 2HF LN12 2HH LN12 2HQ LN12 2RL LN12 2RP LN12 2RW |
| Balmoral Close | LN12 2JT |
| Bohemia Way | LN12 2GF |
| Braemar Road | LN12 2TP |
| Brickyard Lane | LN12 2RN |
| Brittain Court | LN12 2SZ |
| Broadway | LN12 2JN |
| Buckingham Close | LN12 2SR |
| Bucknalls Meadow | LN12 2QU |
| Camelot Court | LN12 2SQ |
| Camelot Gardens | LN12 2HP |
| Cromer Avenue | LN12 2HA |
| Daniels Way | LN12 2GG LN12 2LN |
| Evergreen Walk | LN12 2SW |
| Farm Close | LN12 2SP |
| Furlongs Road | LN12 2JL |
| Grove Road | LN12 2LP LN12 2NH |
| Hanson Drive | LN12 2TU |
| Harding Close | LN12 2NB |
| High Street | LN12 2EX LN12 2EY LN12 2HE |
| Highfield Avenue | LN12 2NS |
| Highgate Close | LN12 2NR |
| Hodgson Way | LN12 2SG |
| Honeysuckle Close | LN12 2ST |
| Huttoft Road | LN12 2HX |
| Marine Avenue | LN12 2ND LN12 2TY |
| Marine Avenue West | LN12 2TX |
| Moreland Avenue | LN12 2HL |
| Morrison Close | LN12 2LU |
| Oundle Road | LN12 2NW |
| Painters Way | LN12 2GT |
| Park Road | LN12 2LW LN12 2NJ |
| Park Road East | LN12 2NL |
| Park Road West | LN12 2NQ |
| Park View | LN12 2NT |
| Sandringham Drive | LN12 2JP |
| South Road | LN12 2NE |
| Station Road | LN12 2HJ LN12 2HN LN12 2HR LN12 2HS LN12 2HW |
| Tramway Drive | LN12 2GS |
| Trusthorpe Road | LN12 2LR LN12 2LT LN12 2LX LN12 2LY |
| Uppingham Road | LN12 2NN |
| Victoria Road | LN12 2HG |
| William Green Close | LN12 2TZ |
| William Tow Close | LN12 2TT |
| Willoughby Road | LN12 2LZ LN12 2NF |
| York Road | LN12 2EU |
Transport near Sutton On Sea North
- FAQ
- Price Paid By Year
- Property Type Price
Frequently asked questions about Sutton On Sea North
What is the average price for a property for sale in Sutton On Sea North?
The average price for a property for sale in Sutton On Sea North is £208,840. This amount is 4% higher than the average price in Mablethorpe. There are 565 property listings for sale in Sutton On Sea North.
What streets have the most expensive properties for sale in Sutton On Sea North?
The streets with the most expensive properties for sale in Sutton On Sea North are Park Road East at an average of £299,000, Park View at an average of £292,737 and Park Road at an average of £284,833.
What streets have the most affordable properties for sale in Sutton On Sea North?
The streets with the most affordable properties for sale in Sutton On Sea North are Camelot Court at an average of £95,000, Victoria Road at an average of £116,333 and Brittain Court at an average of £119,999.
Which train stations are available in or near Sutton On Sea North?
Some of the train stations available in or near Sutton On Sea North are Skegness, Thorpe Culvert and Havenhouse.
Property Price Paid in Sutton On Sea North by Year
The average sold property price by year was:
| Year | Average Sold Price | Price Change |
Sold Properties
|
|---|---|---|---|
| 2025 | £225,447 | 17% |
35 Properties |
| 2024 | £186,120 | -17% |
39 Properties |
| 2023 | £218,674 | 6% |
31 Properties |
| 2022 | £205,867 | 4% |
39 Properties |
| 2021 | £198,194 | 3% |
80 Properties |
| 2020 | £192,016 | 7% |
51 Properties |
| 2019 | £178,395 | 14% |
42 Properties |
| 2018 | £154,120 | -3% |
50 Properties |
| 2017 | £158,720 | 8% |
60 Properties |
| 2016 | £146,378 | 9% |
66 Properties |
| 2015 | £133,777 | 6% |
43 Properties |
| 2014 | £125,656 | 3% |
58 Properties |
| 2013 | £122,265 | -3% |
51 Properties |
| 2012 | £125,896 | 4% |
53 Properties |
| 2011 | £120,326 | 2% |
38 Properties |
| 2010 | £118,434 | -6% |
38 Properties |
| 2009 | £125,175 | -11% |
50 Properties |
| 2008 | £139,258 | 2% |
31 Properties |
| 2007 | £136,459 | 1% |
85 Properties |
| 2006 | £135,591 | 3% |
72 Properties |
| 2005 | £132,006 | 15% |
50 Properties |
| 2004 | £112,197 | 9% |
82 Properties |
| 2003 | £101,744 | 26% |
66 Properties |
| 2002 | £75,077 | 23% |
98 Properties |
| 2001 | £57,726 | -3% |
80 Properties |
| 2000 | £59,355 | 10% |
61 Properties |
| 1999 | £53,487 | 23% |
71 Properties |
| 1998 | £41,322 | -10% |
47 Properties |
| 1997 | £45,335 | 2% |
71 Properties |
| 1996 | £44,595 | 5% |
55 Properties |
| 1995 | £42,336 | - |
53 Properties |
Property Price per Property Type in Sutton On Sea North
Here you can find historic sold price data in order to help with your property search.
The average Property Paid Price for specific property types in the last three years are:
| Property Type | Average Sold Price | Sold Properties |
|---|---|---|
| Semi Detached House | £169,386.00 | 29 Semi Detached Houses |
| Detached House | £248,327.00 | 60 Detached Houses |
| Terraced House | £139,354.00 | 11 Terraced Houses |
| Flat | £116,700.00 | 5 Flats |

