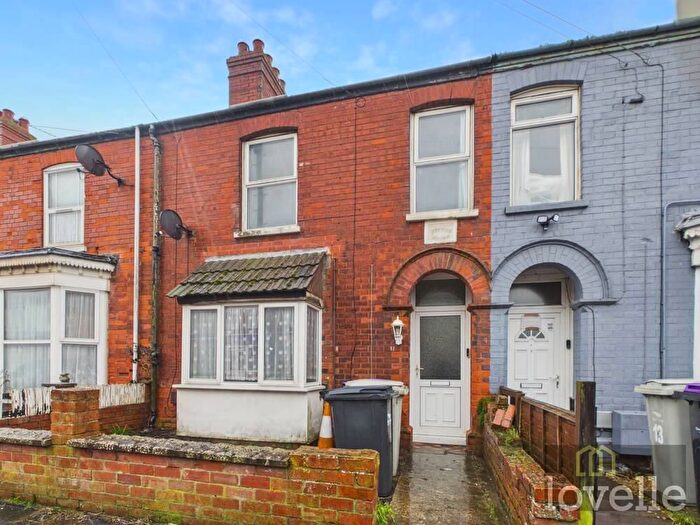
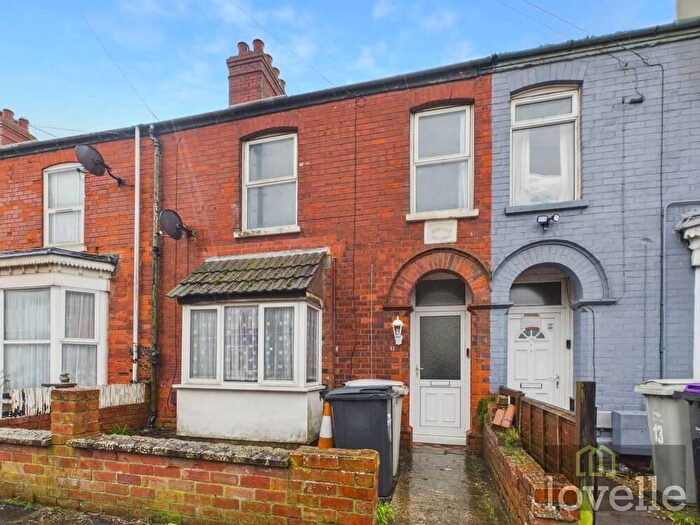
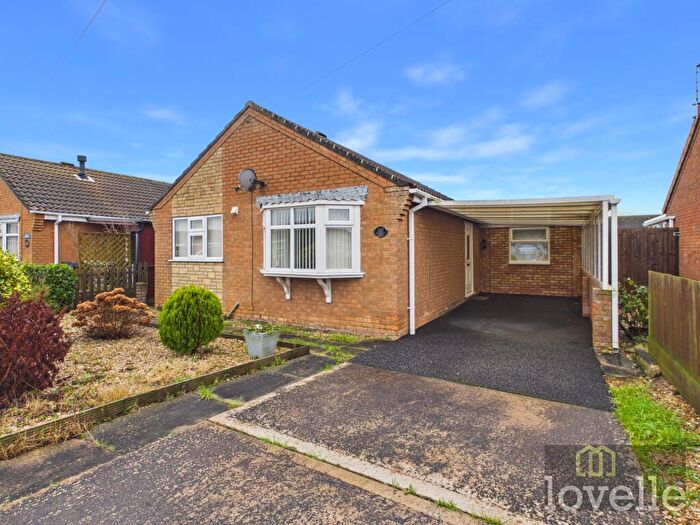
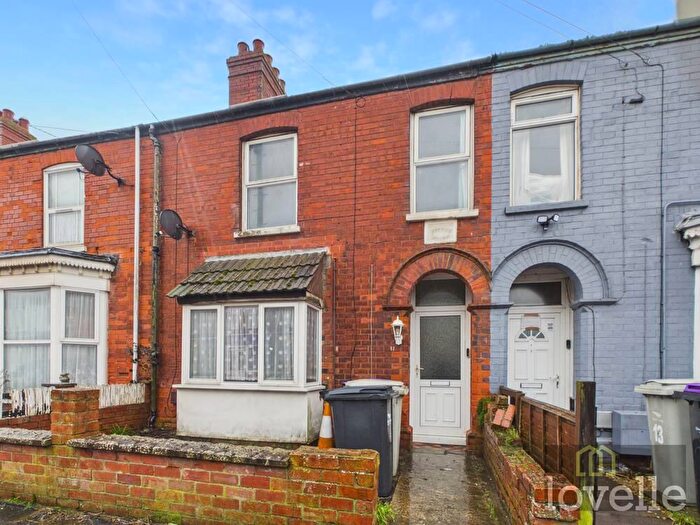
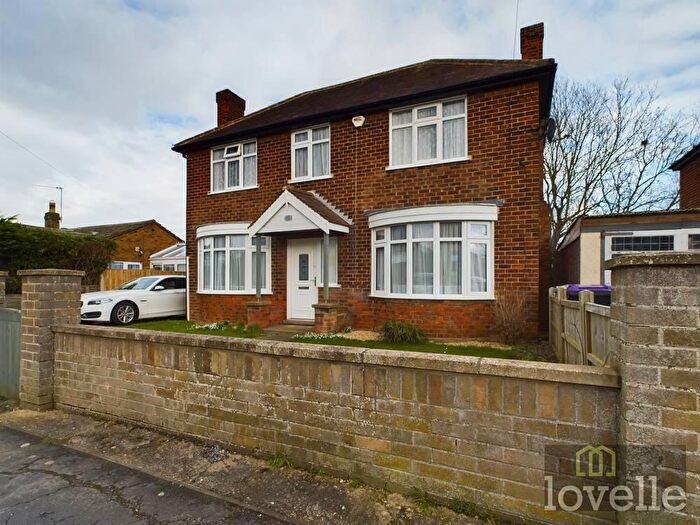
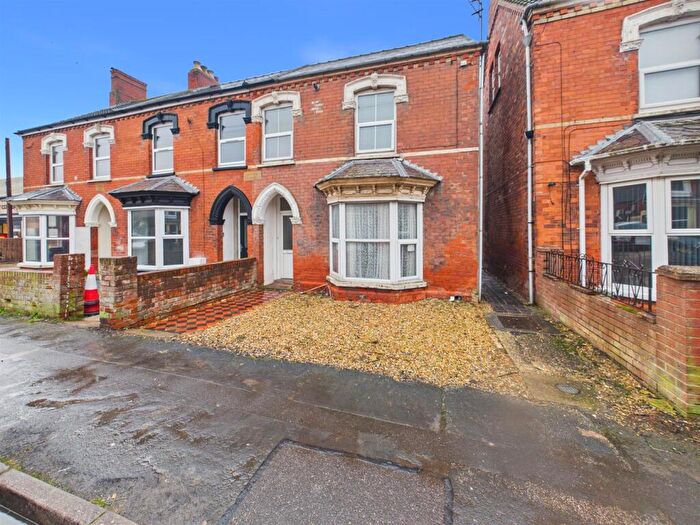
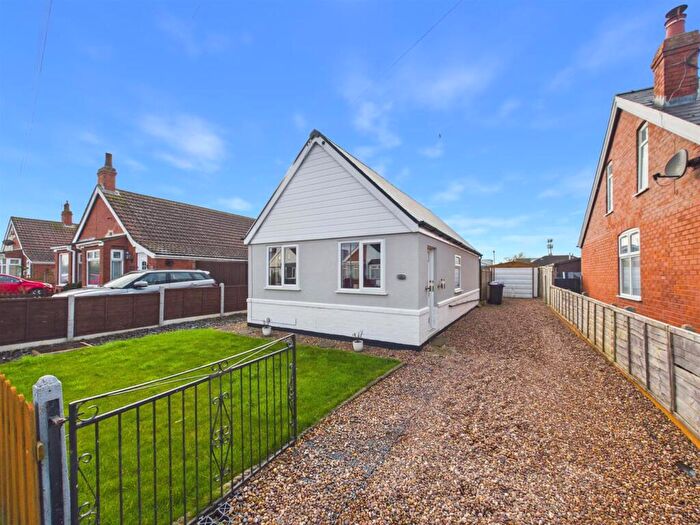
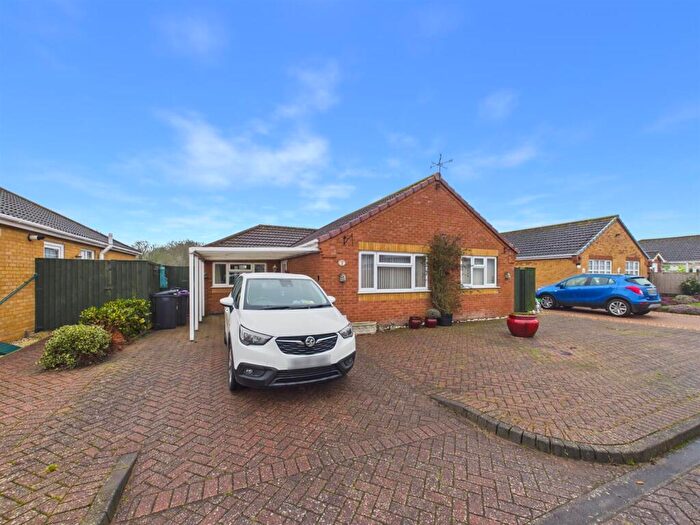
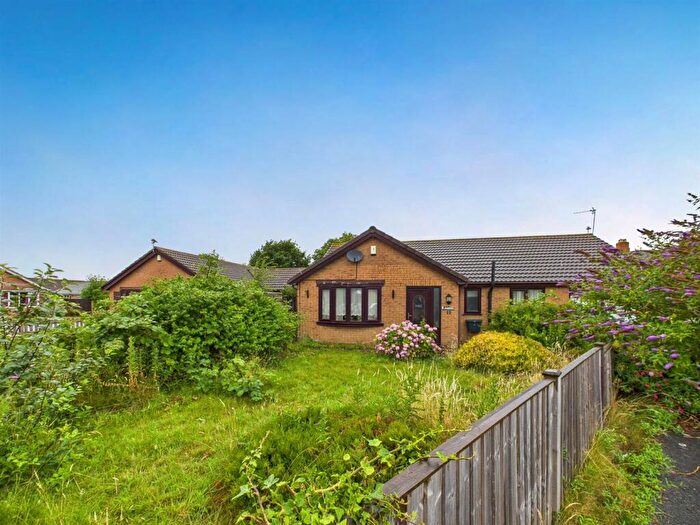
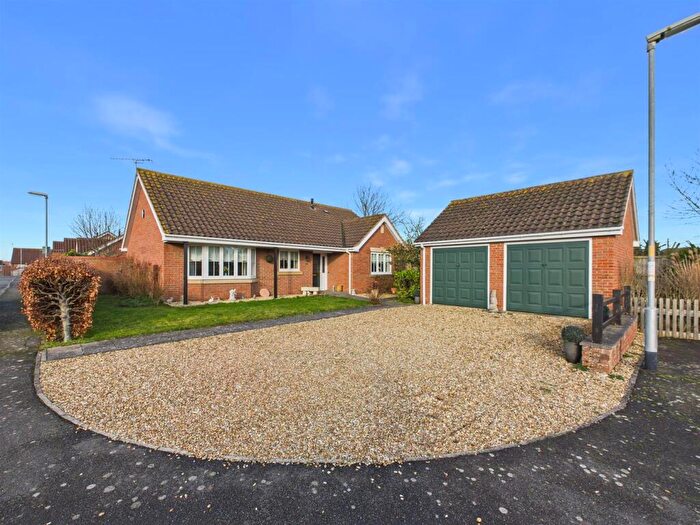
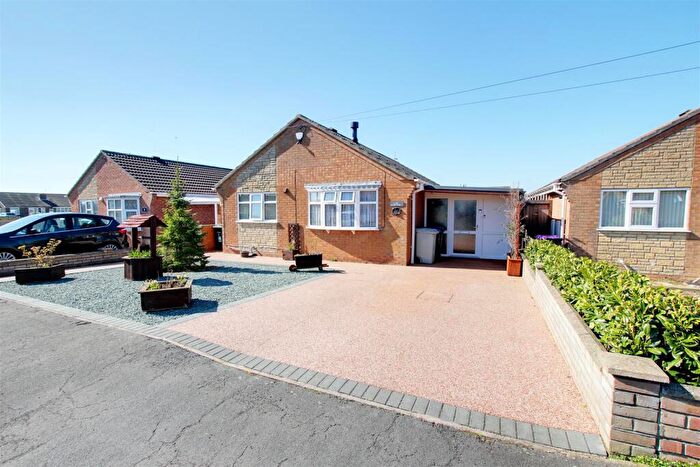
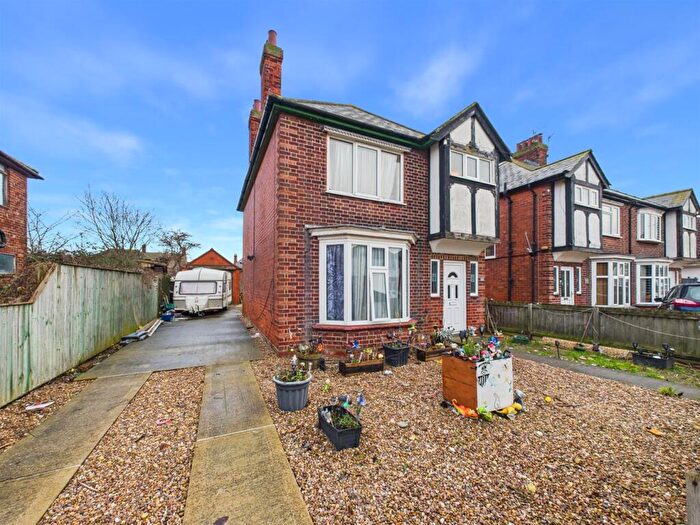
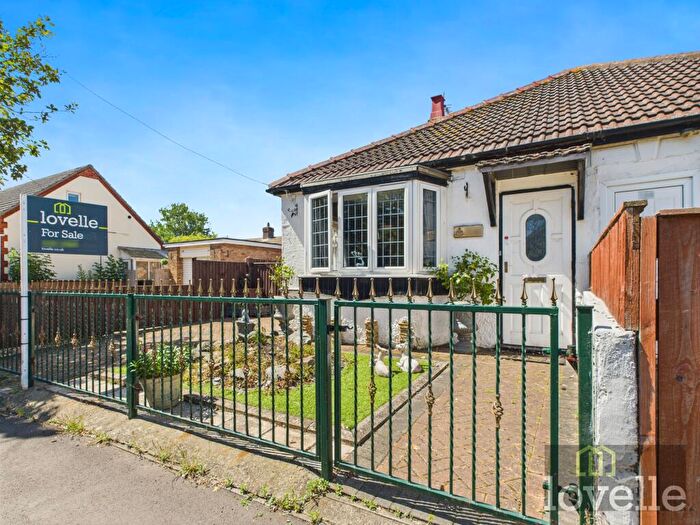
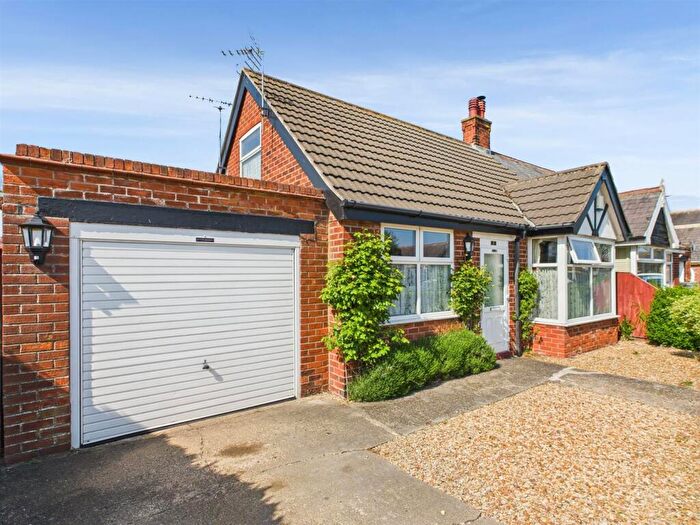
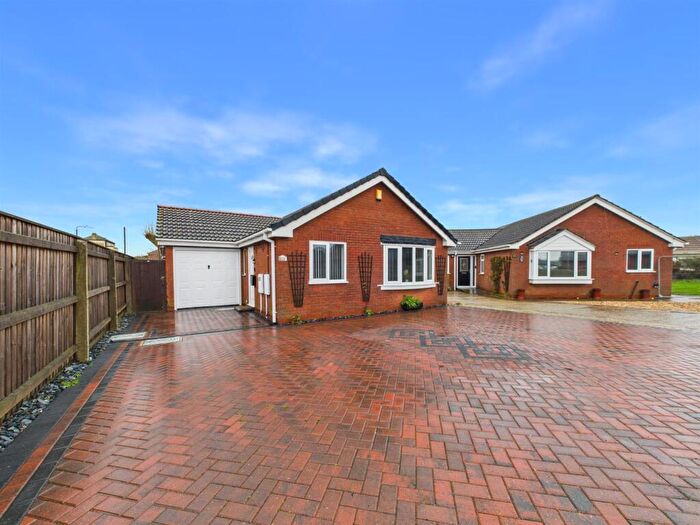
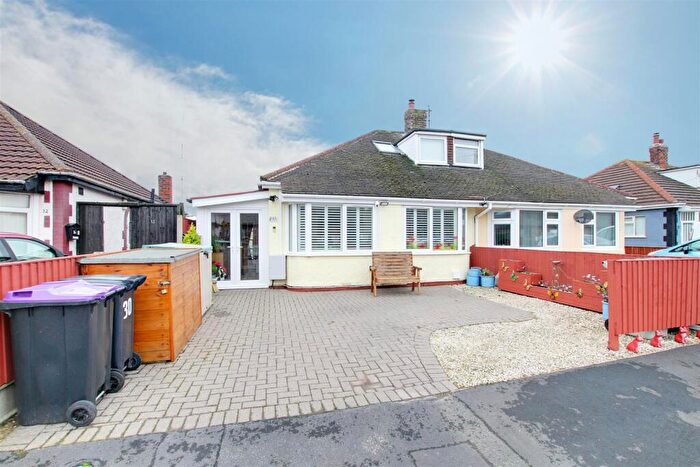
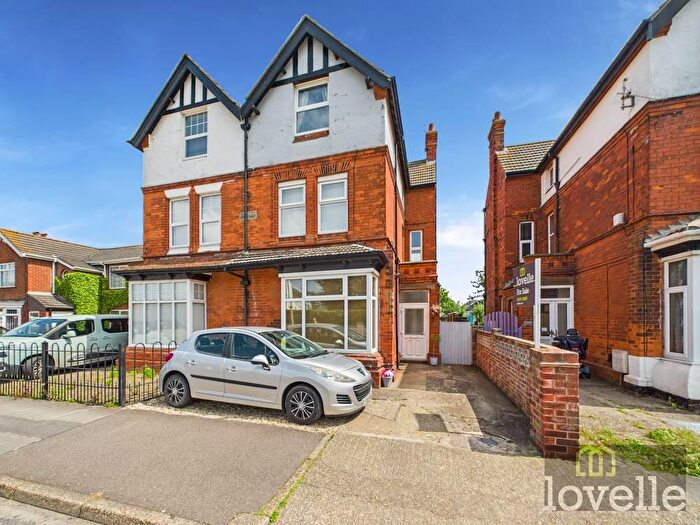
Houses for sale & to rent in Mablethorpe East, Mablethorpe
House Prices in Mablethorpe East
Properties in Mablethorpe East have an average house price of £165,713.00 and had 81 Property Transactions within the last 3 years¹.
Mablethorpe East is an area in Mablethorpe, Lincolnshire with 776 households², where the most expensive property was sold for £315,000.00.
Properties for sale in Mablethorpe East
Roads and Postcodes in Mablethorpe East
Navigate through our locations to find the location of your next house in Mablethorpe East, Mablethorpe for sale or to rent.
| Streets | Postcodes |
|---|---|
| Admiralty Road | LN12 2AA LN12 2AB |
| Ancaster Road | LN12 2DH |
| Elm Avenue | LN12 2DP |
| Fitzwilliam Street | LN12 1AA LN12 1AB |
| Foxe End | LN12 2DS |
| George Street | LN12 2BD LN12 2BE LN12 2BH LN12 2BJ LN12 2BL LN12 2BP LN12 2BT |
| Gibraltar Road | LN12 2AT |
| Grosvenor Court | LN12 1BX |
| Harris Boulevard | LN12 2DY |
| High Street | LN12 1AD LN12 1AX LN12 1BH |
| Kensington Gardens | LN12 1BU |
| Knowle Street | LN12 2BG |
| Marina Road | LN12 2BN LN12 2BW |
| Maxwell Drive | LN12 1BS |
| Park Avenue | LN12 2AE |
| Parry Road | LN12 2BB |
| Ripon Place | LN12 2DL |
| Seacroft Road | LN12 2DG LN12 2DJ LN12 2DN LN12 2DQ LN12 2DR LN12 2DT LN12 2DU LN12 2EH |
| Seaholme Road | LN12 2DE LN12 2DX LN12 2EB |
| Somersby Avenue | LN12 1HH LN12 1HN |
| Stanley Avenue | LN12 1DP |
| Strand Close | LN12 1BE |
| Tennyson Road | LN12 1HE |
| The Boulevard | LN12 2AD |
| The Strand | LN12 1BQ |
| Victoria Road | LN12 2AF LN12 2AJ LN12 2AL LN12 2AQ |
| Vyner Close | LN12 2DW |
Transport near Mablethorpe East
- FAQ
- Price Paid By Year
- Property Type Price
Frequently asked questions about Mablethorpe East
What is the average price for a property for sale in Mablethorpe East?
The average price for a property for sale in Mablethorpe East is £165,713. This amount is 18% lower than the average price in Mablethorpe. There are 864 property listings for sale in Mablethorpe East.
What streets have the most expensive properties for sale in Mablethorpe East?
The streets with the most expensive properties for sale in Mablethorpe East are The Boulevard at an average of £300,000, Harris Boulevard at an average of £236,000 and Park Avenue at an average of £233,750.
What streets have the most affordable properties for sale in Mablethorpe East?
The streets with the most affordable properties for sale in Mablethorpe East are Gibraltar Road at an average of £45,000, Strand Close at an average of £95,000 and Tennyson Road at an average of £115,333.
Which train stations are available in or near Mablethorpe East?
Some of the train stations available in or near Mablethorpe East are Skegness, Thorpe Culvert and Havenhouse.
Property Price Paid in Mablethorpe East by Year
The average sold property price by year was:
| Year | Average Sold Price | Price Change |
Sold Properties
|
|---|---|---|---|
| 2025 | £164,747 | 0,2% |
22 Properties |
| 2024 | £164,392 | -2% |
28 Properties |
| 2023 | £167,590 | -6% |
31 Properties |
| 2022 | £176,987 | 5% |
46 Properties |
| 2021 | £168,712 | 21% |
54 Properties |
| 2020 | £132,728 | 6% |
26 Properties |
| 2019 | £124,206 | -4% |
48 Properties |
| 2018 | £128,981 | 6% |
27 Properties |
| 2017 | £121,217 | 7% |
49 Properties |
| 2016 | £112,995 | 12% |
43 Properties |
| 2015 | £99,229 | 5% |
46 Properties |
| 2014 | £93,875 | 1% |
33 Properties |
| 2013 | £93,039 | -6% |
37 Properties |
| 2012 | £98,628 | 11% |
21 Properties |
| 2011 | £87,747 | -36% |
18 Properties |
| 2010 | £119,588 | 9% |
22 Properties |
| 2009 | £108,823 | -13% |
17 Properties |
| 2008 | £123,018 | -3% |
22 Properties |
| 2007 | £126,492 | 14% |
49 Properties |
| 2006 | £108,786 | -7% |
49 Properties |
| 2005 | £115,907 | 11% |
34 Properties |
| 2004 | £103,323 | 12% |
44 Properties |
| 2003 | £90,827 | 29% |
71 Properties |
| 2002 | £64,439 | 17% |
64 Properties |
| 2001 | £53,174 | 1% |
59 Properties |
| 2000 | £52,580 | 18% |
55 Properties |
| 1999 | £42,934 | 4% |
48 Properties |
| 1998 | £41,275 | 10% |
56 Properties |
| 1997 | £37,246 | 7% |
49 Properties |
| 1996 | £34,783 | 4% |
50 Properties |
| 1995 | £33,473 | - |
32 Properties |
Property Price per Property Type in Mablethorpe East
Here you can find historic sold price data in order to help with your property search.
The average Property Paid Price for specific property types in the last three years are:
| Property Type | Average Sold Price | Sold Properties |
|---|---|---|
| Semi Detached House | £175,666.00 | 36 Semi Detached Houses |
| Detached House | £189,307.00 | 26 Detached Houses |
| Terraced House | £138,076.00 | 13 Terraced Houses |
| Flat | £63,627.00 | 6 Flats |

