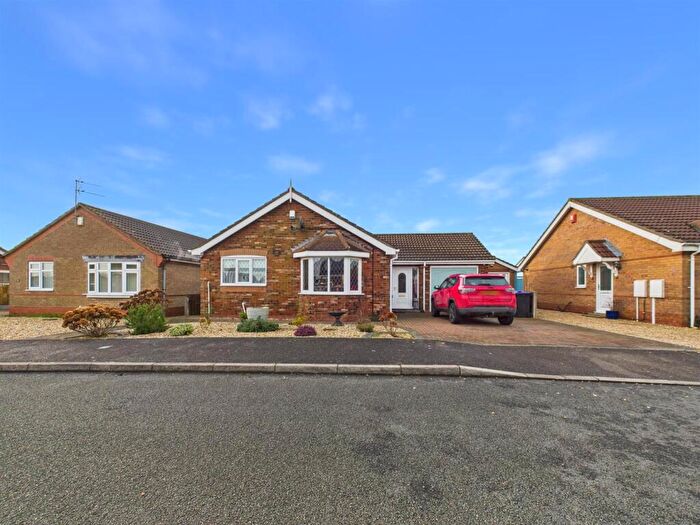
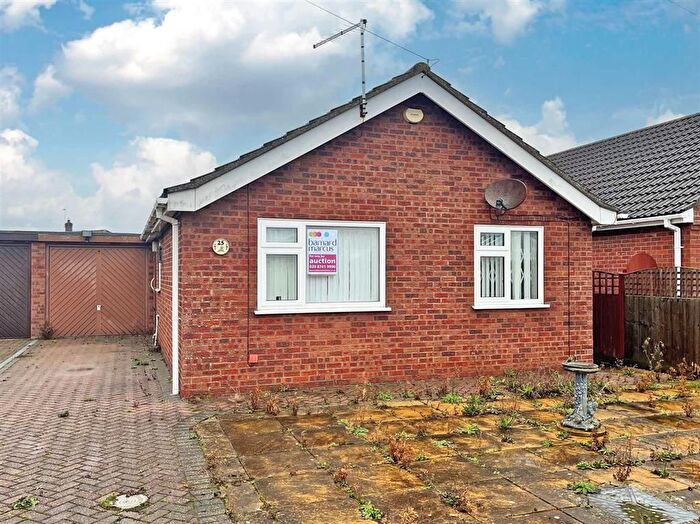
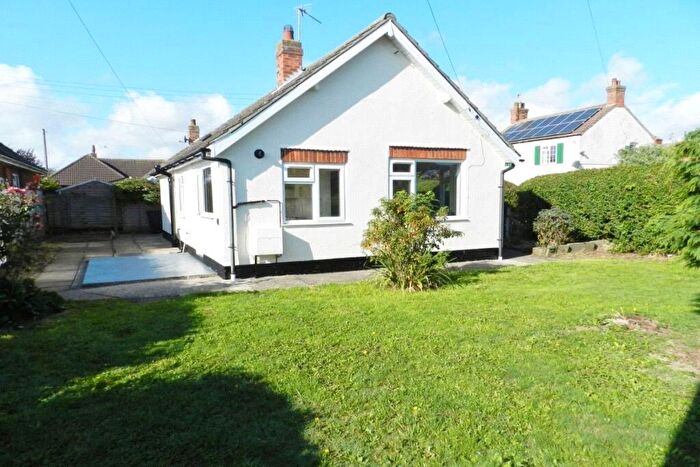
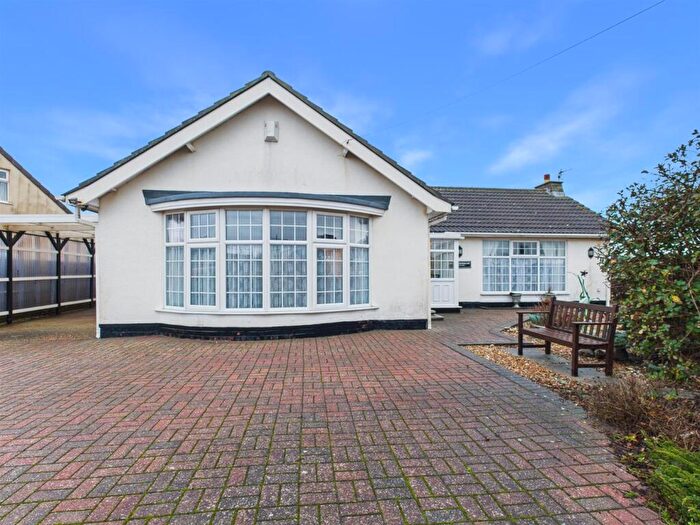
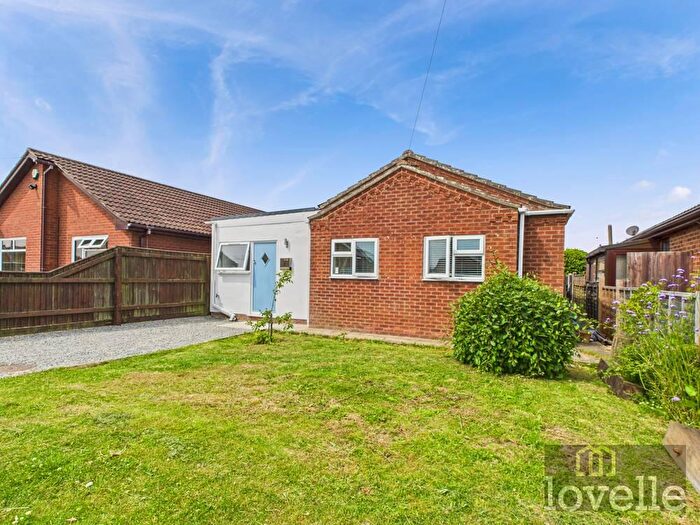
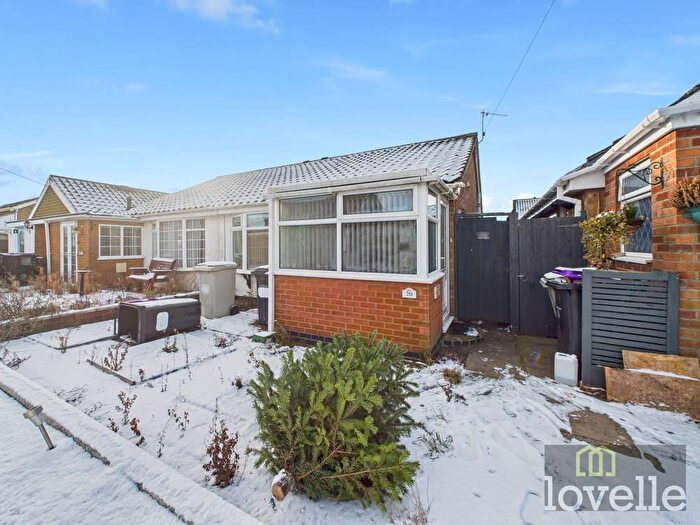
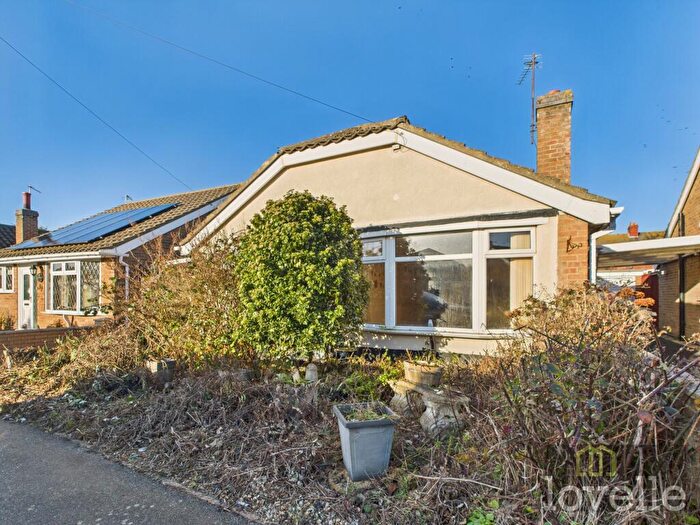
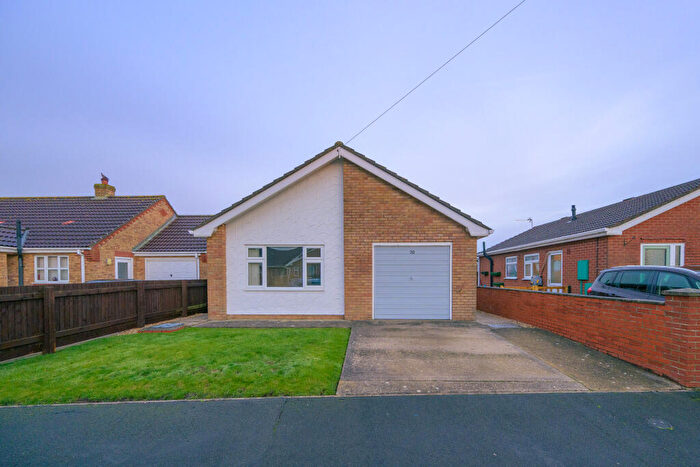
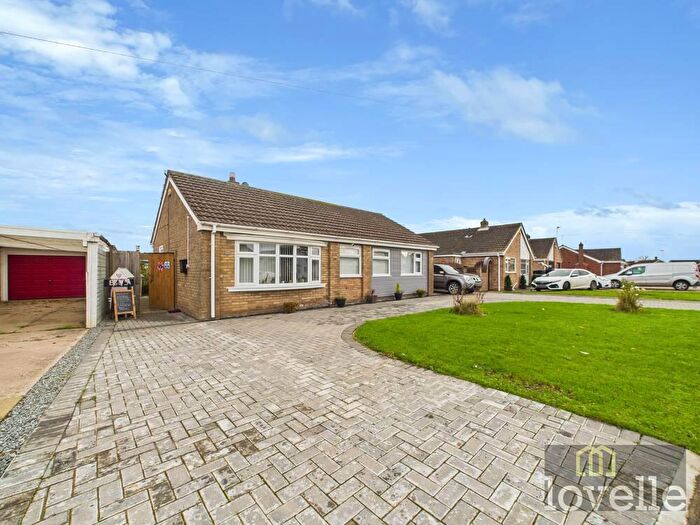
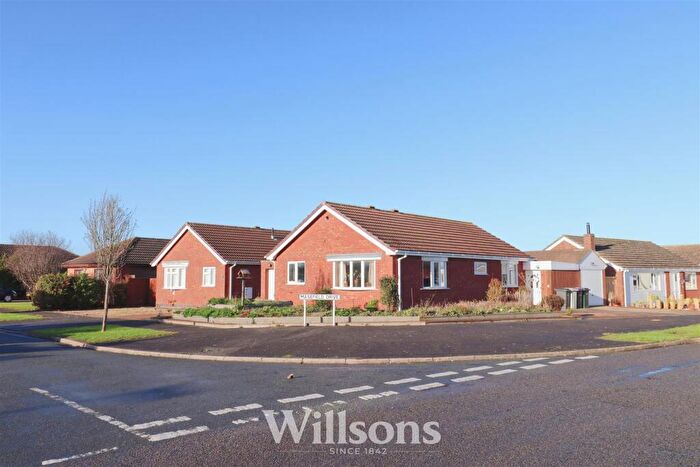
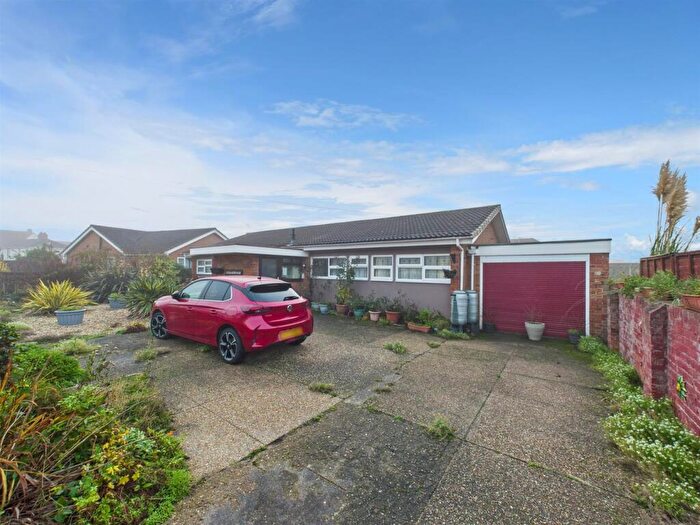
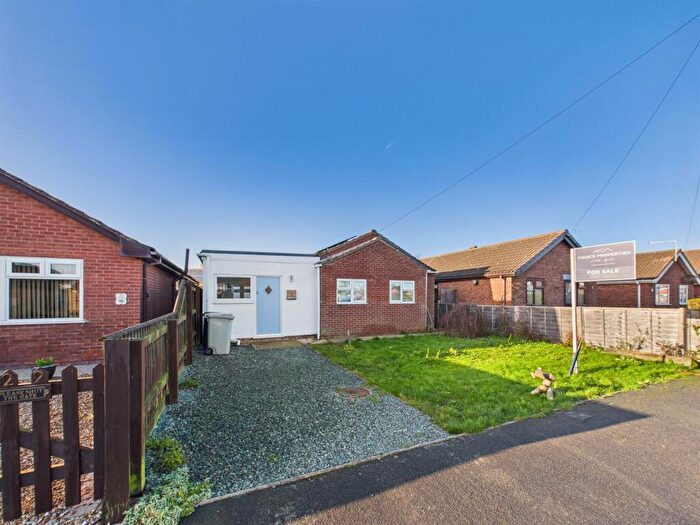
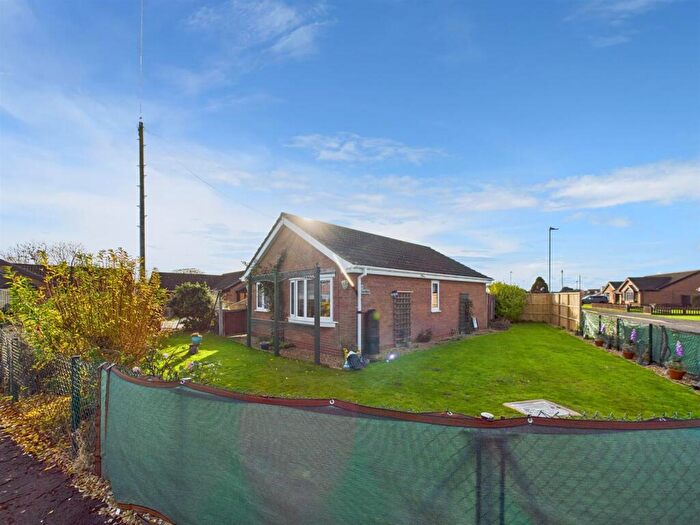
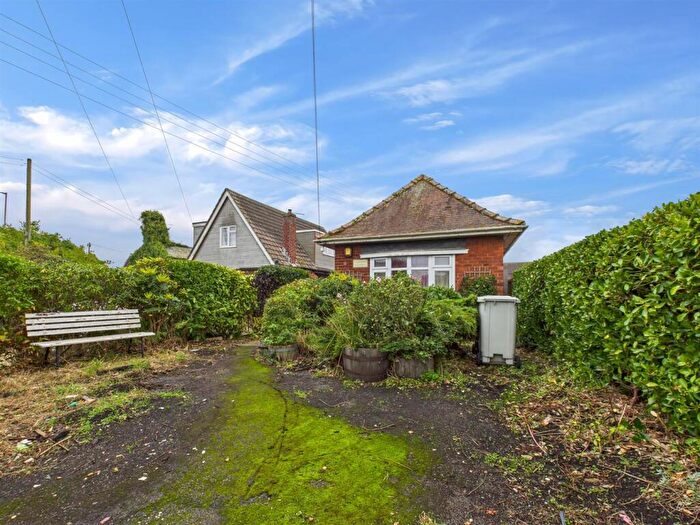
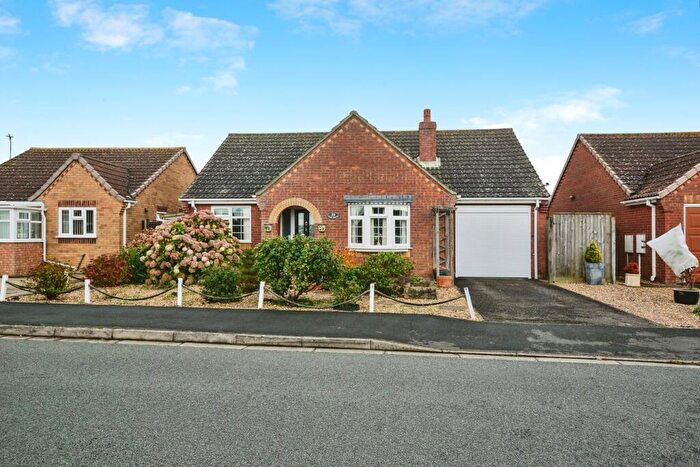
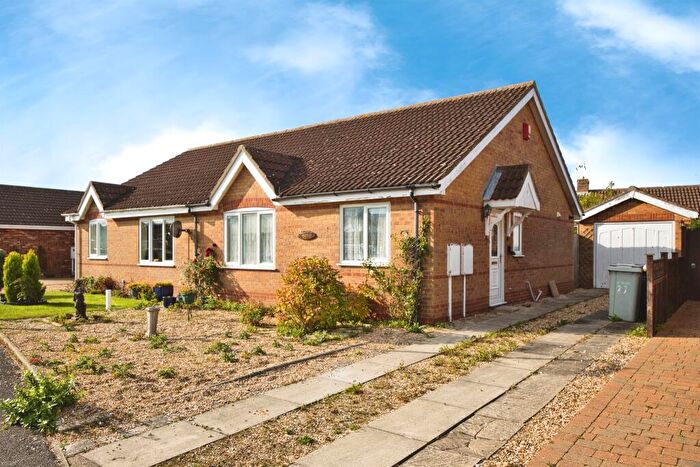
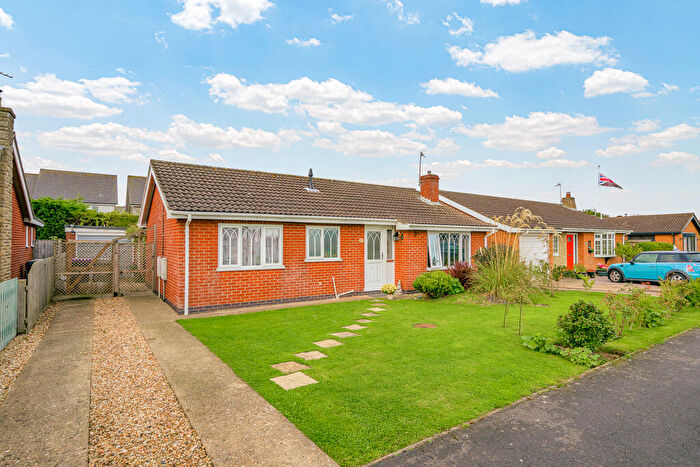
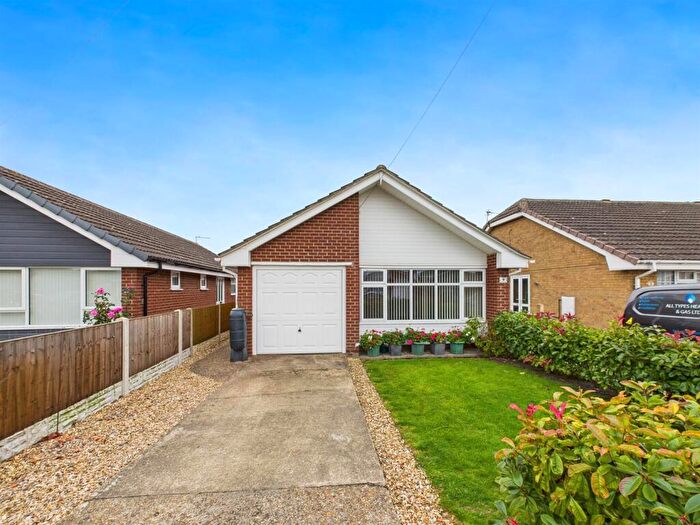
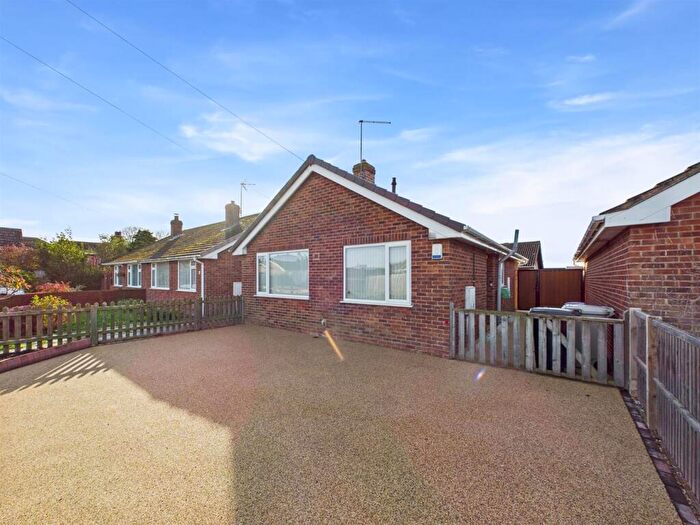
Houses for sale & to rent in Sutton On Sea South, Mablethorpe
House Prices in Sutton On Sea South
Properties in Sutton On Sea South have an average house price of £261,706.00 and had 188 Property Transactions within the last 3 years¹.
Sutton On Sea South is an area in Mablethorpe, Lincolnshire with 1,049 households², where the most expensive property was sold for £460,000.00.
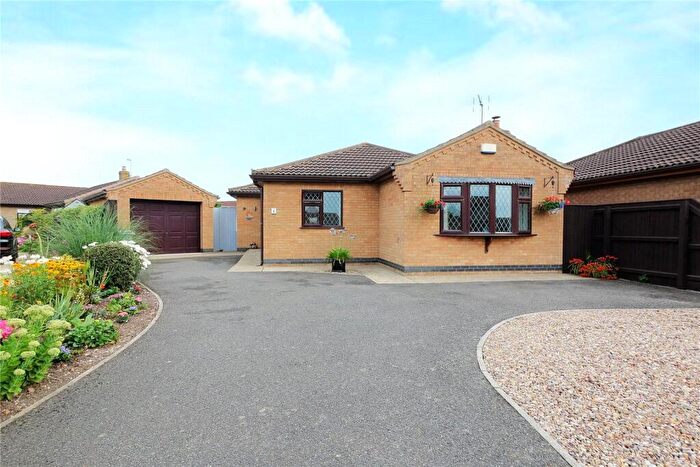
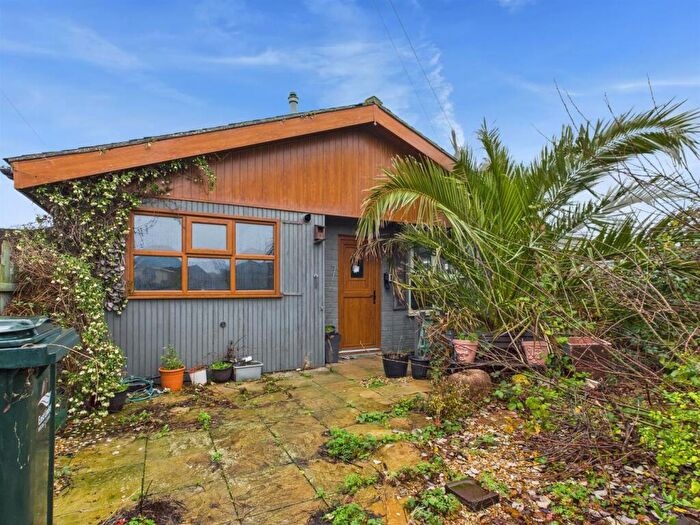
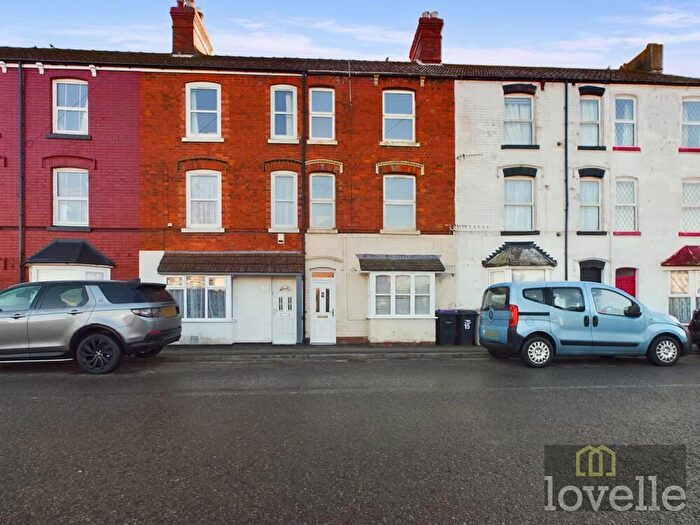
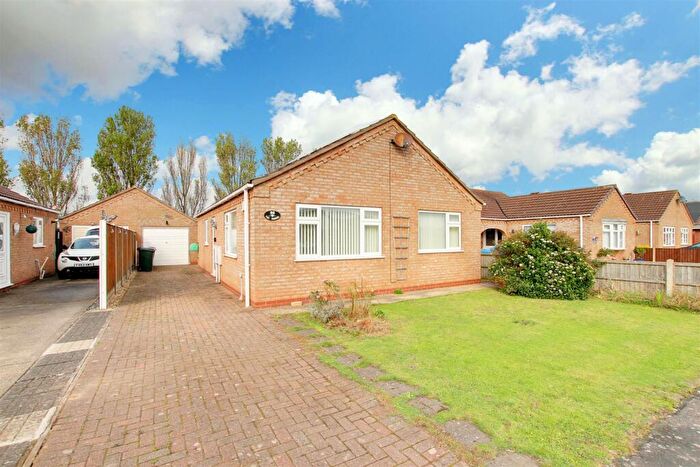
Properties for sale in Sutton On Sea South
Roads and Postcodes in Sutton On Sea South
Navigate through our locations to find the location of your next house in Sutton On Sea South, Mablethorpe for sale or to rent.
| Streets | Postcodes |
|---|---|
| Beachside | LN12 2JG |
| Bluestone Way | LN12 2UU |
| Cawkwell Close | LN12 2UT |
| Chanctonbury Close | LN12 2JW |
| Chanctonbury Way | LN12 2JR |
| Church Close | LN12 2TE |
| Church Lane | LN12 2JA LN12 2JB |
| Church Park | LN12 2SU |
| Cissbury Close | LN12 2SH |
| College Row | LN12 2NA |
| Comper Swift Close | LN12 2FE |
| Crabtree Lane | LN12 2RS LN12 2RT |
| De La Bere Avenue | LN12 2HY |
| Dennor Close | LN12 2JE |
| Dorset Court | LN12 2TQ |
| Drakes Close | LN12 2UE |
| Edwalton Avenue | LN12 2SS |
| Furlongs Road | LN12 2JF |
| Grange Road | LN12 2RE |
| Henshaw Avenue | LN12 2FB |
| Hillside Avenue | LN12 2JH |
| Hornby Drive | LN12 2UF |
| Hotchin Road | LN12 2NP |
| Huttoft Road | LN12 2QY LN12 2QZ LN12 2RU |
| Ings Lane | LN12 2RR |
| Jordan Grove | LN12 2FJ |
| Keats Close | LN12 2UA |
| Kipling Drive | LN12 2RF LN12 2SA |
| Lansdowne Close | LN12 2SN |
| Lansdowne Drive | LN12 2JD |
| Leopard Moth Close | LN12 2FF |
| Lewis Avenue | LN12 2JS |
| Martins Walk | LN12 2TN |
| Masefield Drive | LN12 2SF |
| Masons Close | LN12 2SE |
| Mew Gull Drive | LN12 2FD |
| Miles Hawk Close | LN12 2FG |
| Queens Road | LN12 2HT |
| Roman Bank | LN12 2RJ |
| Rossall Close | LN12 2SD |
| Rudyard Close | LN12 2RG |
| Sanders Close | LN12 2UH |
| Sandhurst Road | LN12 2RH |
| Sandilands Close | LN12 2SB |
| Sea Lane | LN12 2RA LN12 2RD LN12 2RQ |
| Sharmans Close | LN12 2TA |
| Shelley Close | LN12 2HD |
| St Francis Gardens | LN12 2QX |
| St Francis Walk | LN12 2TH |
| Station Road | LN12 2HU |
| Surfside | LN12 2JQ |
| Tennyson Close | LN12 2TL |
| The Copse | LN12 2UB |
| The Crescent | LN12 2RB |
| The Glade | LN12 2RZ |
| The Sidings | LN12 2SJ |
| Walkington Way | LN12 2UD |
| Wilmington Drive | LN12 2JU |
| Wilyman Close | LN12 2UG |
| Youlgrave Avenue | LN12 2JJ |
Transport near Sutton On Sea South
- FAQ
- Price Paid By Year
- Property Type Price
Frequently asked questions about Sutton On Sea South
What is the average price for a property for sale in Sutton On Sea South?
The average price for a property for sale in Sutton On Sea South is £261,706. This amount is 28% higher than the average price in Mablethorpe. There are 557 property listings for sale in Sutton On Sea South.
What streets have the most expensive properties for sale in Sutton On Sea South?
The streets with the most expensive properties for sale in Sutton On Sea South are St Francis Gardens at an average of £395,416, College Row at an average of £369,000 and Henshaw Avenue at an average of £347,440.
What streets have the most affordable properties for sale in Sutton On Sea South?
The streets with the most affordable properties for sale in Sutton On Sea South are Furlongs Road at an average of £132,500, Queens Road at an average of £160,183 and Surfside at an average of £163,333.
Which train stations are available in or near Sutton On Sea South?
Some of the train stations available in or near Sutton On Sea South are Skegness, Thorpe Culvert and Havenhouse.
Property Price Paid in Sutton On Sea South by Year
The average sold property price by year was:
| Year | Average Sold Price | Price Change |
Sold Properties
|
|---|---|---|---|
| 2025 | £245,983 | -4% |
45 Properties |
| 2024 | £256,003 | -1% |
49 Properties |
| 2023 | £258,758 | -9% |
41 Properties |
| 2022 | £282,608 | 14% |
53 Properties |
| 2021 | £244,438 | 17% |
80 Properties |
| 2020 | £202,965 | 3% |
58 Properties |
| 2019 | £195,972 | -4% |
51 Properties |
| 2018 | £204,500 | 9% |
70 Properties |
| 2017 | £187,036 | 7% |
83 Properties |
| 2016 | £174,344 | 6% |
89 Properties |
| 2015 | £164,457 | 11% |
70 Properties |
| 2014 | £146,935 | -3% |
65 Properties |
| 2013 | £151,258 | -0,5% |
75 Properties |
| 2012 | £151,986 | -1% |
66 Properties |
| 2011 | £153,077 | - |
59 Properties |
| 2010 | £153,119 | 5% |
56 Properties |
| 2009 | £145,349 | -4% |
44 Properties |
| 2008 | £150,636 | -8% |
47 Properties |
| 2007 | £163,207 | 2% |
82 Properties |
| 2006 | £160,698 | 4% |
73 Properties |
| 2005 | £154,357 | 10% |
62 Properties |
| 2004 | £139,544 | 13% |
90 Properties |
| 2003 | £121,476 | 17% |
72 Properties |
| 2002 | £101,177 | 22% |
112 Properties |
| 2001 | £78,699 | 13% |
118 Properties |
| 2000 | £68,537 | 9% |
96 Properties |
| 1999 | £62,034 | 9% |
113 Properties |
| 1998 | £56,615 | 8% |
94 Properties |
| 1997 | £52,302 | 4% |
77 Properties |
| 1996 | £49,974 | 1% |
79 Properties |
| 1995 | £49,227 | - |
69 Properties |
Property Price per Property Type in Sutton On Sea South
Here you can find historic sold price data in order to help with your property search.
The average Property Paid Price for specific property types in the last three years are:
| Property Type | Average Sold Price | Sold Properties |
|---|---|---|
| Semi Detached House | £202,876.00 | 28 Semi Detached Houses |
| Detached House | £282,759.00 | 147 Detached Houses |
| Terraced House | £152,462.00 | 12 Terraced Houses |
| Flat | £125,000.00 | 1 Flat |

