Houses for sale & to rent in Gedney, Spalding
House Prices in Gedney
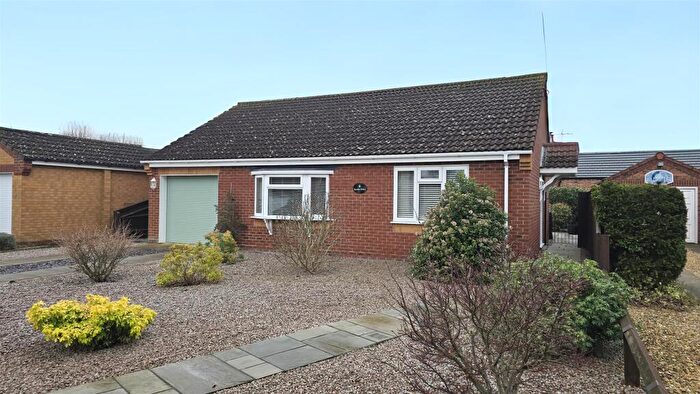
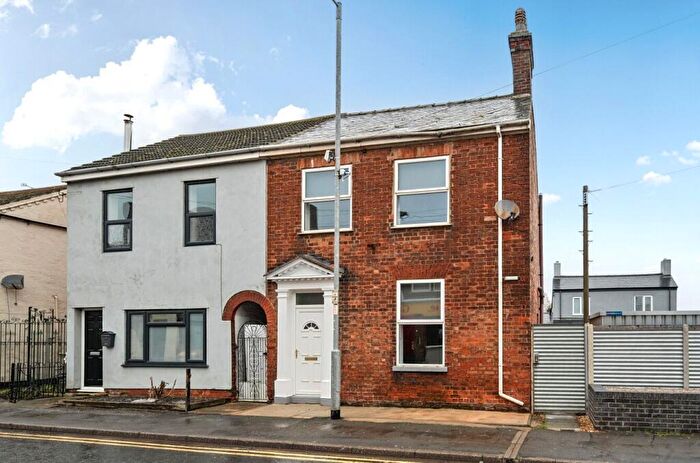
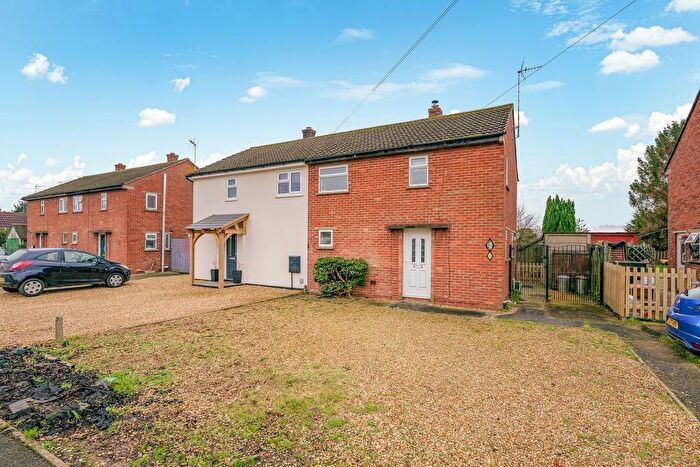
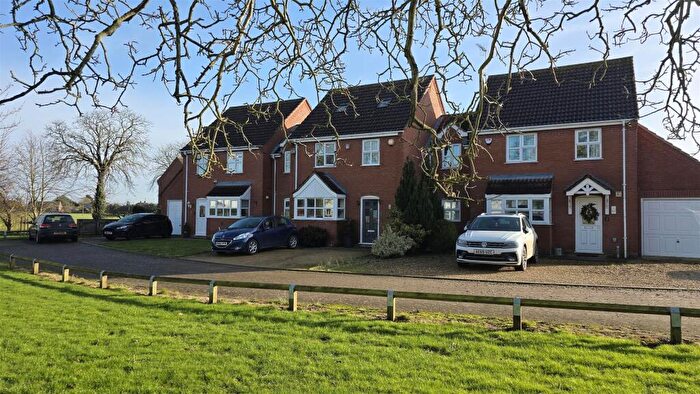
Properties in Gedney have an average house price of £272,383.00 and had 86 Property Transactions within the last 3 years¹.
Gedney is an area in Spalding, Lincolnshire with 937 households², where the most expensive property was sold for £750,000.00.
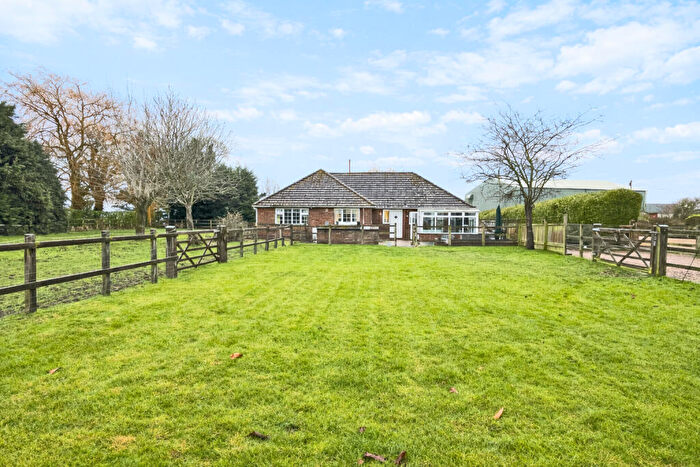
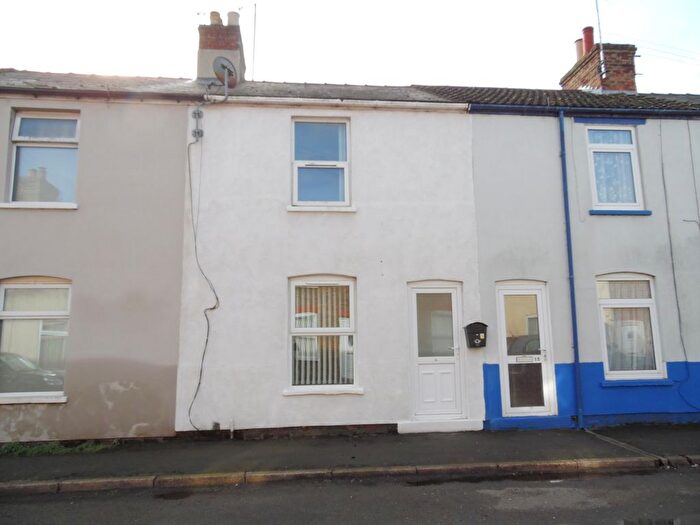
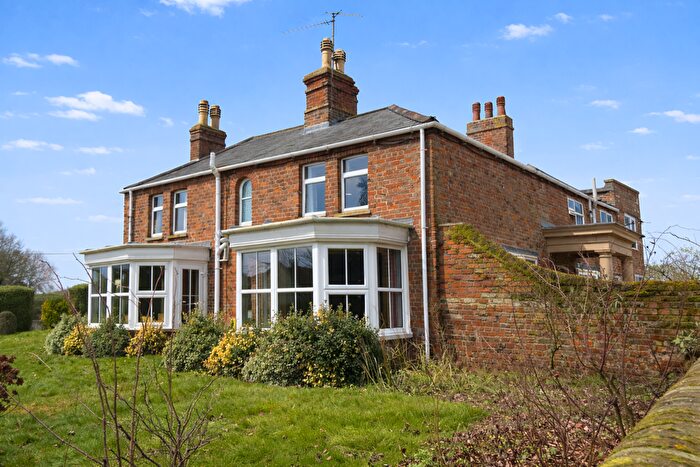
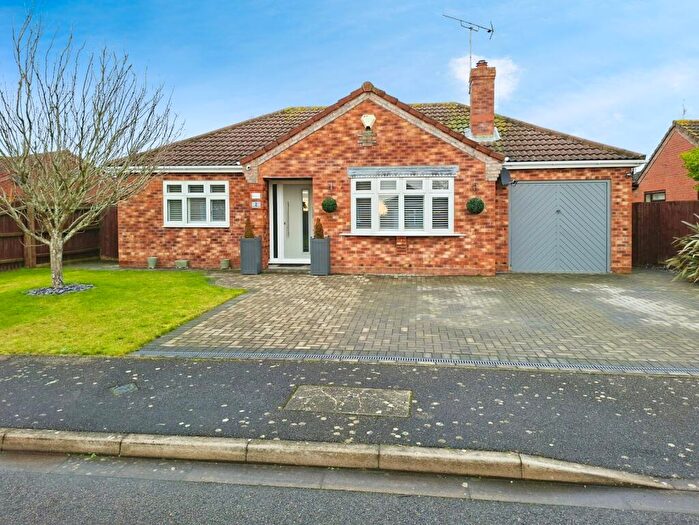
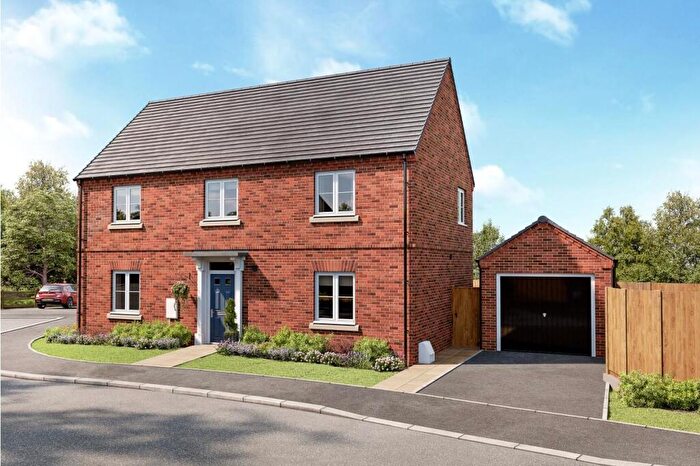
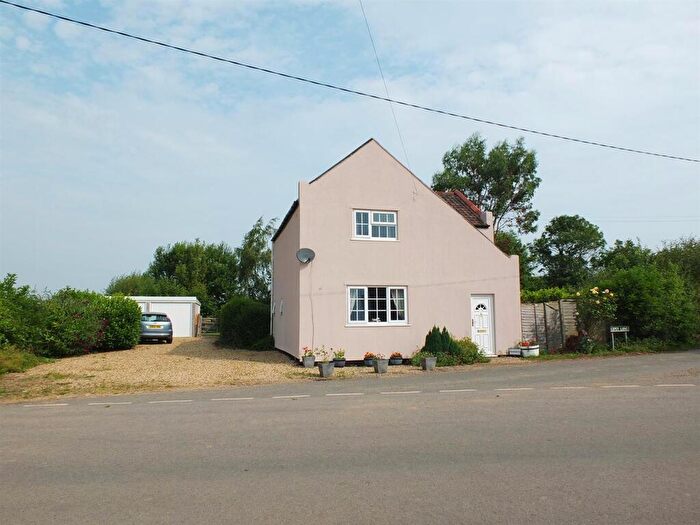
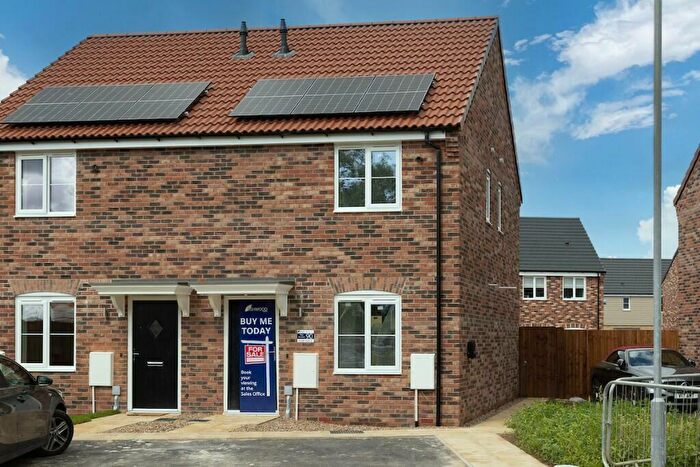
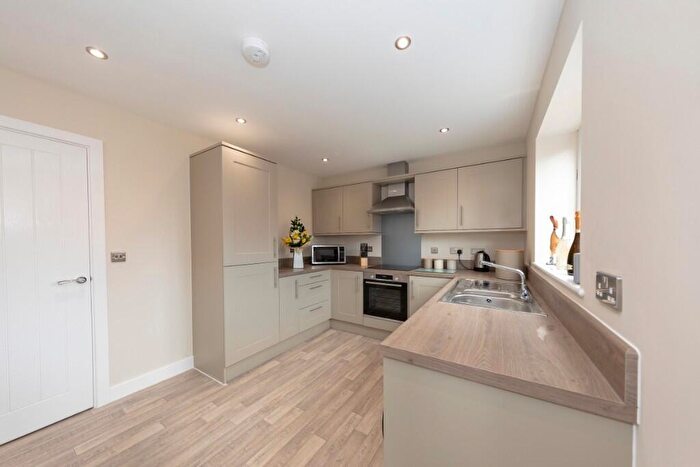
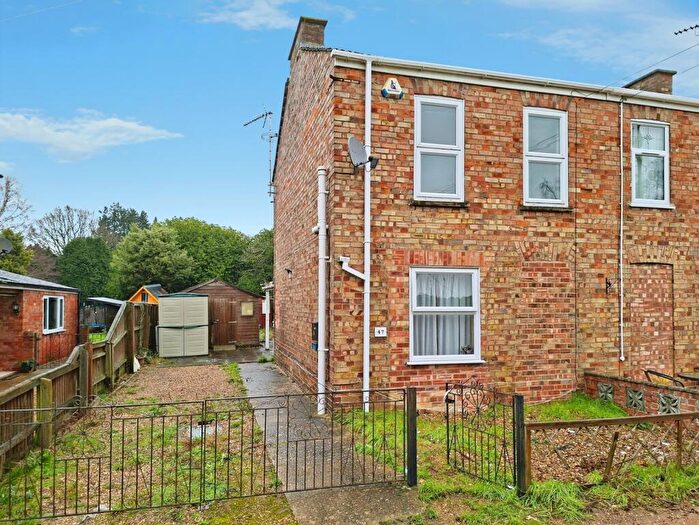
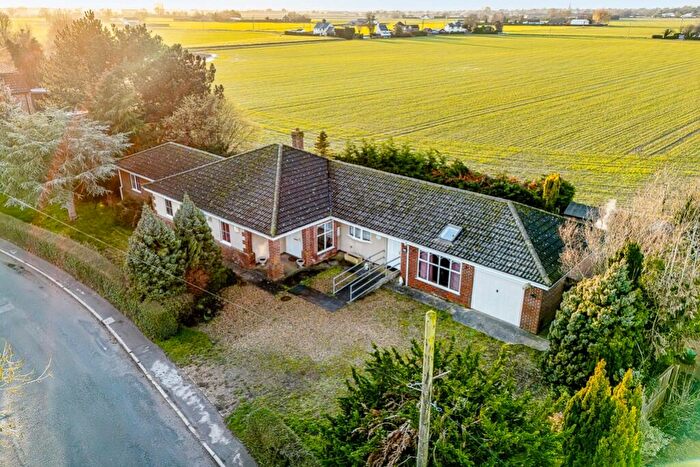
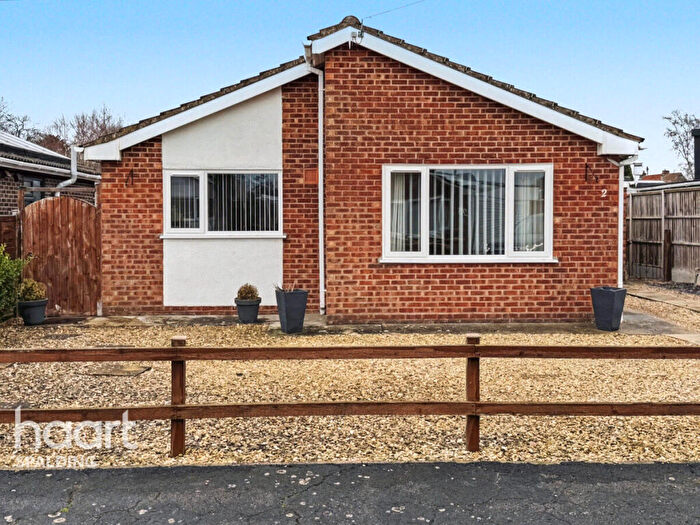
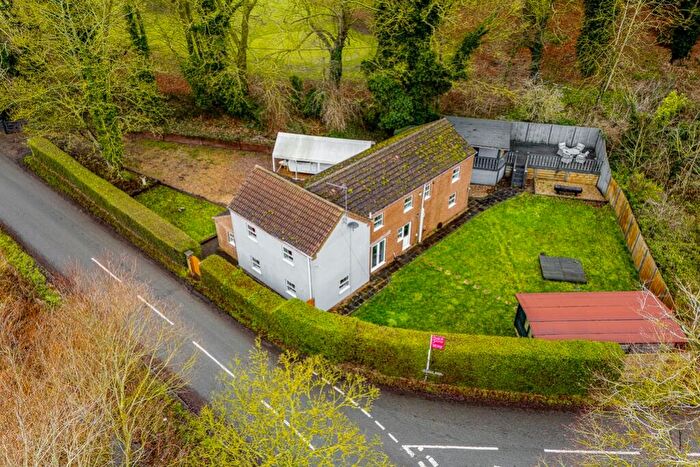
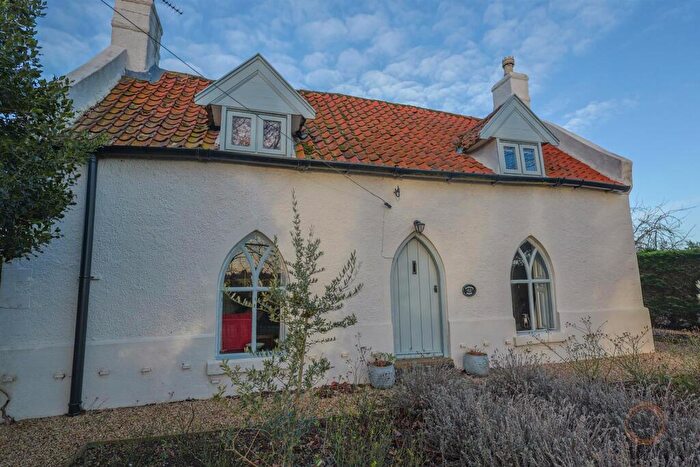
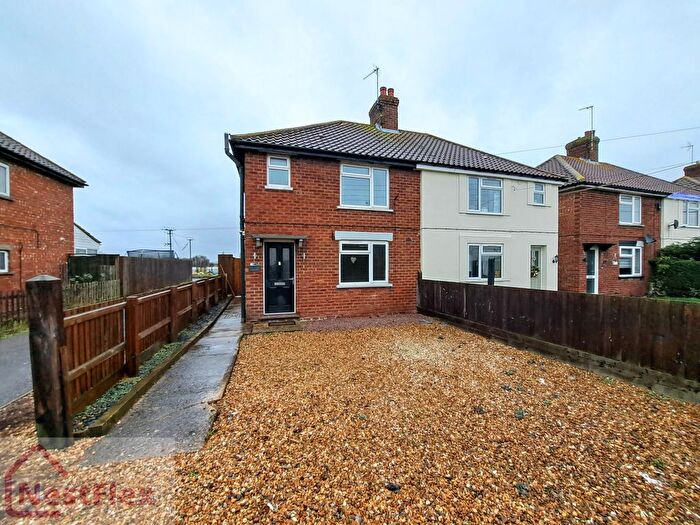
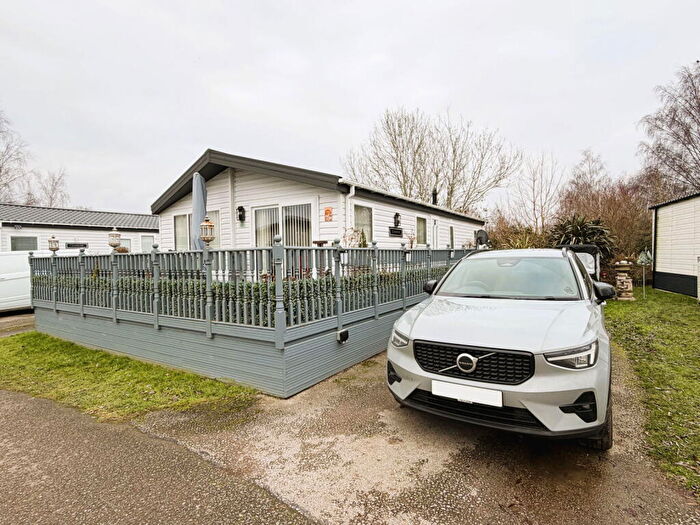
Properties for sale in Gedney
Roads and Postcodes in Gedney
Navigate through our locations to find the location of your next house in Gedney, Spalding for sale or to rent.
| Streets | Postcodes |
|---|---|
| Albert Avenue | PE12 0AB |
| Anvil Close | PE12 0BG |
| Batemans Close | PE12 0BX |
| Bells Bridge | PE12 8SH |
| Black Barn | PE12 9NE |
| Blackbarn Road | PE12 0AY PE12 9ND |
| Blaze Gate | PE12 9HJ |
| Blazegate | PE12 0AD |
| Bramley Meadows | PE12 0BN |
| Broadgate | PE12 0DE PE12 0DG |
| Chapelgate | PE12 0BJ |
| Charters Lane | PE12 9JX |
| Church End | PE12 0BU |
| Church Gate | PE12 0BZ |
| Church Street | PE12 9NL |
| Churchgate Mews | PE12 0BQ |
| Clarks Hill | PE12 0DQ |
| Dawsmere Bank | PE12 9NN |
| Dawsmere Road | PE12 9NQ PE12 9NW PE12 9PN |
| Dockings Holt | PE12 9HL |
| Durhams Road | PE12 9NJ |
| Engine Dyke | PE12 0BE |
| Fen Dike | PE12 0FF |
| Gedney Drove End | PE12 9PQ |
| Gedney Dyke | PE12 0AT |
| Gedney Marsh | PE12 9PA PE12 9PB |
| Gedney Road | PE12 9JU |
| George Avenue | PE12 9PE |
| Gipsy Lane | PE12 0AZ |
| Green Dyke | PE12 0BF PE12 9LW |
| Hallgate | PE12 0AF PE12 0AG PE12 0AH PE12 0DA |
| Harford Gate | PE12 0DF |
| Hargreaves Lane | PE12 0AS |
| Hoddins Way | PE12 9JB |
| Holbourns Site | PE12 9PF |
| Hunts Gate | PE12 0DJ |
| Jekils Bank | PE12 8SQ |
| Jiggles Gate | PE12 8SY |
| Kingsgate | PE12 0FG |
| Leighton Walk | PE12 0DN |
| Lowgate | PE12 0BB PE12 0BL |
| Lowgate Crescent | PE12 0AP |
| Main Road | PE12 0AA PE12 0BW PE12 9PD PE12 0DB |
| Main Street | PE12 0AJ |
| Manor View | PE12 0DT |
| Marsh Road | PE12 9PJ |
| Memorial Lane | PE12 0AN |
| Middle Drove | PE12 0AU |
| Onslow Lane | PE12 9RZ |
| Pinstock Lane | PE12 0BT |
| Pit Lane | PE12 9PG |
| Post Office Lane | PE12 9PX |
| Priestfield Drove | PE12 0BP |
| Ravens Bank | PE12 8PT |
| Ravens Clough | PE12 8SL |
| Ravens Drove | PE12 8SN |
| Rectory Lane | PE12 0EA |
| Red House Corner | PE12 9NG |
| Roman Bank | PE12 0AL PE12 0AR |
| Roman Way | PE12 0BA |
| Ropers Gate | PE12 0GA |
| Ryefield Lane | PE12 8PS |
| St Marys Meadows | PE12 0DL |
| Station Road | PE12 0DD |
| Stonegate | PE12 0BY |
| The Paddocks | PE12 0DP |
| Topsgate | PE12 0BS |
| Washway Road | PE12 0DH |
| Whiteacre Gardens | PE12 0DU |
| Wildfowlers Way | PE12 9PL |
| Winston Close | PE12 9PH |
| PE12 0AX PE12 8SG |
Transport near Gedney
- FAQ
- Price Paid By Year
- Property Type Price
Frequently asked questions about Gedney
What is the average price for a property for sale in Gedney?
The average price for a property for sale in Gedney is £272,383. This amount is 12% higher than the average price in Spalding. There are 3,357 property listings for sale in Gedney.
What streets have the most expensive properties for sale in Gedney?
The streets with the most expensive properties for sale in Gedney are Hallgate at an average of £485,000, Chapelgate at an average of £442,500 and Topsgate at an average of £440,000.
What streets have the most affordable properties for sale in Gedney?
The streets with the most affordable properties for sale in Gedney are Pit Lane at an average of £130,000, Marsh Road at an average of £140,000 and Gedney Marsh at an average of £153,000.
Which train stations are available in or near Gedney?
Some of the train stations available in or near Gedney are Spalding, Boston and King's Lynn.
Property Price Paid in Gedney by Year
The average sold property price by year was:
| Year | Average Sold Price | Price Change |
Sold Properties
|
|---|---|---|---|
| 2025 | £273,523 | 3% |
31 Properties |
| 2024 | £266,303 | -4% |
28 Properties |
| 2023 | £277,378 | 14% |
27 Properties |
| 2022 | £238,257 | -20% |
35 Properties |
| 2021 | £286,762 | 21% |
59 Properties |
| 2020 | £225,589 | 4% |
28 Properties |
| 2019 | £216,867 | 5% |
29 Properties |
| 2018 | £206,437 | -2% |
32 Properties |
| 2017 | £210,878 | 12% |
26 Properties |
| 2016 | £186,476 | -4% |
37 Properties |
| 2015 | £193,829 | 18% |
33 Properties |
| 2014 | £159,570 | -2% |
35 Properties |
| 2013 | £162,762 | -0,1% |
45 Properties |
| 2012 | £163,000 | -6% |
18 Properties |
| 2011 | £173,069 | -7% |
26 Properties |
| 2010 | £184,573 | 10% |
34 Properties |
| 2009 | £166,000 | -4% |
25 Properties |
| 2008 | £172,164 | -7% |
27 Properties |
| 2007 | £184,088 | 17% |
59 Properties |
| 2006 | £151,879 | 3% |
49 Properties |
| 2005 | £146,703 | -3% |
50 Properties |
| 2004 | £151,550 | 7% |
65 Properties |
| 2003 | £141,504 | 25% |
54 Properties |
| 2002 | £106,602 | 26% |
67 Properties |
| 2001 | £78,476 | 4% |
55 Properties |
| 2000 | £75,053 | 15% |
62 Properties |
| 1999 | £63,566 | 12% |
71 Properties |
| 1998 | £55,763 | -1% |
48 Properties |
| 1997 | £56,524 | 10% |
47 Properties |
| 1996 | £50,755 | 25% |
39 Properties |
| 1995 | £38,058 | - |
25 Properties |
Property Price per Property Type in Gedney
Here you can find historic sold price data in order to help with your property search.
The average Property Paid Price for specific property types in the last three years are:
| Property Type | Average Sold Price | Sold Properties |
|---|---|---|
| Semi Detached House | £206,460.00 | 27 Semi Detached Houses |
| Detached House | £310,178.00 | 56 Detached Houses |
| Terraced House | £176,250.00 | 2 Terraced Houses |
| Flat | £128,000.00 | 1 Flat |

