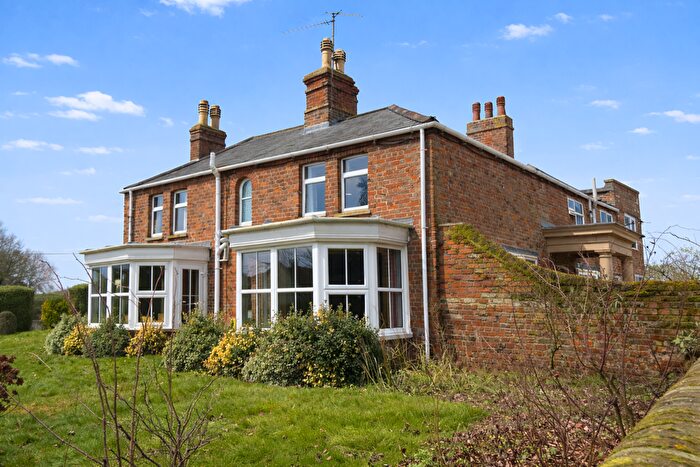
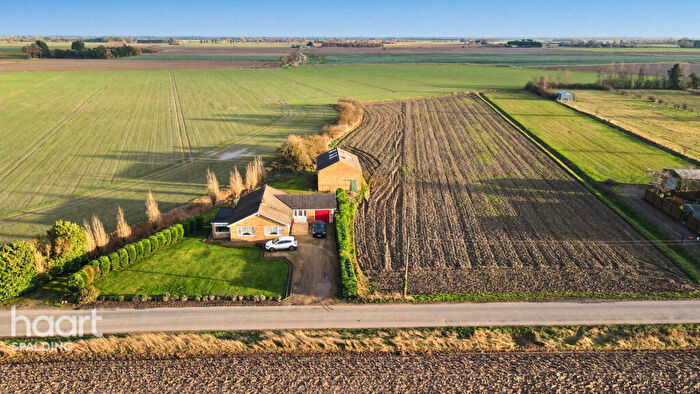
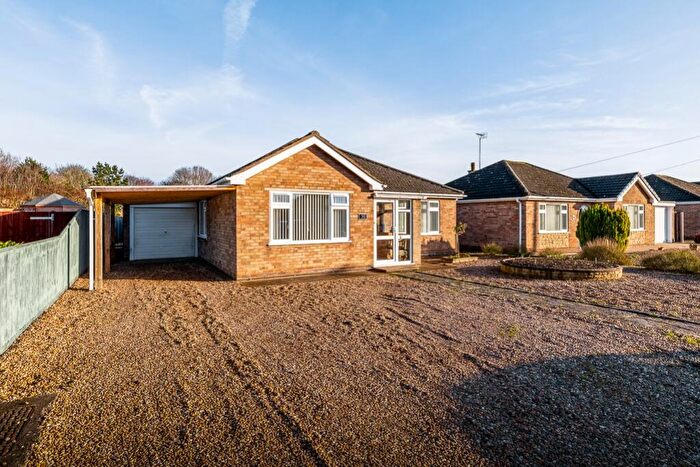
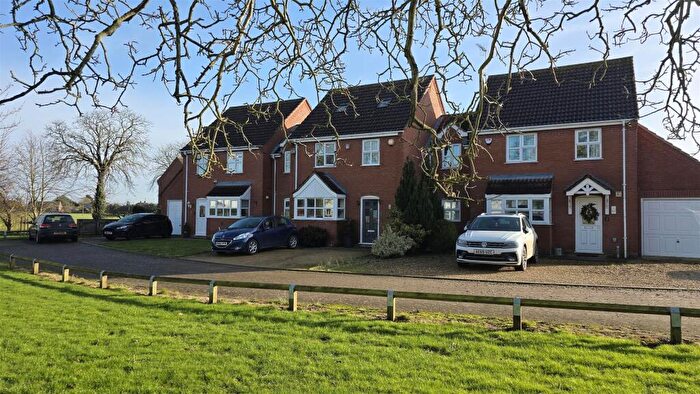
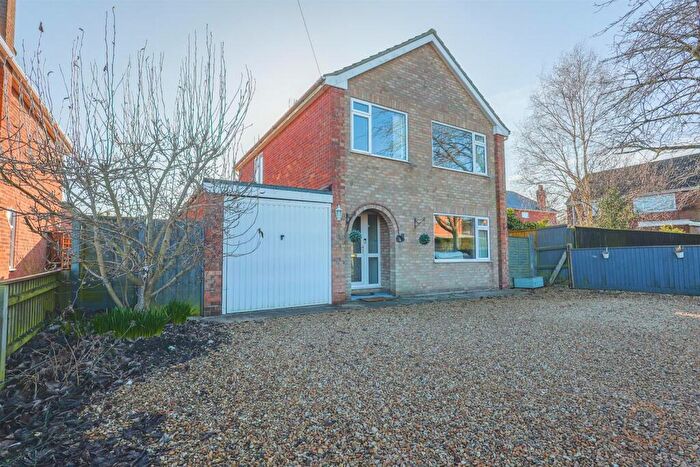
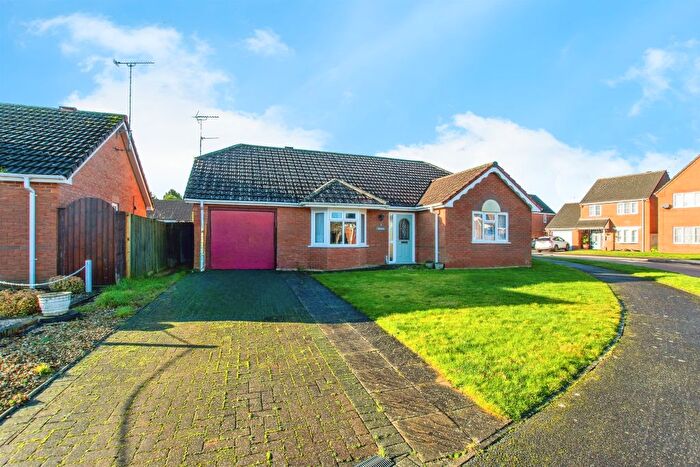
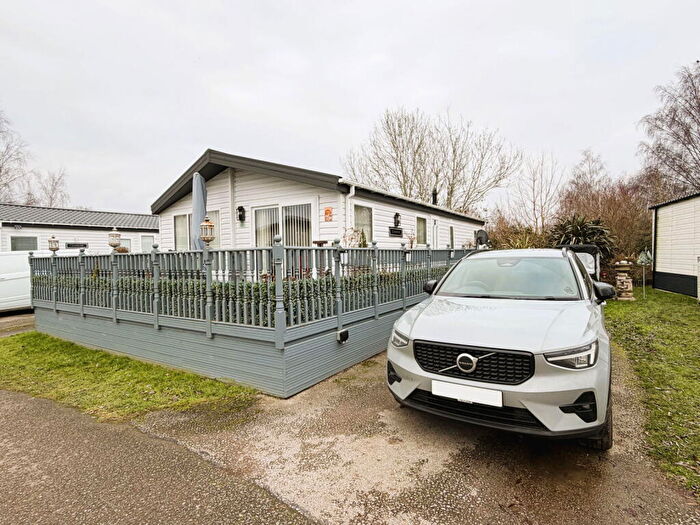
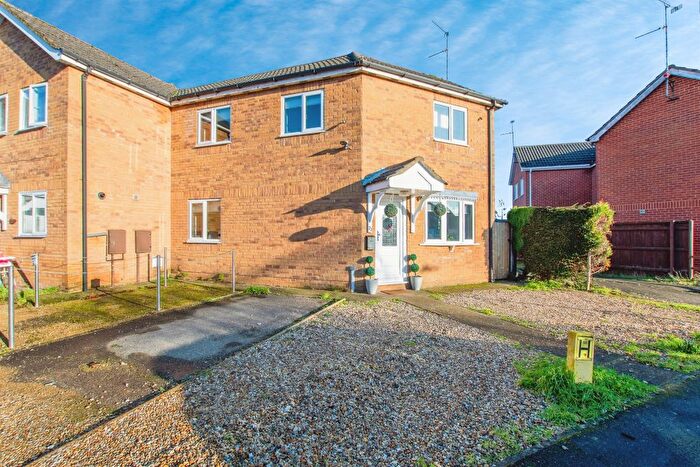
Houses for sale & to rent in Fleet, Spalding
House Prices in Fleet
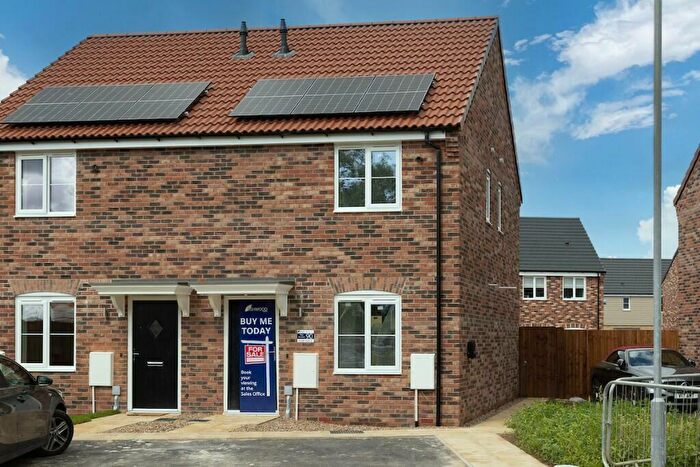
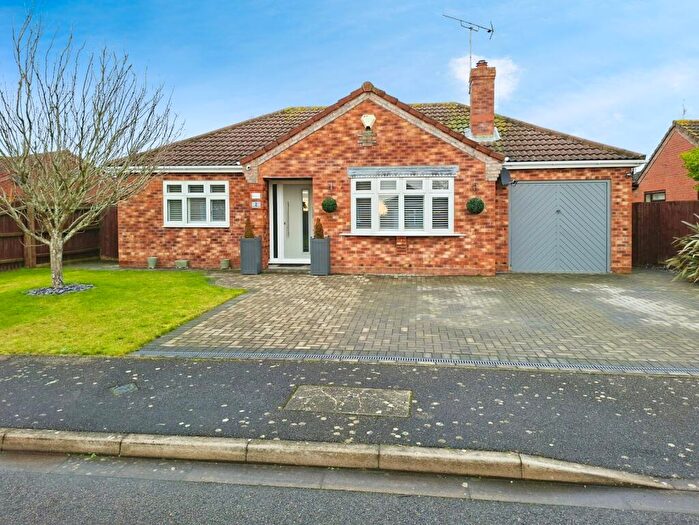
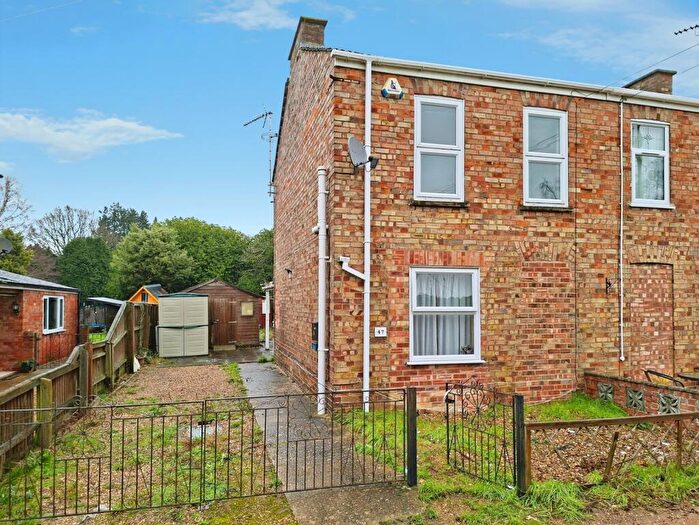
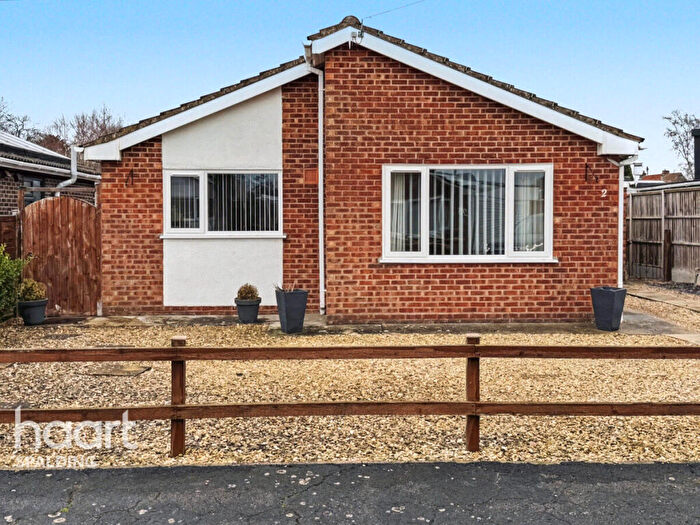
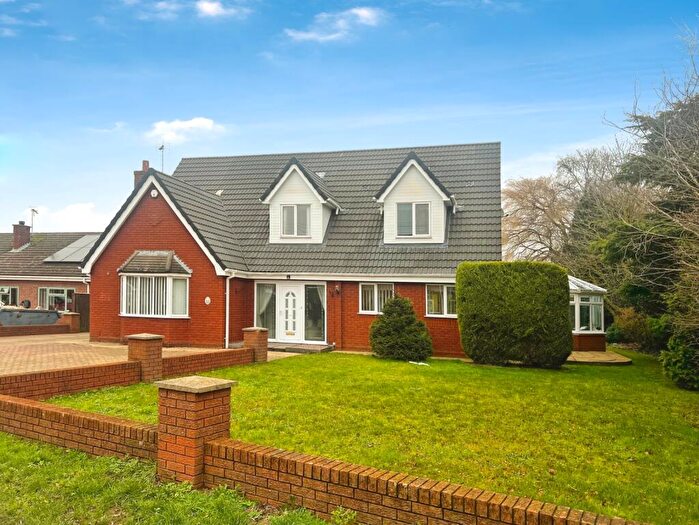
Properties in Fleet have an average house price of £255,425.00 and had 115 Property Transactions within the last 3 years¹.
Fleet is an area in Spalding, Lincolnshire with 962 households², where the most expensive property was sold for £1,000,000.00.
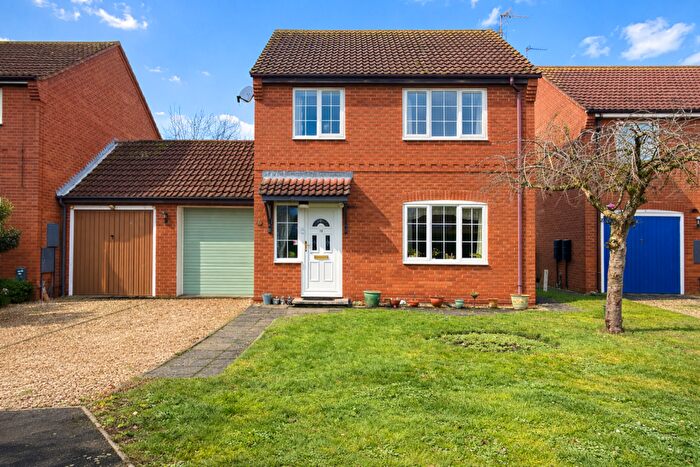
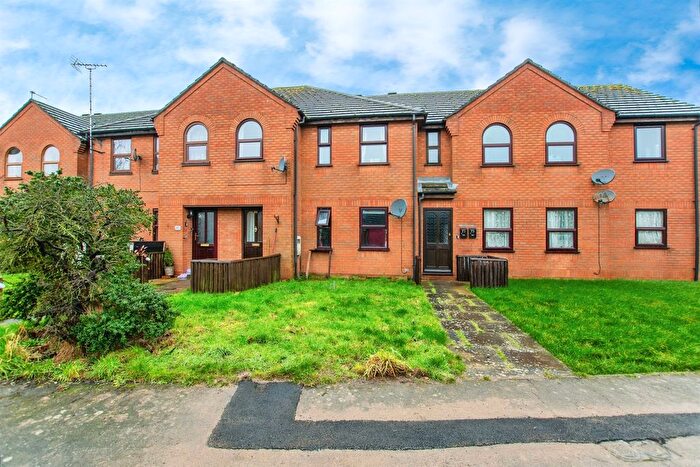
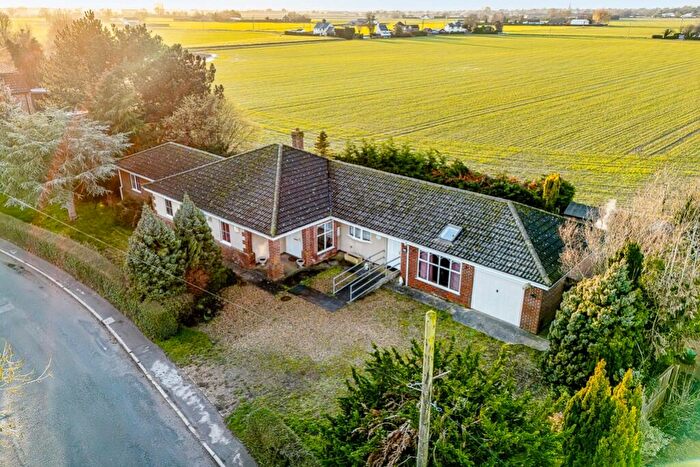
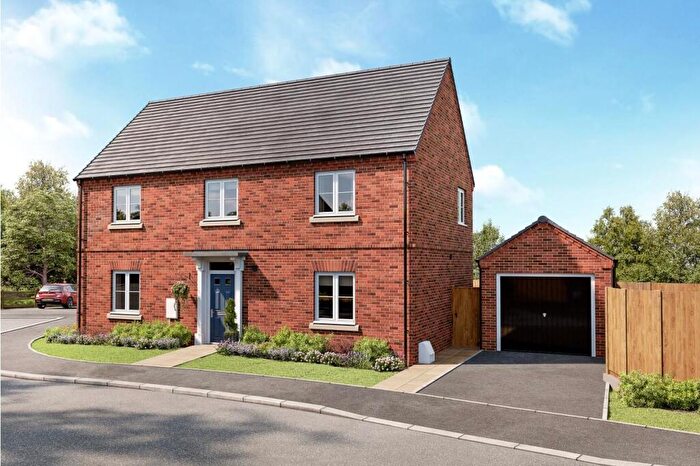
Properties for sale in Fleet
Roads and Postcodes in Fleet
Navigate through our locations to find the location of your next house in Fleet, Spalding for sale or to rent.
| Streets | Postcodes |
|---|---|
| Albion Street | PE12 7AZ |
| Armitage Close | PE12 7QL |
| Balls Lane | PE12 8QU |
| Bensgate Road | PE12 8NL PE12 8PQ |
| Bramley Close | PE12 8TG |
| Branches Lane | PE12 7BE PE12 7BG PE12 8PD PE12 8PE |
| Burgess Drive | PE12 8NR |
| Cavell Way | PE12 8PN |
| Chapman Mews | PE12 8NZ |
| Charles Road | PE12 8NB |
| Cherry Close | PE12 8LQ |
| Cherry Lane | PE12 8NY |
| Church End | PE12 8NQ |
| Church Gate | PE12 8AW |
| Cross Drove | PE12 0PZ |
| Cross Street | PE12 7BD |
| Darwin Avenue | PE12 8LX |
| Eastgate | PE12 8NA PE12 8ND |
| Eastgate Gardens | PE12 8NP |
| Fitzroy Road | PE12 8PL |
| Fleet Bank | PE12 0AW PE12 8LW |
| Fleet Coy | PE12 0RU |
| Fleet Mews | PE12 7BS |
| Fleet Road | PE12 8LA PE12 8LD PE12 8LE PE12 8AP |
| Fleet Road Industrial Estate | PE12 8LY |
| Frostley Gate | PE12 8SR |
| Greenfields | PE12 7BJ |
| Grimwood Close | PE12 8PA |
| Hallgate | PE12 8NG |
| Hargate Close | PE12 8LU |
| Haven Close | PE12 8NS |
| Haycroft Lane | PE12 8LB |
| Hazelwood Lane | PE12 8PF |
| Hocklesgate | PE12 8LF PE12 8LG PE12 8NE PE12 8NF |
| Jekylls Gate | PE12 8QS |
| Joys Bank | PE12 8SD |
| Lambert Bank | PE12 0PR PE12 8RT |
| Lancewood Road | PE12 8FE |
| Langary Gate | PE12 8SE |
| Littlemarsh Lane | PE12 8NW |
| Long Lane | PE12 0PP |
| Lowgate | PE12 8LN |
| Maisdyke Lane | PE12 8NH |
| Mayfair Close | PE12 8JZ |
| Mill Bank | PE12 8QW |
| Moor Gate | PE12 8ST PE12 8FB PE12 8FD |
| Nealsgate Road | PE12 8SW |
| New Fen Drove | PE12 0PY |
| Old Barn Court | PE12 8LZ |
| Old Main Road | PE12 8LH PE12 8LJ PE12 8LL |
| Orchard Park | PE12 7BP PE12 7BX |
| Parklands | PE12 8NU |
| Penricsway | PE12 8JS |
| Pike Dam Lane | PE12 8QT |
| Princes Street | PE12 7BB |
| Proctors Close | PE12 8NX |
| Ravensgate | PE12 8PH |
| Rowan Close | PE12 7BT |
| Strongs Bank | PE12 8PJ |
| The Brambles | PE12 7JU |
| The Maples | PE12 8NT |
| Torrington Lane | PE12 8NJ |
| Tower Gardens | PE12 7FT |
| Union Street | PE12 7BA |
| Washway Road | PE12 8LT |
| Weydyke Bank | PE12 8QR |
| Winslow Gate | PE12 8LS |
| Wood Lane | PE12 8NN |
Transport near Fleet
- FAQ
- Price Paid By Year
- Property Type Price
Frequently asked questions about Fleet
What is the average price for a property for sale in Fleet?
The average price for a property for sale in Fleet is £255,425. This amount is 5% higher than the average price in Spalding. There are 3,121 property listings for sale in Fleet.
What streets have the most expensive properties for sale in Fleet?
The streets with the most expensive properties for sale in Fleet are Haycroft Lane at an average of £1,000,000, Weydyke Bank at an average of £475,000 and Fleet Bank at an average of £405,000.
What streets have the most affordable properties for sale in Fleet?
The streets with the most affordable properties for sale in Fleet are Lowgate at an average of £99,666, Old Barn Court at an average of £140,000 and Union Street at an average of £170,500.
Which train stations are available in or near Fleet?
Some of the train stations available in or near Fleet are Spalding, Boston and Hubberts Bridge.
Property Price Paid in Fleet by Year
The average sold property price by year was:
| Year | Average Sold Price | Price Change |
Sold Properties
|
|---|---|---|---|
| 2025 | £253,142 | -1% |
35 Properties |
| 2024 | £254,510 | -2% |
44 Properties |
| 2023 | £258,763 | -2% |
36 Properties |
| 2022 | £264,257 | -6% |
41 Properties |
| 2021 | £280,010 | 22% |
64 Properties |
| 2020 | £217,905 | 24% |
37 Properties |
| 2019 | £165,884 | -27% |
76 Properties |
| 2018 | £209,850 | 6% |
52 Properties |
| 2017 | £196,681 | 1% |
40 Properties |
| 2016 | £194,248 | 11% |
68 Properties |
| 2015 | £172,053 | -1% |
61 Properties |
| 2014 | £174,617 | 15% |
54 Properties |
| 2013 | £149,274 | -5% |
47 Properties |
| 2012 | £156,640 | 7% |
39 Properties |
| 2011 | £145,461 | -6% |
39 Properties |
| 2010 | £154,097 | -6% |
45 Properties |
| 2009 | £163,351 | -4% |
34 Properties |
| 2008 | £169,379 | 1% |
30 Properties |
| 2007 | £168,453 | 4% |
69 Properties |
| 2006 | £162,051 | 4% |
59 Properties |
| 2005 | £156,356 | 0,5% |
48 Properties |
| 2004 | £155,615 | 24% |
50 Properties |
| 2003 | £117,936 | 11% |
64 Properties |
| 2002 | £104,381 | 17% |
63 Properties |
| 2001 | £86,200 | 9% |
68 Properties |
| 2000 | £78,075 | 20% |
75 Properties |
| 1999 | £62,263 | 5% |
62 Properties |
| 1998 | £59,114 | 8% |
55 Properties |
| 1997 | £54,319 | 16% |
53 Properties |
| 1996 | £45,659 | -10% |
48 Properties |
| 1995 | £50,390 | - |
30 Properties |
Property Price per Property Type in Fleet
Here you can find historic sold price data in order to help with your property search.
The average Property Paid Price for specific property types in the last three years are:
| Property Type | Average Sold Price | Sold Properties |
|---|---|---|
| Semi Detached House | £200,523.00 | 21 Semi Detached Houses |
| Detached House | £282,320.00 | 84 Detached Houses |
| Terraced House | £156,750.00 | 8 Terraced Houses |
| Flat | £97,000.00 | 2 Flats |

