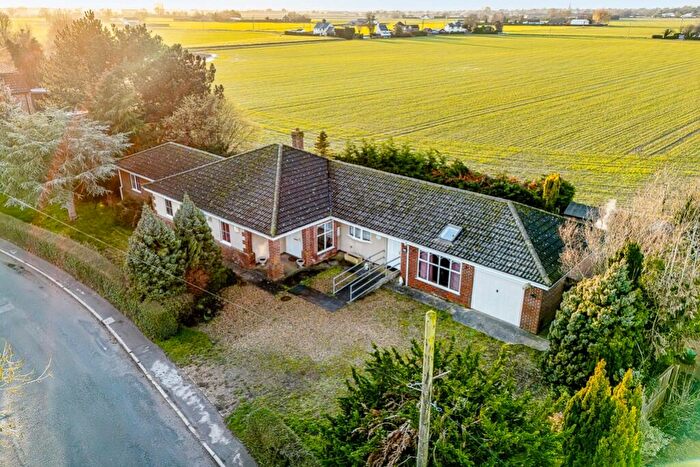
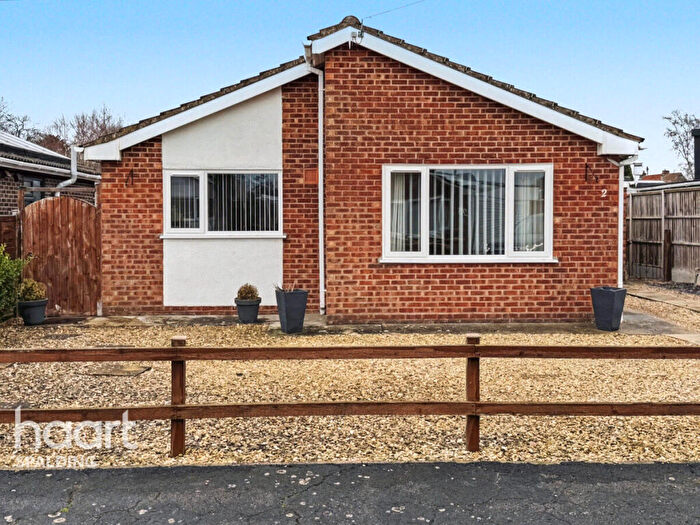
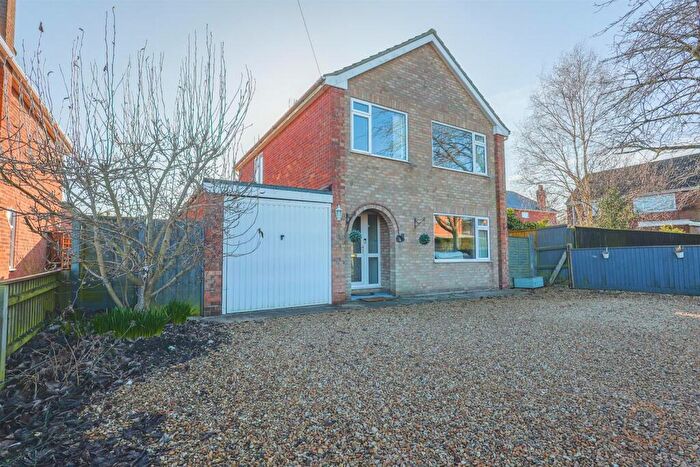
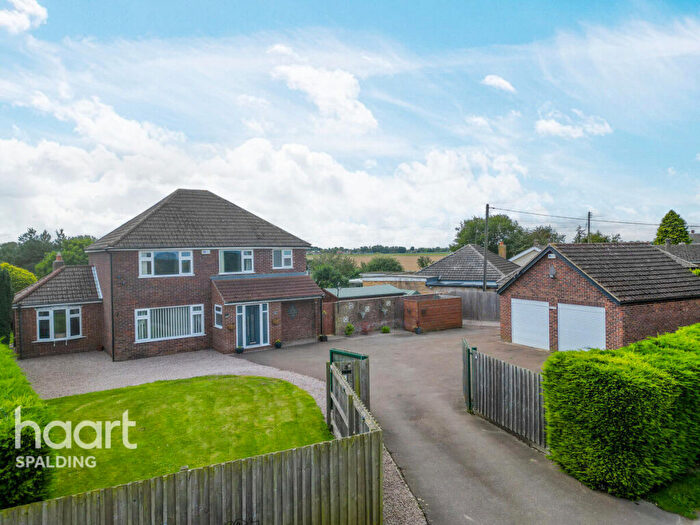
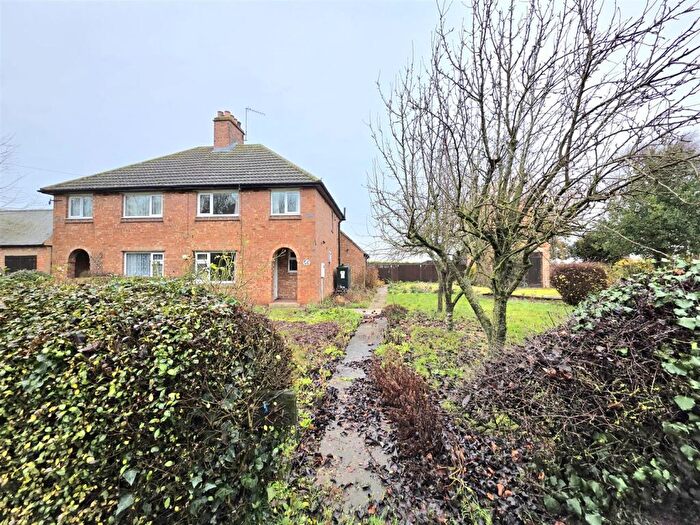
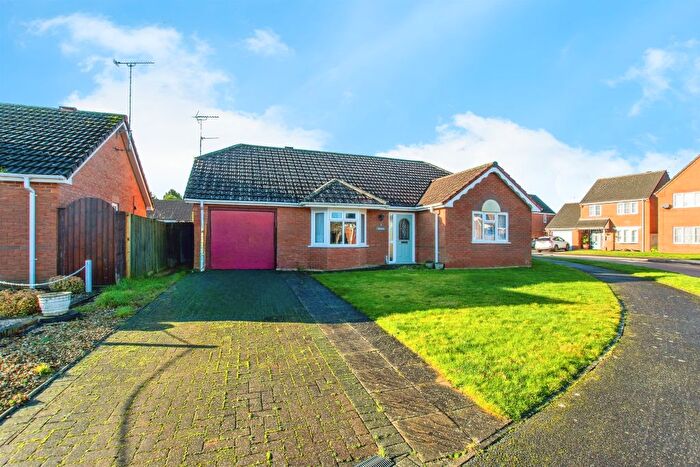
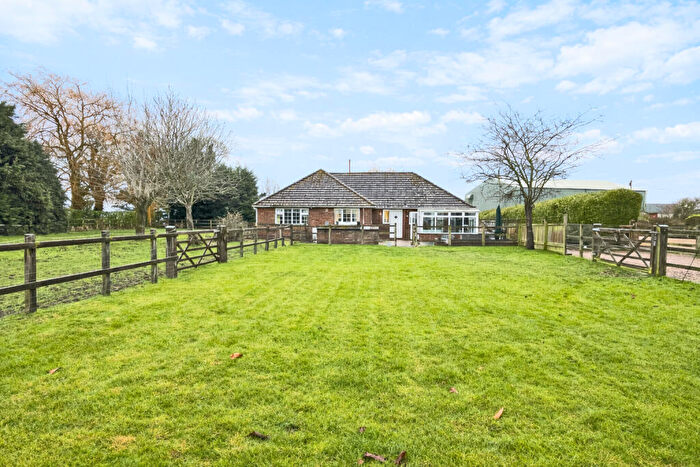
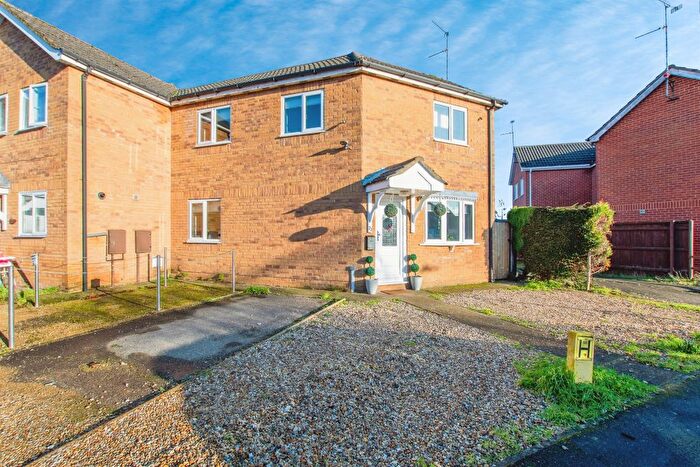
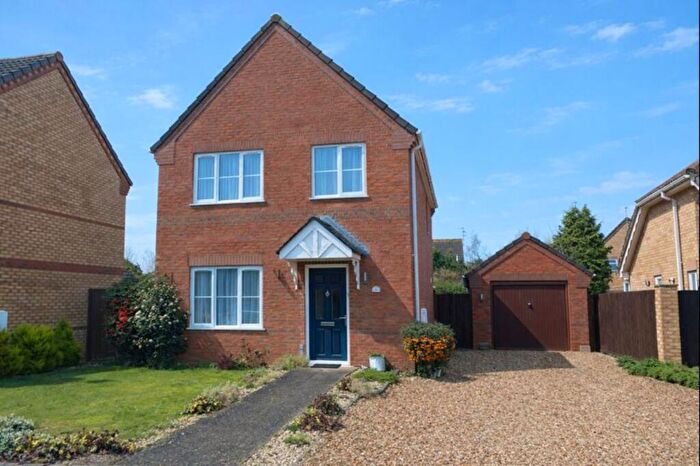
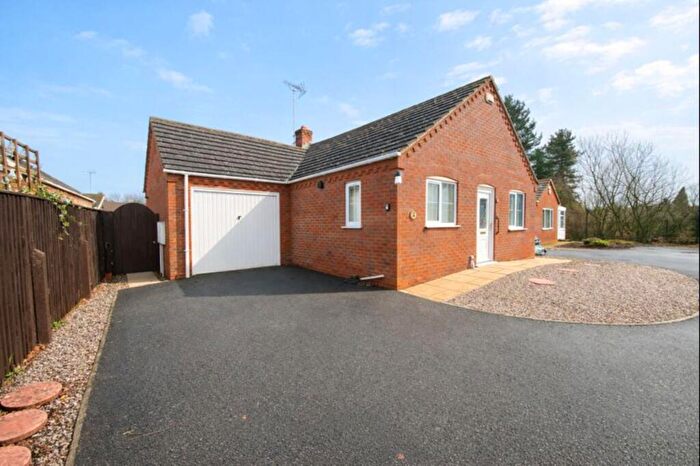
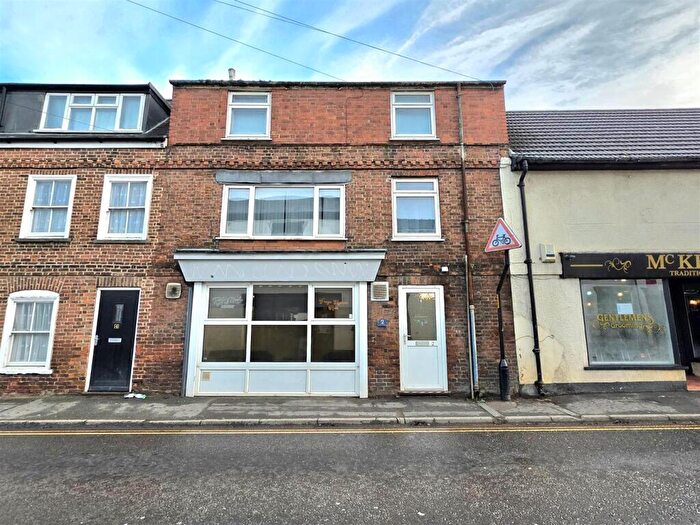
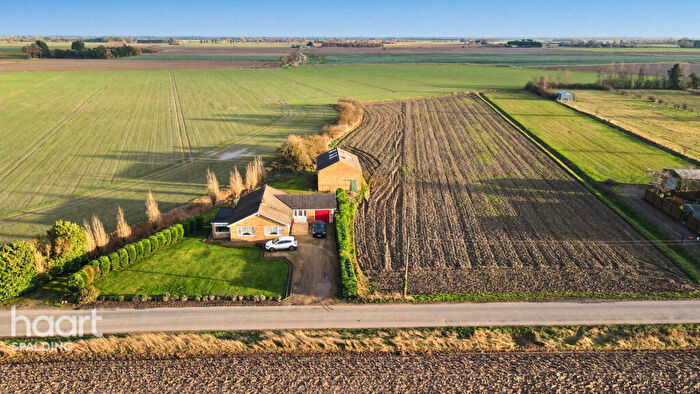
Houses for sale & to rent in Holbeach Hurn, Spalding
House Prices in Holbeach Hurn
Properties in Holbeach Hurn have an average house price of £259,804.00 and had 68 Property Transactions within the last 3 years¹.
Holbeach Hurn is an area in Spalding, Lincolnshire with 885 households², where the most expensive property was sold for £530,000.00.
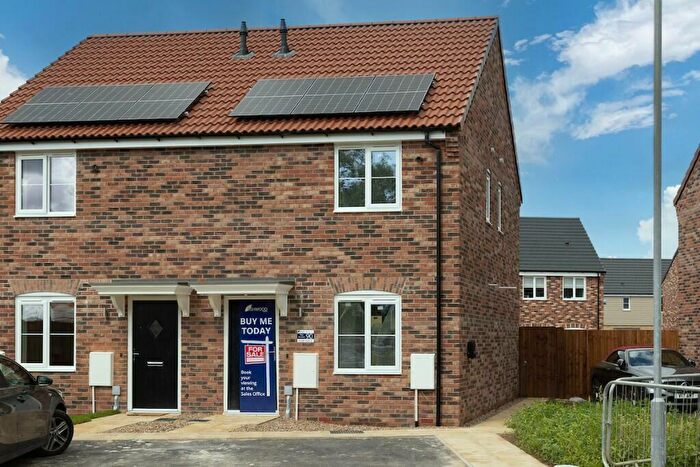
Properties for sale in Holbeach Hurn
Roads and Postcodes in Holbeach Hurn
Navigate through our locations to find the location of your next house in Holbeach Hurn, Spalding for sale or to rent.
| Streets | Postcodes |
|---|---|
| Academy Close | PE12 7QE |
| Allotment Lane | PE12 8BD |
| Ashburton Close | PE12 7RR |
| Ashville Close | PE12 8DG |
| Baileys Lane | PE12 8JP |
| Bass Chase Bank | PE12 8BY |
| Battlefields Lane North | PE12 7PF |
| Boston Road North | PE12 8AD PE12 8AG PE12 8AQ |
| Browne Wilkinson Walk | PE12 8HE |
| Cackle Hill | PE12 8BS |
| Campling Place | PE12 8BU |
| Cherry Tree Lane | PE12 7PX |
| Church Close | PE12 8EN |
| Clough Road | PE12 8BW |
| Cowfield Gould | PE12 8DP |
| Crown Avenue | PE12 8EU |
| Crown Lodge | PE12 8TE |
| Eastern Road | PE12 8EL PE12 8EP PE12 8EW |
| Flint House Road | PE12 8BZ |
| Highbury Drive | PE12 7QJ |
| Holbeach Hurn | PE12 8JX PE12 8LR |
| Holbeach St. Marks | PE12 8ES PE12 8EX PE12 8HA PE12 8HD PE12 8EA PE12 8HB |
| Hurn Bank | PE12 8JG PE12 8JQ PE12 8JH |
| Hurn Road | PE12 8JD PE12 8JE PE12 8JB PE12 8JW |
| Keightley Road | PE12 8BE |
| Kennedy Road | PE12 8AF |
| Lapwater Lane | PE12 8ET PE12 8DB |
| Leadenhall Road | PE12 8EY |
| Lincoln Lane | PE12 8DY |
| Little Common Lane | PE12 8BL |
| Low Road | PE12 8JN |
| Marsh Road | PE12 8JT PE12 8JY PE12 8JR |
| Middle Marsh Road | PE12 8DT PE12 8DU PE12 8DX |
| Mill Lane | PE12 8AX |
| New Road | PE12 8EE PE12 8EF |
| Oakley Place | PE12 8JU |
| Paddock Lane | PE12 8AJ |
| Park Road | PE12 7PS |
| Peartree Corner | PE12 8DL |
| Peartree House Road | PE12 8DW |
| Penny Hill Road | PE12 7RT |
| Pennyhill | PE12 8DN |
| Roman Bank | PE12 8BX PE12 8DH PE12 8DJ PE12 8DS |
| Sluice Road | PE12 8BH |
| Sots Hole Bank | PE12 8EJ |
| St Marks Road | PE12 8DZ PE12 8ED PE12 8DF |
| Star Lane | PE12 8BQ |
| Strawberry Fields Drive | PE12 8ER |
| The Grove | PE12 8JJ |
| Tinsley Cottage | PE12 8HF |
| Tolls Lane | PE12 7PR |
| Washway Road | PE12 7PE PE12 7PP PE12 8AH PE12 8BP PE12 8BT PE12 8JA |
| Welbourne Lane East | PE12 8AB |
| Welbourne Lane North | PE12 8AE |
| Windy Corner | PE12 8EZ |
| Woodhouse Lane | PE12 7PD |
| PE12 8EQ PE12 8EG PE12 8JF PE12 8JL |
Transport near Holbeach Hurn
- FAQ
- Price Paid By Year
- Property Type Price
Frequently asked questions about Holbeach Hurn
What is the average price for a property for sale in Holbeach Hurn?
The average price for a property for sale in Holbeach Hurn is £259,804. This amount is 7% higher than the average price in Spalding. There are 1,694 property listings for sale in Holbeach Hurn.
What streets have the most expensive properties for sale in Holbeach Hurn?
The streets with the most expensive properties for sale in Holbeach Hurn are Peartree House Road at an average of £530,000, Paddock Lane at an average of £456,250 and Crown Lodge at an average of £430,000.
What streets have the most affordable properties for sale in Holbeach Hurn?
The streets with the most affordable properties for sale in Holbeach Hurn are Bass Chase Bank at an average of £122,000, Flint House Road at an average of £190,000 and Tolls Lane at an average of £197,500.
Which train stations are available in or near Holbeach Hurn?
Some of the train stations available in or near Holbeach Hurn are Spalding, Boston and Hubberts Bridge.
Property Price Paid in Holbeach Hurn by Year
The average sold property price by year was:
| Year | Average Sold Price | Price Change |
Sold Properties
|
|---|---|---|---|
| 2025 | £256,766 | 1% |
15 Properties |
| 2024 | £254,115 | -7% |
32 Properties |
| 2023 | £270,643 | 13% |
21 Properties |
| 2022 | £235,151 | 1% |
33 Properties |
| 2021 | £231,684 | 23% |
43 Properties |
| 2020 | £177,354 | -12% |
31 Properties |
| 2019 | £198,179 | -0,1% |
55 Properties |
| 2018 | £198,462 | 5% |
40 Properties |
| 2017 | £188,176 | 5% |
39 Properties |
| 2016 | £178,376 | 7% |
42 Properties |
| 2015 | £165,109 | 6% |
44 Properties |
| 2014 | £155,541 | 8% |
44 Properties |
| 2013 | £142,446 | 6% |
38 Properties |
| 2012 | £133,948 | 10% |
29 Properties |
| 2011 | £120,336 | -36% |
27 Properties |
| 2010 | £163,082 | 22% |
29 Properties |
| 2009 | £127,442 | -43% |
27 Properties |
| 2008 | £181,870 | 10% |
20 Properties |
| 2007 | £164,516 | 7% |
48 Properties |
| 2006 | £153,140 | 13% |
36 Properties |
| 2005 | £133,604 | 0,3% |
42 Properties |
| 2004 | £133,227 | 8% |
69 Properties |
| 2003 | £122,507 | 20% |
60 Properties |
| 2002 | £97,437 | 9% |
57 Properties |
| 2001 | £89,128 | 22% |
53 Properties |
| 2000 | £69,458 | 22% |
43 Properties |
| 1999 | £54,251 | 5% |
60 Properties |
| 1998 | £51,332 | 7% |
43 Properties |
| 1997 | £47,654 | 2% |
30 Properties |
| 1996 | £46,468 | 12% |
27 Properties |
| 1995 | £40,956 | - |
25 Properties |
Property Price per Property Type in Holbeach Hurn
Here you can find historic sold price data in order to help with your property search.
The average Property Paid Price for specific property types in the last three years are:
| Property Type | Average Sold Price | Sold Properties |
|---|---|---|
| Semi Detached House | £208,182.00 | 23 Semi Detached Houses |
| Detached House | £297,683.00 | 41 Detached Houses |
| Terraced House | £168,373.00 | 4 Terraced Houses |

