Houses for sale & to rent in The Saints, Spalding
House Prices in The Saints
Properties in The Saints have an average house price of £326,422.00 and had 89 Property Transactions within the last 3 years¹.
The Saints is an area in Spalding, Lincolnshire with 1,023 households², where the most expensive property was sold for £895,000.00.
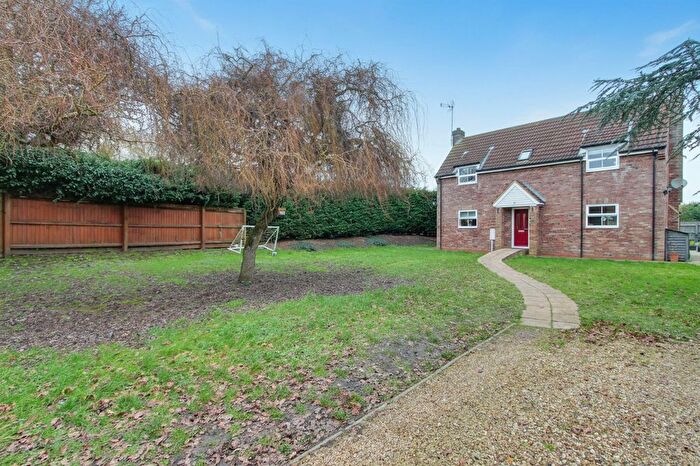
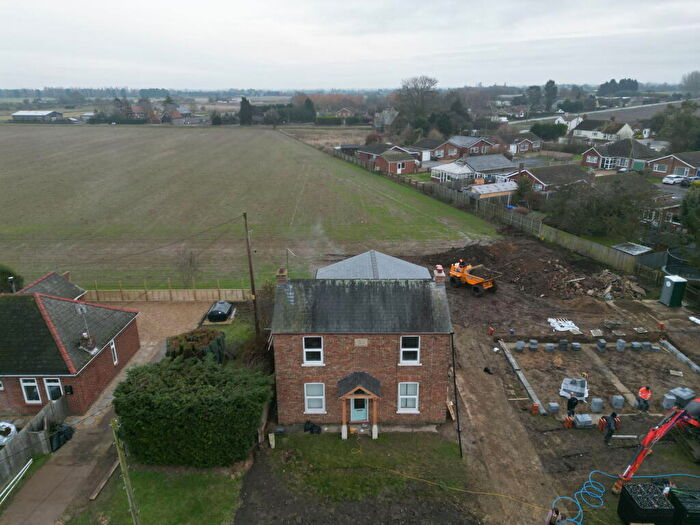
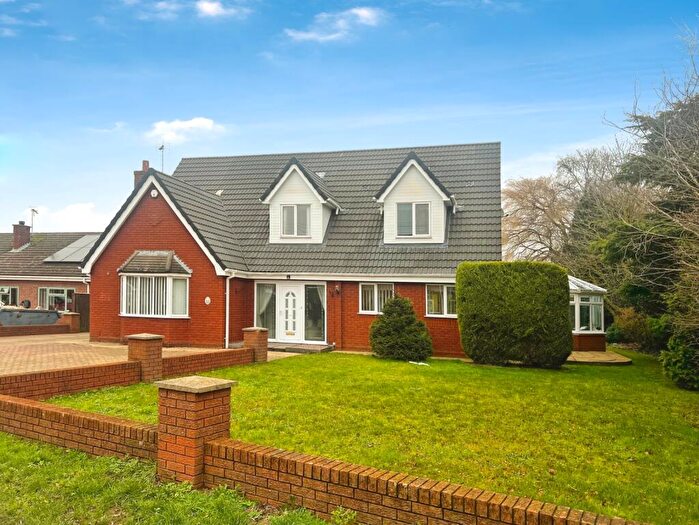
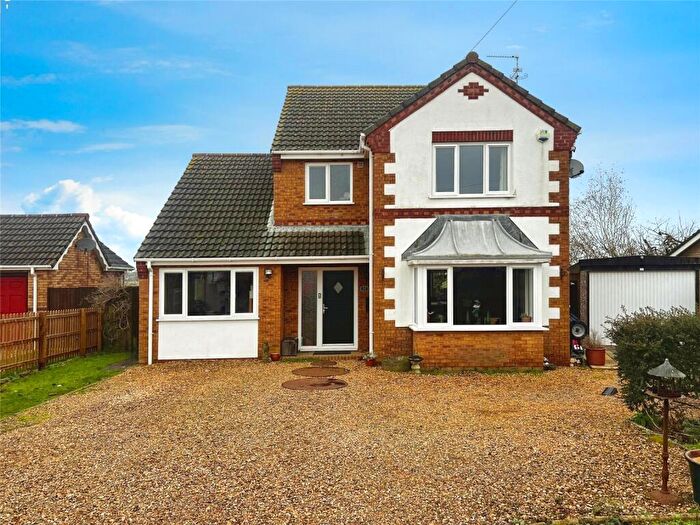
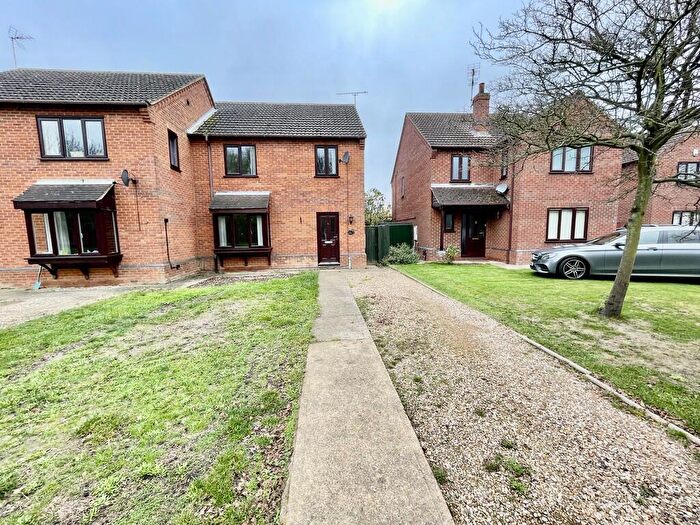
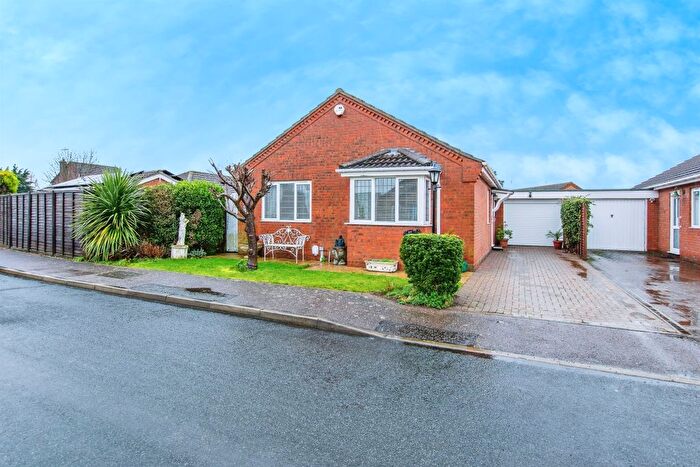
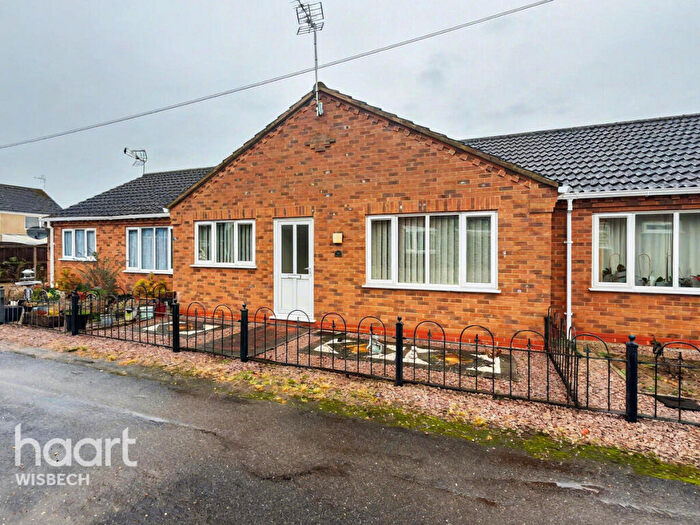
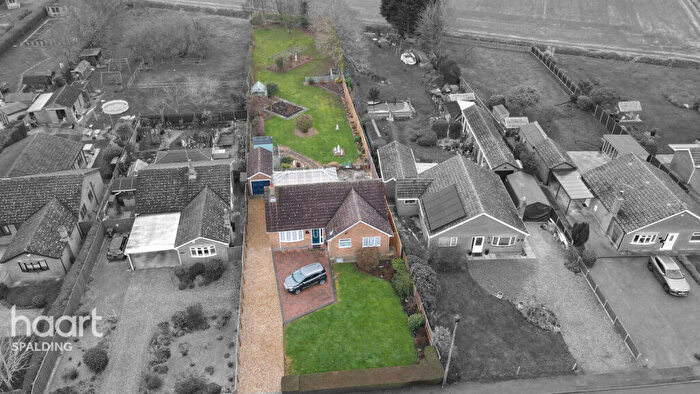
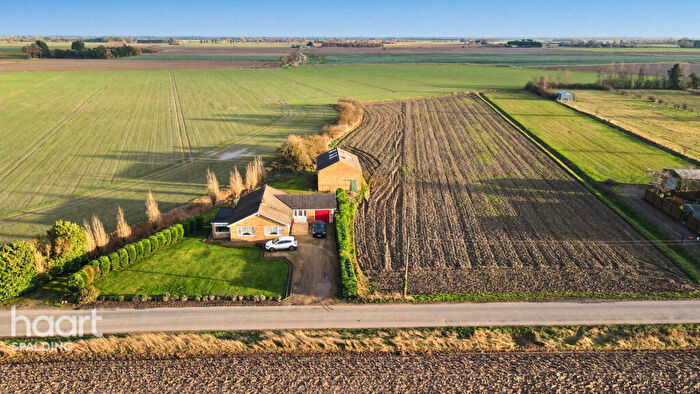
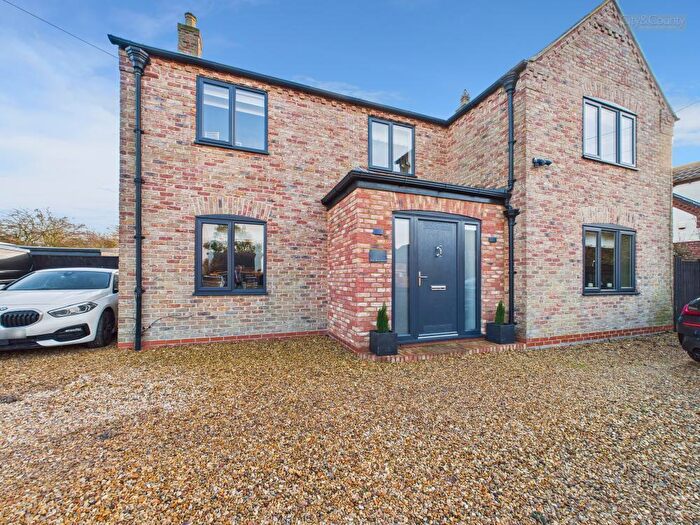
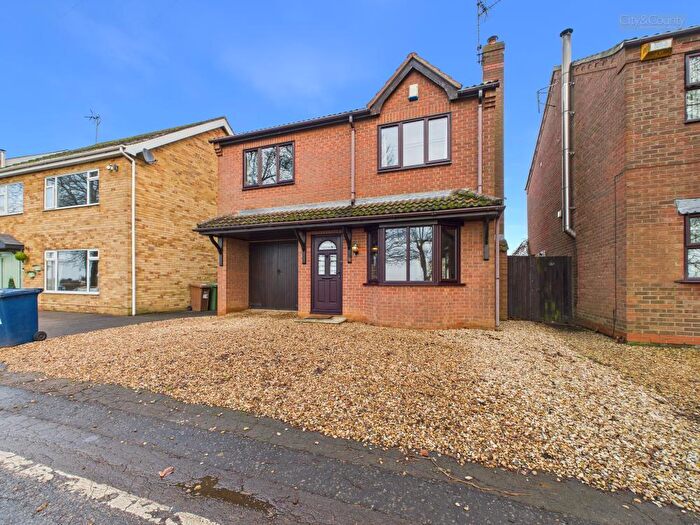
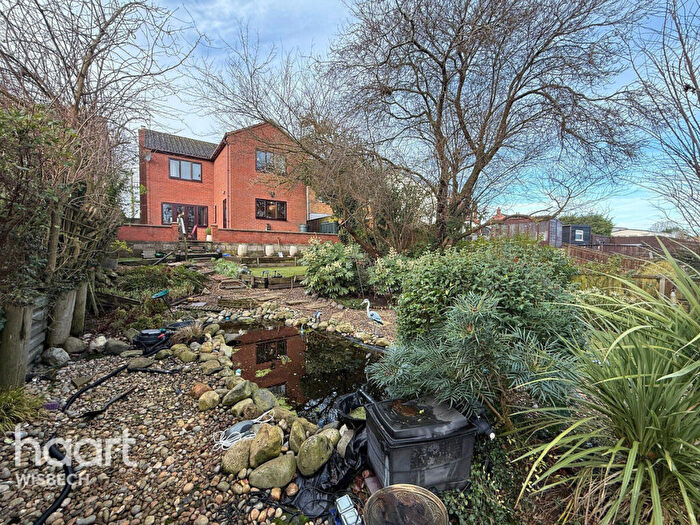
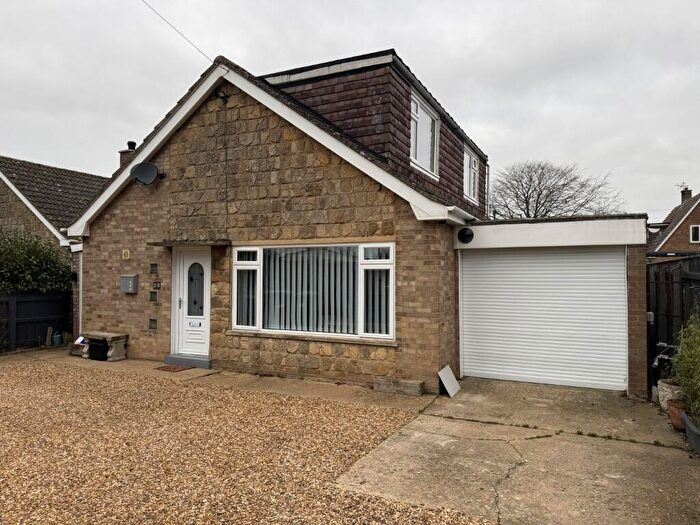
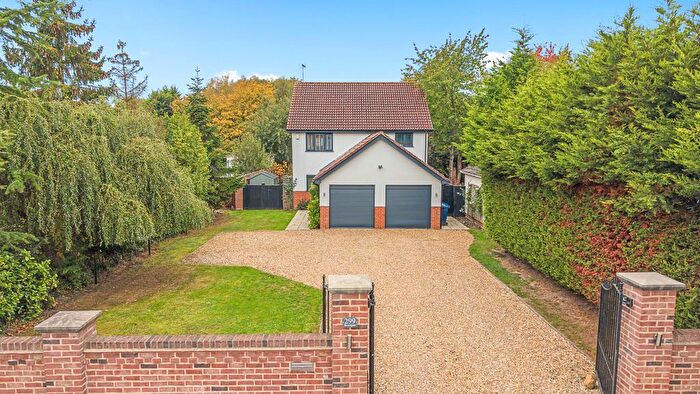
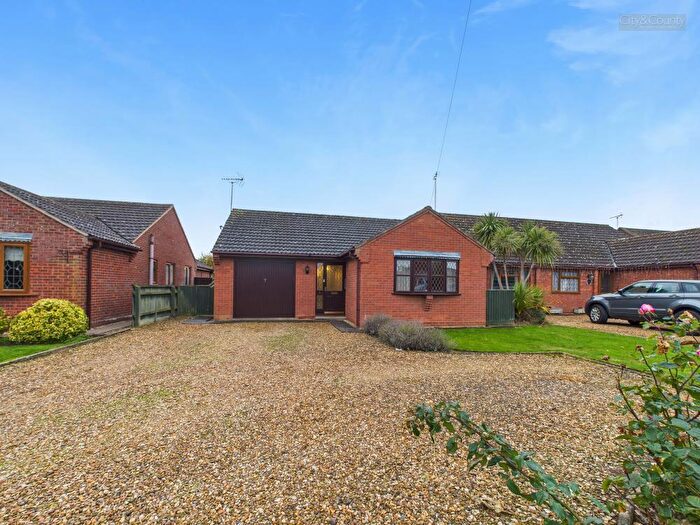
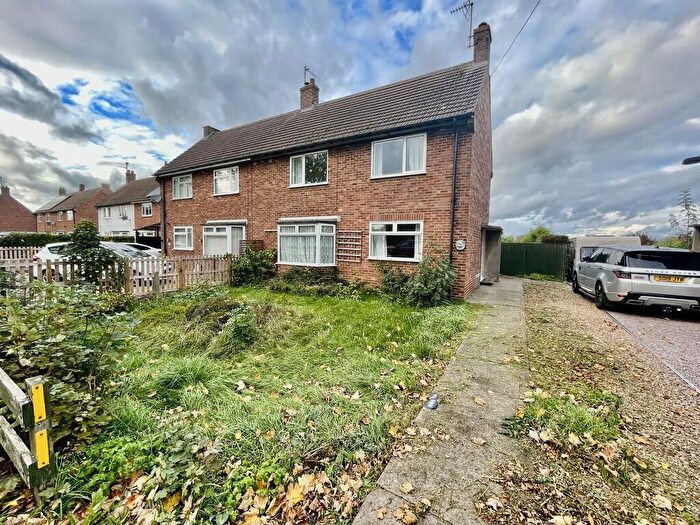
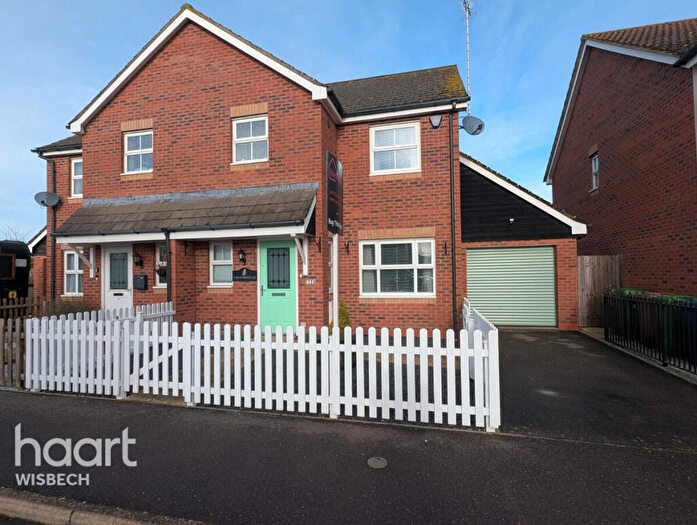
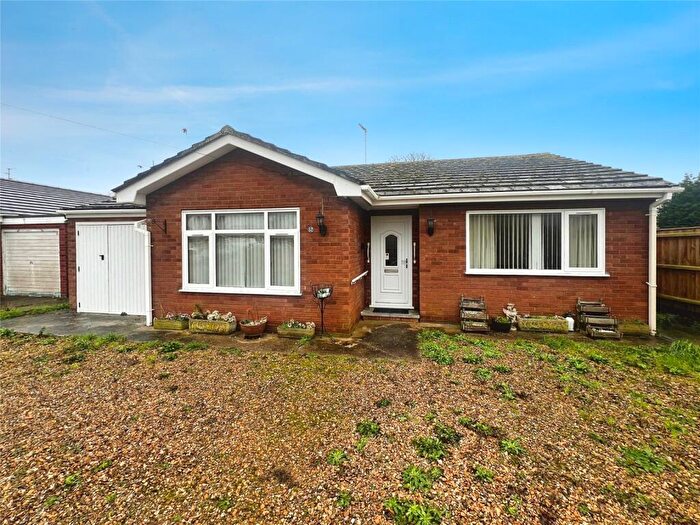
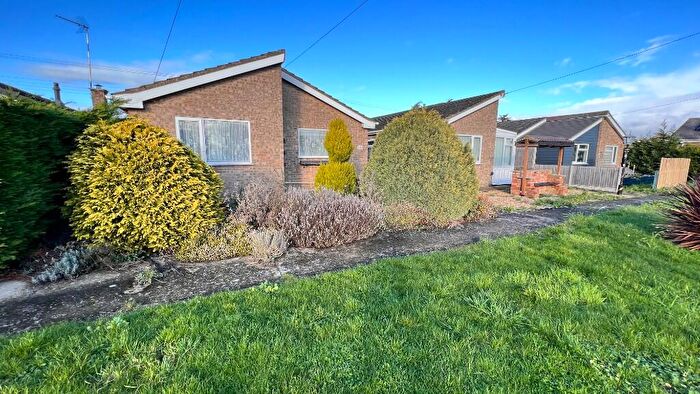
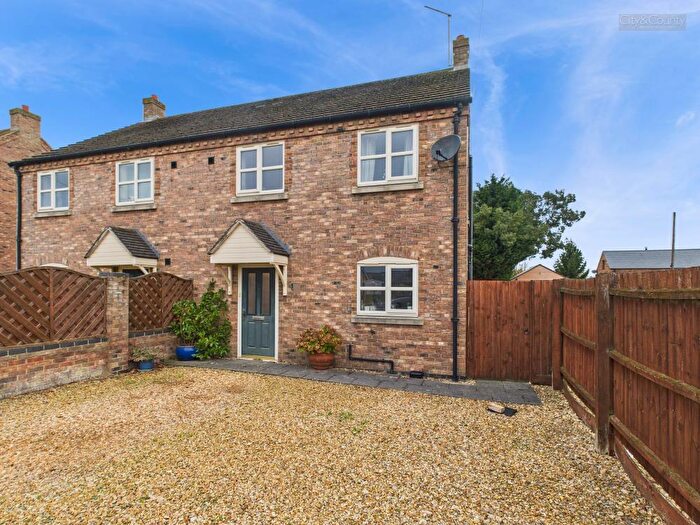
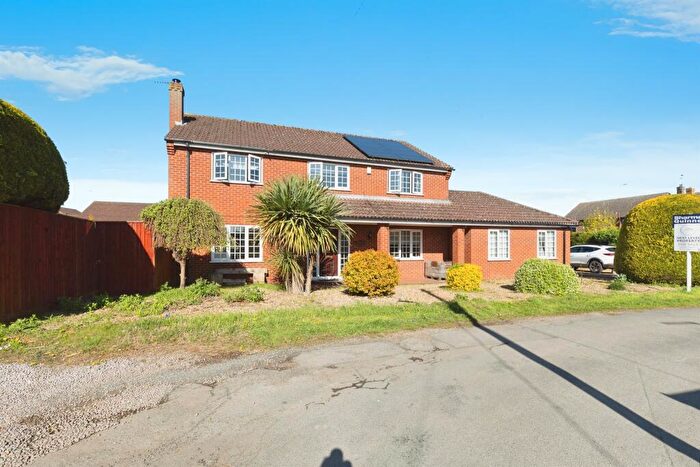
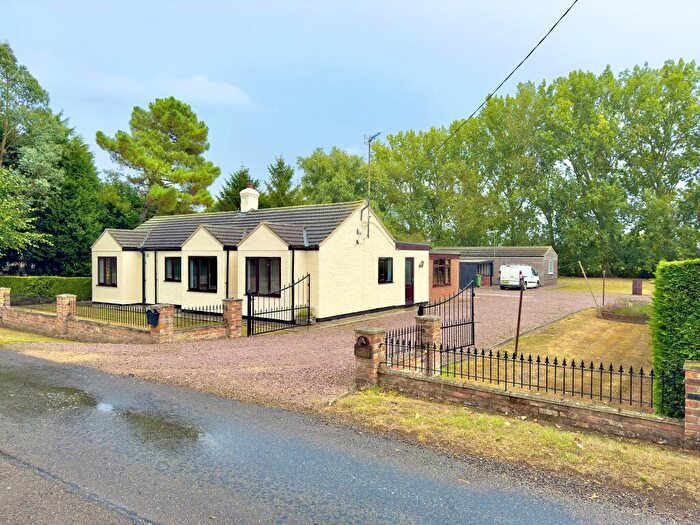
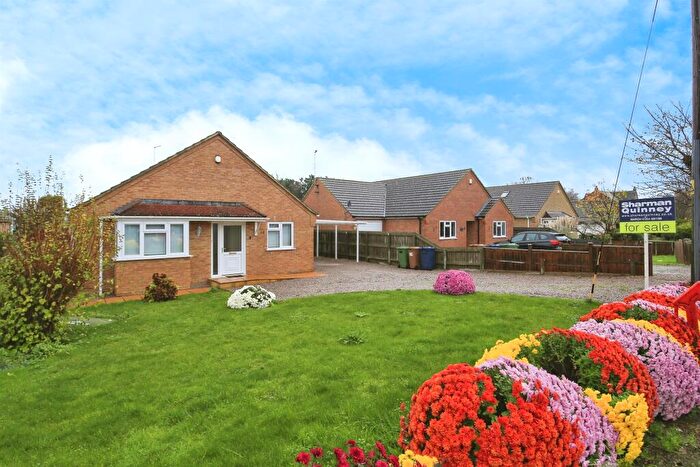
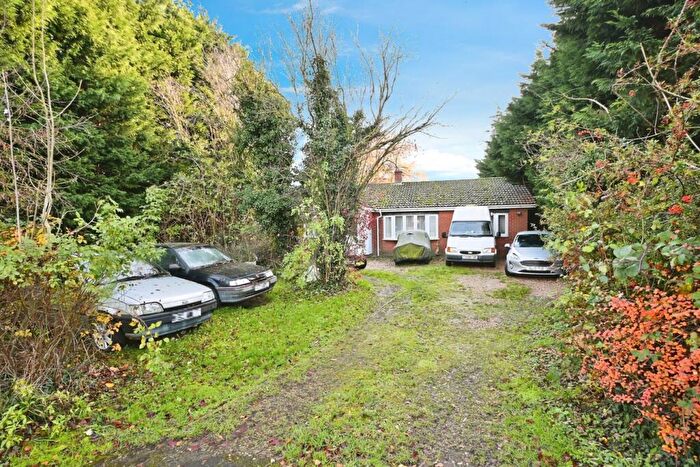
Properties for sale in The Saints
Roads and Postcodes in The Saints
Navigate through our locations to find the location of your next house in The Saints, Spalding for sale or to rent.
| Streets | Postcodes |
|---|---|
| Appleby Manor Close | PE12 0JQ |
| Badgate Road | PE12 0JP |
| Barlings Drove | PE12 0JN |
| Baulkins Drove | PE12 0JU PE12 0JX |
| Bells Drove | PE12 0JG |
| Bette Camplings Close | PE12 0ED |
| Birds Drove | PE12 0JY PE12 0LA PE12 0JZ |
| Broadgate | PE12 0EL PE12 0JS PE12 0JT PE12 0LR PE12 0LT |
| Broadgate Road | PE12 0HD PE12 0JF |
| Chapelgate | PE12 0EE PE12 0EF |
| Childersgate | PE12 0HX |
| Clough Cross | PE13 4JF |
| Commons Road | PE12 0RA |
| Coronation Avenue | PE12 0QT |
| Cross Road | PE12 0LS |
| Dog Drove | PE12 0HA |
| Draw Dyke | PE12 0HW |
| Fen Dyke | PE12 0JW PE12 0LQ |
| Festival Square | PE12 0EH PE12 0EQ |
| Fishergate | PE12 0EN PE12 0EZ |
| French Drove | PE12 0NR |
| Goochgate | PE12 0HF |
| Guanockgate | PE12 0LW |
| Guanockgate Road | PE12 0LU |
| Hallgate Road | PE12 0LN PE12 0QS |
| Highstock Lane | PE12 0QG PE12 0QQ |
| Hillgate | PE12 0NN PE12 0NW |
| Horse Moor Drove | PE12 0EX PE12 0EY |
| Huberts Close | PE12 0NJ |
| Inley Drove | PE12 0LX |
| Jarvis Gate | PE12 0EP |
| Jubilee Close | PE12 0ES |
| Lincolns Avenue | PE12 0PJ PE12 0PQ |
| Lutton Gate | PE12 0QH |
| Lutton Gate Road | PE12 0QJ |
| Luttongate | PE12 0LH PE12 0LJ |
| Masterdyke | PE12 0JE |
| Mill Lane | PE12 0EJ PE12 0PW |
| Mole Drove | PE12 0PA PE12 0PB |
| Needham Drive | PE12 0EG |
| North Road | PE12 0NL PE12 0NS PE12 0NU PE12 0NX |
| Old Fendyke | PE12 0HE PE12 0JR |
| Sandygate | PE12 0HG |
| South Eau Bank | PE12 0QL PE12 0QW PE12 0QN |
| Station Road | PE12 0NP |
| Sutton Gate | PE12 0EW |
| Sutton Road | PE12 0HS PE12 0HT PE12 0HU |
| Sycamore View | PE12 0NQ |
| Tydd Road | PE12 0HP |
| West Drove North | PE12 0NT PE12 0PL |
| West Drove South | PE12 0PN |
| PE12 0QP PE12 0QR |
Transport near The Saints
- FAQ
- Price Paid By Year
- Property Type Price
Frequently asked questions about The Saints
What is the average price for a property for sale in The Saints?
The average price for a property for sale in The Saints is £326,422. This amount is 34% higher than the average price in Spalding. There are 1,083 property listings for sale in The Saints.
What streets have the most expensive properties for sale in The Saints?
The streets with the most expensive properties for sale in The Saints are Guanockgate Road at an average of £670,000, West Drove South at an average of £580,750 and Highstock Lane at an average of £468,916.
What streets have the most affordable properties for sale in The Saints?
The streets with the most affordable properties for sale in The Saints are Baulkins Drove at an average of £161,166, West Drove North at an average of £178,750 and Coronation Avenue at an average of £186,750.
Which train stations are available in or near The Saints?
Some of the train stations available in or near The Saints are Spalding, March and Whittlesea.
Property Price Paid in The Saints by Year
The average sold property price by year was:
| Year | Average Sold Price | Price Change |
Sold Properties
|
|---|---|---|---|
| 2025 | £357,904 | 23% |
21 Properties |
| 2024 | £276,285 | -28% |
32 Properties |
| 2023 | £352,625 | -2% |
36 Properties |
| 2022 | £359,118 | 11% |
57 Properties |
| 2021 | £318,761 | 16% |
78 Properties |
| 2020 | £267,758 | -5% |
50 Properties |
| 2019 | £281,317 | 23% |
41 Properties |
| 2018 | £217,115 | -3% |
39 Properties |
| 2017 | £223,257 | 1% |
35 Properties |
| 2016 | £221,937 | 16% |
49 Properties |
| 2015 | £187,126 | 2% |
48 Properties |
| 2014 | £183,689 | 7% |
50 Properties |
| 2013 | £171,312 | -5% |
27 Properties |
| 2012 | £180,535 | -0,2% |
27 Properties |
| 2011 | £180,825 | 1% |
25 Properties |
| 2010 | £178,723 | -4% |
24 Properties |
| 2009 | £185,114 | -10% |
28 Properties |
| 2008 | £202,864 | 5% |
26 Properties |
| 2007 | £192,500 | 5% |
48 Properties |
| 2006 | £182,157 | 3% |
69 Properties |
| 2005 | £176,140 | 17% |
53 Properties |
| 2004 | £146,206 | -11% |
47 Properties |
| 2003 | £162,504 | 30% |
69 Properties |
| 2002 | £113,859 | 7% |
69 Properties |
| 2001 | £106,244 | 20% |
57 Properties |
| 2000 | £84,696 | 22% |
51 Properties |
| 1999 | £65,917 | -1% |
41 Properties |
| 1998 | £66,827 | 19% |
36 Properties |
| 1997 | £53,956 | 2% |
62 Properties |
| 1996 | £52,833 | 6% |
39 Properties |
| 1995 | £49,406 | - |
22 Properties |
Property Price per Property Type in The Saints
Here you can find historic sold price data in order to help with your property search.
The average Property Paid Price for specific property types in the last three years are:
| Property Type | Average Sold Price | Sold Properties |
|---|---|---|
| Semi Detached House | £216,733.00 | 15 Semi Detached Houses |
| Detached House | £350,693.00 | 73 Detached Houses |
| Terraced House | £200,000.00 | 1 Terraced House |

