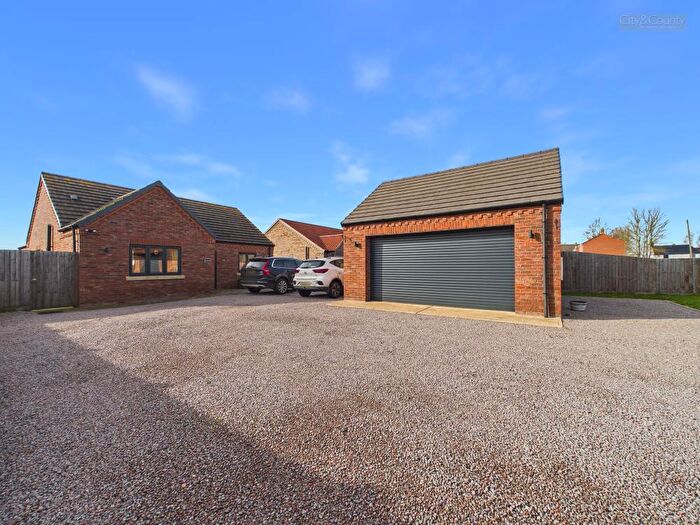
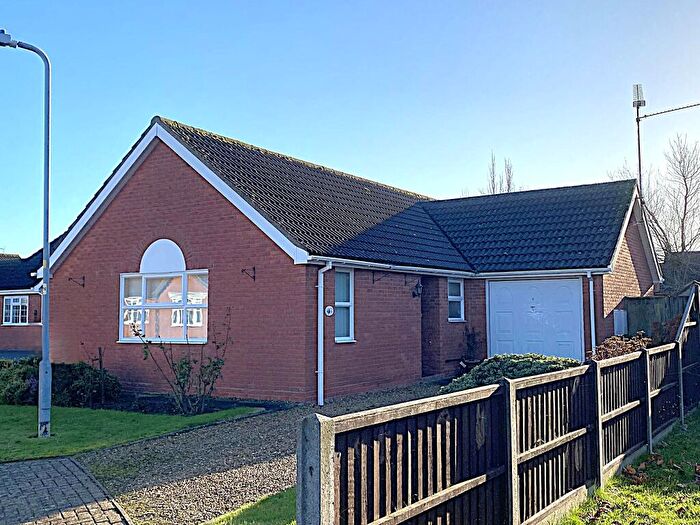
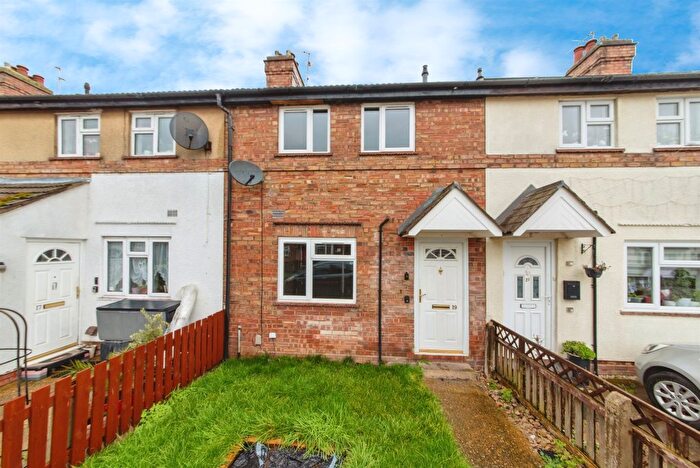
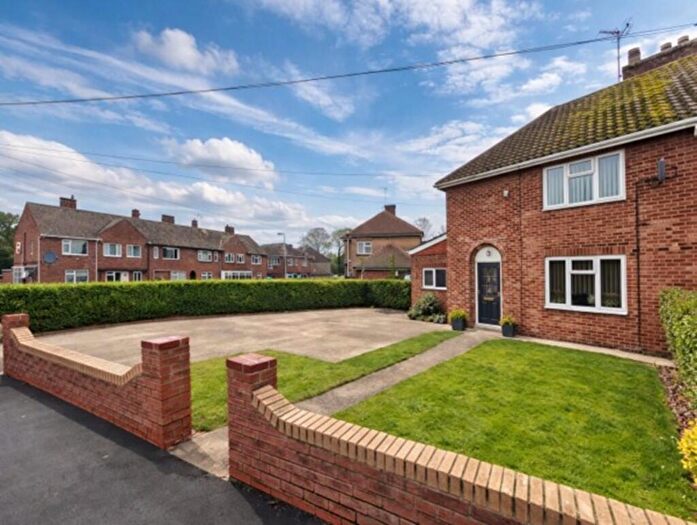
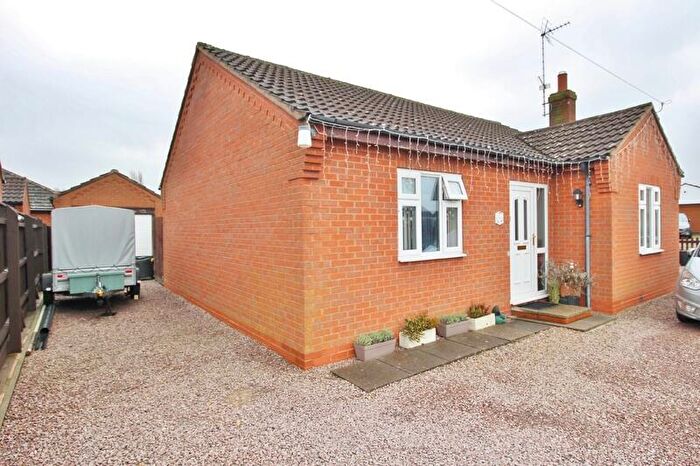
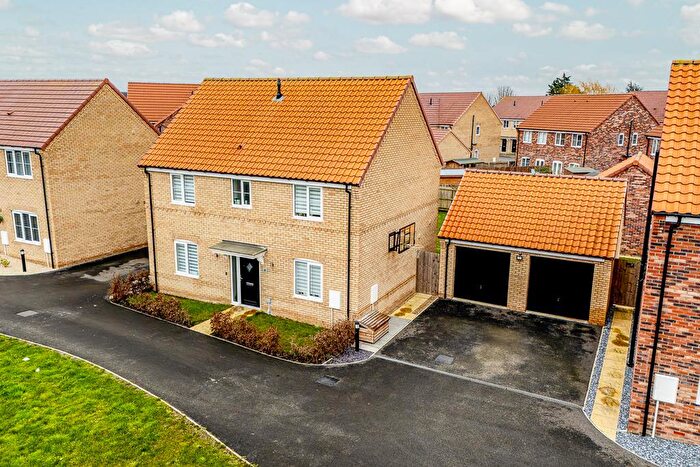
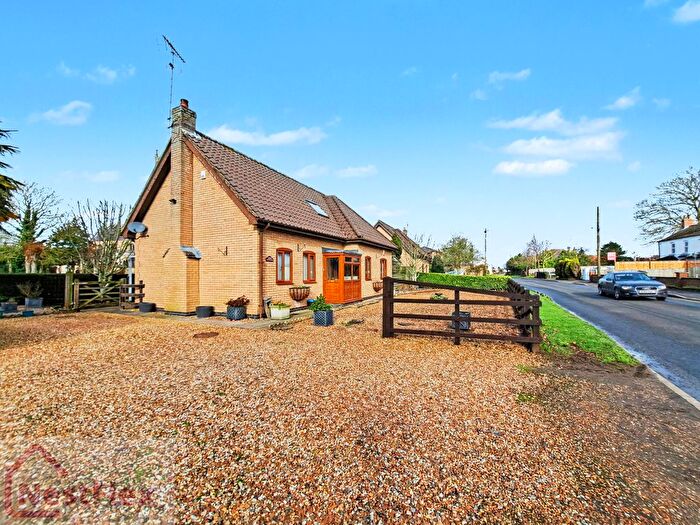
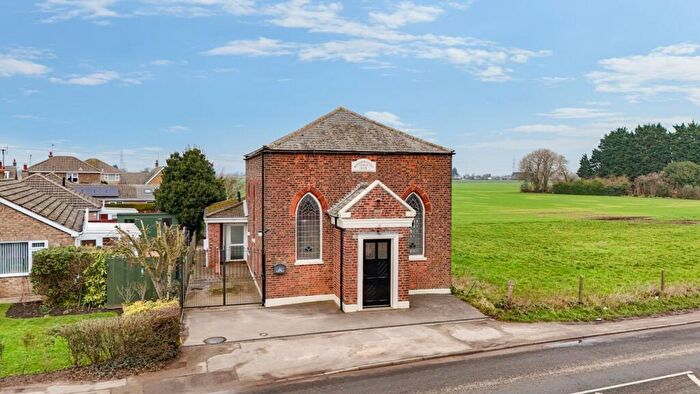
Houses for sale & to rent in Whaplode And Holbeach St Johns, Spalding
House Prices in Whaplode And Holbeach St Johns
Properties in Whaplode And Holbeach St Johns have an average house price of £302,284.62 and had 180 Property Transactions within the last 3 years¹.
Whaplode And Holbeach St Johns is an area in Spalding, Lincolnshire with 1,697 households², where the most expensive property was sold for £735,000.00.
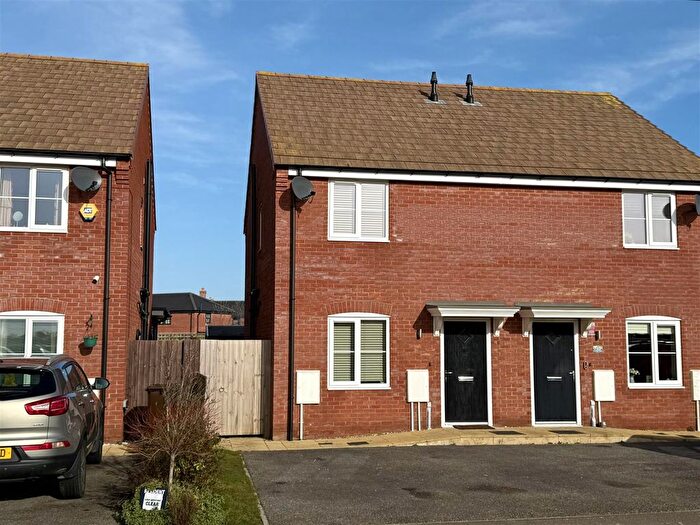
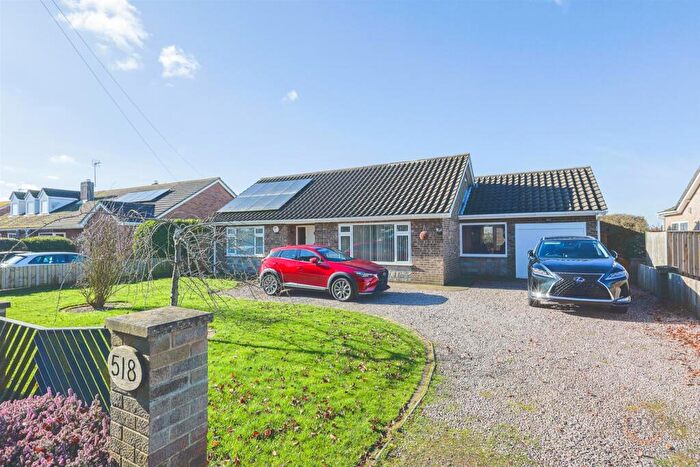
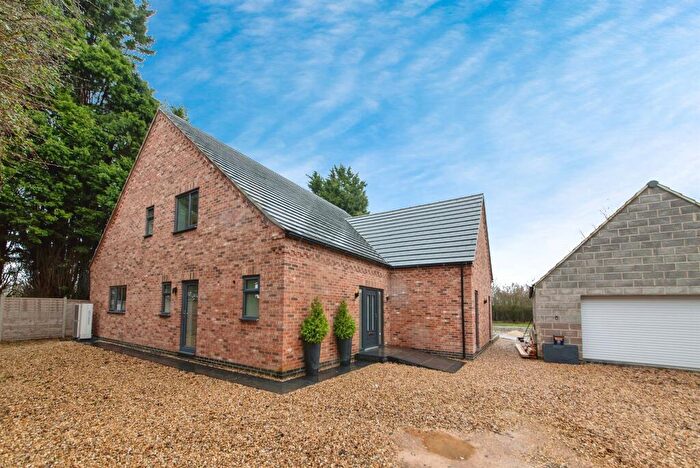
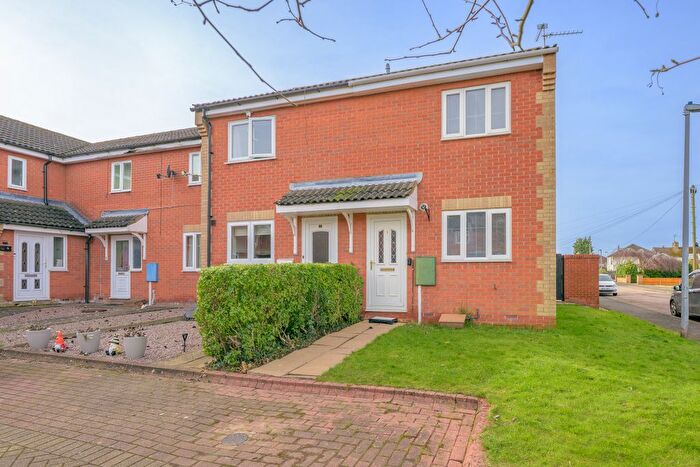
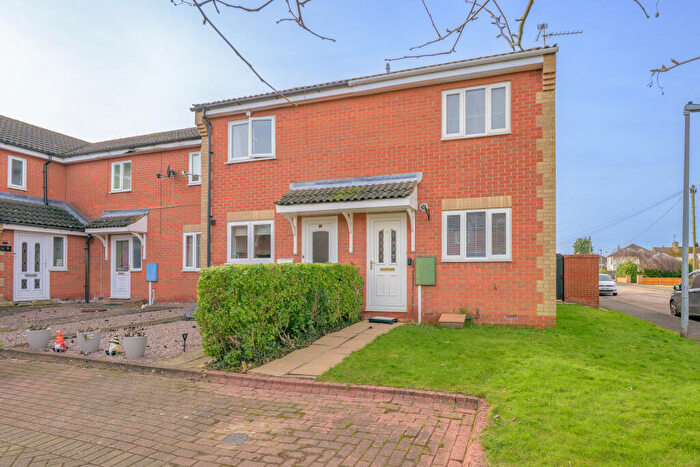
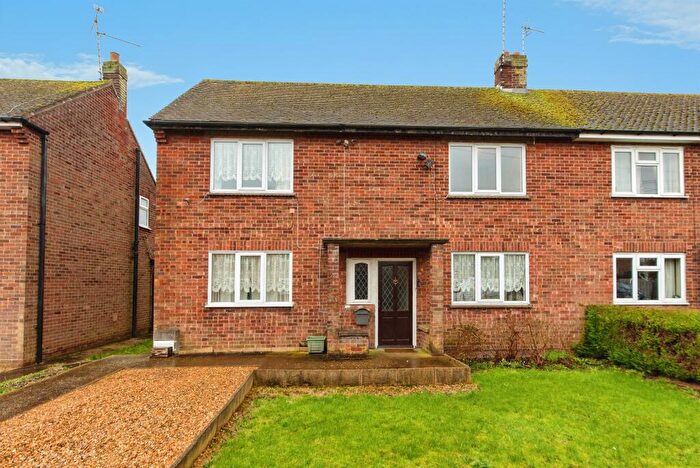
Properties for sale in Whaplode And Holbeach St Johns
Roads and Postcodes in Whaplode And Holbeach St Johns
Navigate through our locations to find the location of your next house in Whaplode And Holbeach St Johns, Spalding for sale or to rent.
| Streets | Postcodes |
|---|---|
| Abbotts Gardens | PE12 6SZ |
| Back Bank | PE12 0TT |
| Biggadike Court | PE12 6FU |
| Broad Lane | PE12 8BG |
| Broadgate | PE12 0TN PE12 0TW |
| Bush Meadow Lane | PE12 6FP |
| Buttercup Paddock | PE12 6UX |
| Campbell Place | PE12 0PU |
| Chapel Drove | PE12 0PT |
| Chapel Gardens | PE12 6UG |
| Chapel Gate | PE12 0TR |
| Chapel Hill Road | PE12 0SJ |
| Church Gate | PE12 6TA |
| Cobgate | PE12 6RP PE12 6TD PE12 6UL |
| Cobgate Close | PE12 6SX |
| Coopers Close | PE12 0TL |
| Craggs Hill | PE12 6UD |
| Cranesgate | PE12 8RJ |
| Cranesgate North | PE12 6SR PE12 6ST PE12 6TY |
| Cranesgate South | PE12 6SN |
| Cross Street | PE12 6TF |
| Crowdyke Gate | PE12 6FT |
| Damgate Road | PE12 8QL |
| Dog Drove North | PE12 0RZ PE12 0SA |
| Dog Drove South | PE12 0SD |
| Dowsdale Bank | PE12 0TX PE12 0TZ PE12 0UA |
| Drove Road | PE12 0TU |
| East Gate | PE12 6TT |
| Farrow Road | PE12 0TS |
| Fen Road | PE12 8QD PE12 8QF |
| Fieldview Close | PE12 6GS |
| Fox Heading Lane | PE12 8RH |
| Francklin Walk | PE12 6UN |
| Frogs Abbey Gate | PE12 8QJ |
| Further Old Gate | PE12 8QE |
| Golden Harvest Way | PE12 6UU |
| Green Bank | PE12 0SH |
| Green Pastures | PE12 6FJ |
| Gypsy Lane | PE12 0UQ |
| Gyrwas Grove | PE12 6GQ |
| Hagbeach Drove | PE12 0SW |
| Hagbeach Gate | PE12 6TU |
| High Road | PE12 6TG PE12 6TJ PE12 6TX PE12 6UA PE12 6NT PE12 6TL |
| Hitherhold Gate | PE12 7JG |
| Hockley Lane | PE12 6TH |
| Holbeach Drove Gate | PE12 0PX PE12 0RX |
| Holland Bank | PE12 0ST |
| Hurdletree Bank | PE12 6SA PE12 6SB PE12 6SS PE12 8QQ |
| Irby Crescent | PE12 6TR |
| Jekils Bank | PE12 0SX PE12 0SY PE12 8RF PE12 8RG |
| Kirk Gate | PE12 6TE |
| Little Dog Drove | PE12 8RR |
| Little Lane | PE12 6RU |
| Main Road | PE12 0PS PE12 0SB PE12 0TP PE12 0SE |
| Malten Lane | PE12 6TN PE12 6UH |
| Masham Close | PE12 0FY |
| Middle Marsh Road | PE12 8QH |
| Middle Road | PE12 6TW |
| Mill Lane | PE12 6SU PE12 6TP PE12 6TS |
| Millers Rest | PE12 6UT |
| Millgate | PE12 6RR PE12 6RT PE12 6RY PE12 6SD PE12 6SF |
| Narrow Lane | PE12 6SJ |
| Naylors Nook | PE12 8TB |
| New River Gate | PE12 0RY |
| Nutts Lane | PE12 8RP |
| Orchard Close | PE12 8AR |
| Oxcroft Bank | PE12 0TY |
| Parsons Lane | PE12 0GB |
| Pear Tree Hill Road | PE12 0SL |
| Pipwell Gate | PE12 8BA |
| Pipwell Meadows | PE12 8TA |
| Quick Lane | PE12 0SU |
| Randall Bank | PE12 0RT PE12 0WF |
| Ravens Bank | PE12 6SG PE12 6SH PE12 8RW PE12 8SP |
| Ravensgate | PE12 8RD |
| Roman Bank | PE12 8AS PE12 8BB |
| Rose Crescent | PE12 6SP |
| Saltney Gate | PE12 8AT |
| Sandringham Close | PE12 6UP |
| Sholts Gate | PE12 6TZ |
| Snaffers Lane | PE12 6RX |
| Spalding Gate | PE12 6UF |
| St Johns Road | PE12 8RA |
| St Marys Gardens | PE12 6SY |
| St Polycarps Drive | PE12 0SF |
| Stockwell Gate | PE12 6UE PE12 8AU |
| Stockwell Gate North | PE12 6WH |
| Stockwell Gate West | PE12 6WG |
| Stotons Gate | PE12 8SB |
| Strongs Bank | PE12 8QN |
| Swepstone Way | PE12 8AN |
| Sycamore Close | PE12 6TB |
| The Common | PE12 0UE PE12 0UF PE12 0UD |
| The Tilney | PE12 6UW |
| Thorpes Lane | PE12 6RS |
| Tulip Fields | PE12 6US |
| Turnpike Road | PE12 6GE |
| Verdant Drive | PE12 6UJ |
| Vicarage Close | PE12 8RS |
| Wallis Gate | PE12 6UB |
| Washway Road | PE12 8AL PE12 8AY PE12 8AZ |
| Welch Close | PE12 6FZ |
| Wesley Road | PE12 6UR |
| Whale Drove | PE12 0UB |
| Wheatfields | PE12 6FH |
| PE12 6TQ PE12 8RQ PE12 8SU |
Transport near Whaplode And Holbeach St Johns
- FAQ
- Price Paid By Year
- Property Type Price
Frequently asked questions about Whaplode And Holbeach St Johns
What is the average price for a property for sale in Whaplode And Holbeach St Johns?
The average price for a property for sale in Whaplode And Holbeach St Johns is £302,285. This amount is 25% higher than the average price in Spalding. There are 3,394 property listings for sale in Whaplode And Holbeach St Johns.
What streets have the most expensive properties for sale in Whaplode And Holbeach St Johns?
The streets with the most expensive properties for sale in Whaplode And Holbeach St Johns are Spalding Gate at an average of £735,000, Wallis Gate at an average of £575,000 and Gypsy Lane at an average of £570,000.
What streets have the most affordable properties for sale in Whaplode And Holbeach St Johns?
The streets with the most affordable properties for sale in Whaplode And Holbeach St Johns are Kirk Gate at an average of £165,000, Sholts Gate at an average of £165,000 and Welch Close at an average of £167,433.
Which train stations are available in or near Whaplode And Holbeach St Johns?
Some of the train stations available in or near Whaplode And Holbeach St Johns are Spalding, Boston and Hubberts Bridge.
Property Price Paid in Whaplode And Holbeach St Johns by Year
The average sold property price by year was:
| Year | Average Sold Price | Price Change |
Sold Properties
|
|---|---|---|---|
| 2025 | £294,055.63 | -9% |
43 Properties |
| 2024 | £320,282.01 | 9% |
67 Properties |
| 2023 | £290,113.5 | -8% |
70 Properties |
| 2022 | £313,813.76 | 10% |
72 Properties |
| 2021 | £283,232.7 | 11% |
90 Properties |
| 2020 | £253,110.89 | -1% |
73 Properties |
| 2019 | £254,588.85 | 1% |
61 Properties |
| 2018 | £250,894.45 | 15% |
82 Properties |
| 2017 | £212,938.68 | 7% |
80 Properties |
| 2016 | £198,599.81 | 5% |
81 Properties |
| 2015 | £189,228.73 | 7% |
71 Properties |
| 2014 | £175,294.84 | 0,1% |
92 Properties |
| 2013 | £175,097.99 | 3% |
77 Properties |
| 2012 | £170,221.84 | 4% |
45 Properties |
| 2011 | £162,844 | 0,1% |
39 Properties |
| 2010 | £162,717 | 16% |
48 Properties |
| 2009 | £136,117 | -22% |
52 Properties |
| 2008 | £165,397 | -8% |
35 Properties |
| 2007 | £178,939.53 | -1% |
81 Properties |
| 2006 | £180,463.72 | 2% |
82 Properties |
| 2005 | £176,968 | 11% |
73 Properties |
| 2004 | £156,709 | 15% |
103 Properties |
| 2003 | £133,050 | 15% |
99 Properties |
| 2002 | £112,966.24 | 16% |
109 Properties |
| 2001 | £94,493.07 | 10% |
90 Properties |
| 2000 | £85,246 | 10% |
83 Properties |
| 1999 | £76,332.45 | 21% |
96 Properties |
| 1998 | £60,569 | 5% |
85 Properties |
| 1997 | £57,311 | 10% |
81 Properties |
| 1996 | £51,360 | -11% |
64 Properties |
| 1995 | £56,820.89 | - |
62 Properties |
Property Price per Property Type in Whaplode And Holbeach St Johns
Here you can find historic sold price data in order to help with your property search.
The average Property Paid Price for specific property types in the last three years are:
| Property Type | Average Sold Price | Sold Properties |
|---|---|---|
| Semi Detached House | £203,725.48 | 31 Semi Detached Houses |
| Detached House | £328,425.64 | 144 Detached Houses |
| Terraced House | £160,490.00 | 5 Terraced Houses |

