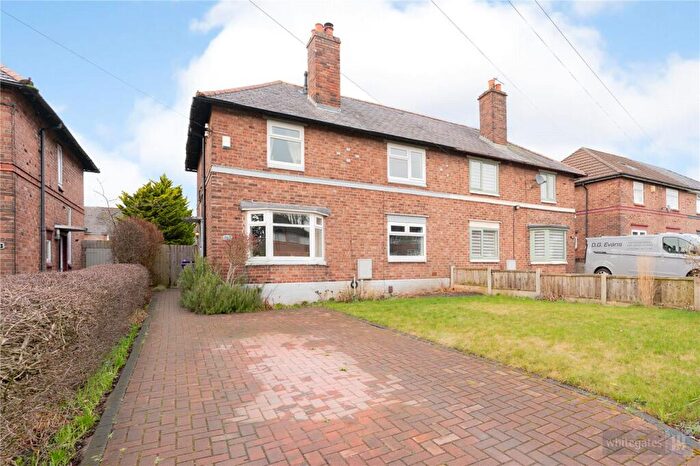
Houses for sale & to rent in Liverpool, England
House Prices in Liverpool
Properties in Liverpool have
an average house price of
£188,509.00
and had 16,674 Property Transactions
within the last 3 years.¹
Liverpool is a location in
England with
206,135 households², where the most expensive property was sold for £3,971,025.00.
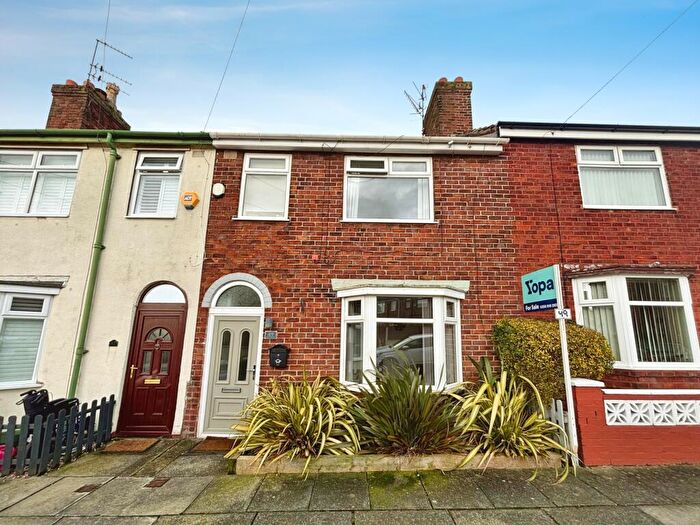
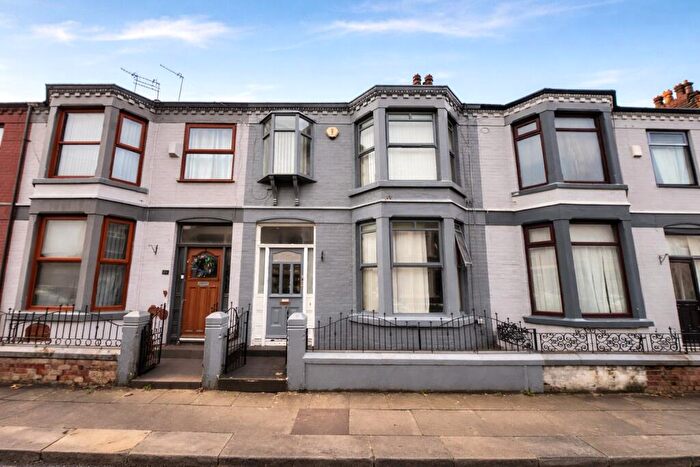
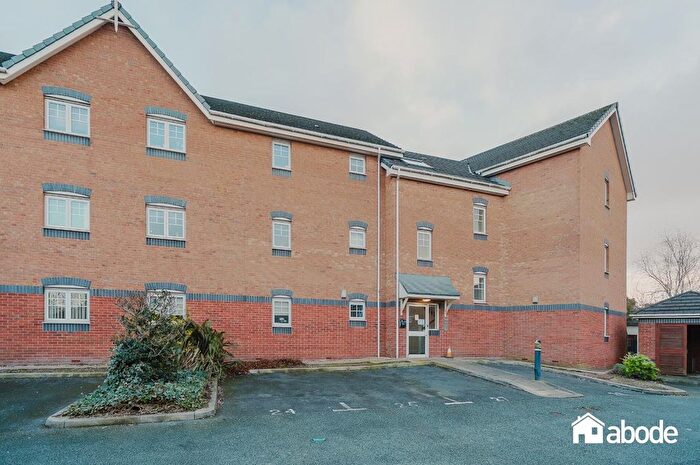
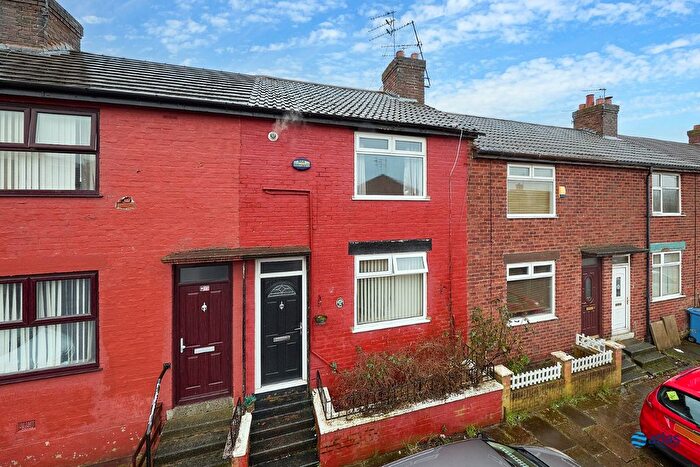
Properties for sale in Liverpool
Towns in Liverpool
Navigate through our locations to find the location of your next house in Liverpool, England for sale or to rent.
Transport in Liverpool
Please see below transportation links in this area:
-
Wavertree Technology Park Station
-
Edge Hill Station
-
Broad Green Station
-
Liverpool Lime Street Station
-
Liverpool Central Station
-
Mossley Hill Station
-
St.Michaels Station
-
Moorfields Station
-
Brunswick Station
-
Liverpool James Street Station
- FAQ
- Price Paid By Year
- Property Type Price
Frequently asked questions about Liverpool
What is the average price for a property for sale in Liverpool?
The average price for a property for sale in Liverpool is £188,509. This amount is 47% lower than the average price in England. There are more than 10,000 property listings for sale in Liverpool.
What locations have the most expensive properties for sale in Liverpool?
The location with the most expensive properties for sale in Liverpool is Liverpool at an average of £188,515.
What locations have the most affordable properties for sale in Liverpool?
The location with the most affordable properties for sale in Liverpool is Bootle at an average of £90,000.
Which train stations are available in or near Liverpool?
Some of the train stations available in or near Liverpool are Wavertree Technology Park, Edge Hill and Broad Green.
Property Price Paid in Liverpool by Year
The average sold property price by year was:
| Year | Average Sold Price | Price Change |
Sold Properties
|
|---|---|---|---|
| 2025 | £199,121 | 7% |
4,557 Properties |
| 2024 | £185,036 | 1% |
6,180 Properties |
| 2023 | £183,979 | 2% |
5,937 Properties |
| 2022 | £179,675 | 2% |
7,128 Properties |
| 2021 | £176,356 | 12% |
8,025 Properties |
| 2020 | £155,413 | 8% |
6,156 Properties |
| 2019 | £143,013 | 1% |
8,511 Properties |
| 2018 | £142,234 | 1% |
8,875 Properties |
| 2017 | £140,922 | 5% |
8,326 Properties |
| 2016 | £133,496 | -2% |
7,624 Properties |
| 2015 | £136,399 | 5% |
6,729 Properties |
| 2014 | £129,887 | 5% |
6,141 Properties |
| 2013 | £123,485 | -3% |
4,899 Properties |
| 2012 | £127,006 | -1% |
3,493 Properties |
| 2011 | £127,807 | -2% |
3,677 Properties |
| 2010 | £130,413 | -3% |
3,723 Properties |
| 2009 | £134,057 | 3% |
3,309 Properties |
| 2008 | £130,519 | -4% |
5,234 Properties |
| 2007 | £136,324 | 4% |
9,258 Properties |
| 2006 | £130,878 | 9% |
9,345 Properties |
| 2005 | £119,338 | 10% |
7,774 Properties |
| 2004 | £107,298 | 22% |
9,647 Properties |
| 2003 | £84,041 | 17% |
10,306 Properties |
| 2002 | £69,638 | 9% |
8,588 Properties |
| 2001 | £63,547 | 11% |
7,052 Properties |
| 2000 | £56,783 | 8% |
6,783 Properties |
| 1999 | £52,397 | 9% |
6,362 Properties |
| 1998 | £47,493 | 2% |
6,274 Properties |
| 1997 | £46,352 | 1% |
5,975 Properties |
| 1996 | £45,933 | 6% |
5,761 Properties |
| 1995 | £43,269 | - |
5,531 Properties |
Property Price per Property Type in Liverpool
Here you can find historic sold price data in order to help with your property search.
The average Property Paid Price for specific property types in the last three years are:
| Property Type | Average Sold Price | Sold Properties |
|---|---|---|
| Semi Detached House | £246,866.00 | 3,857 Semi Detached Houses |
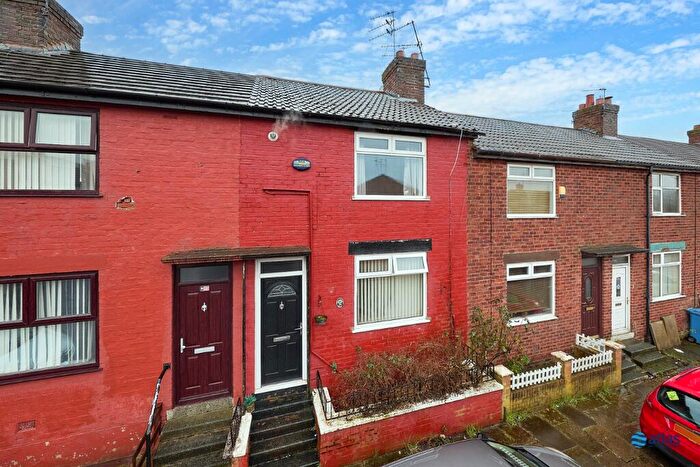
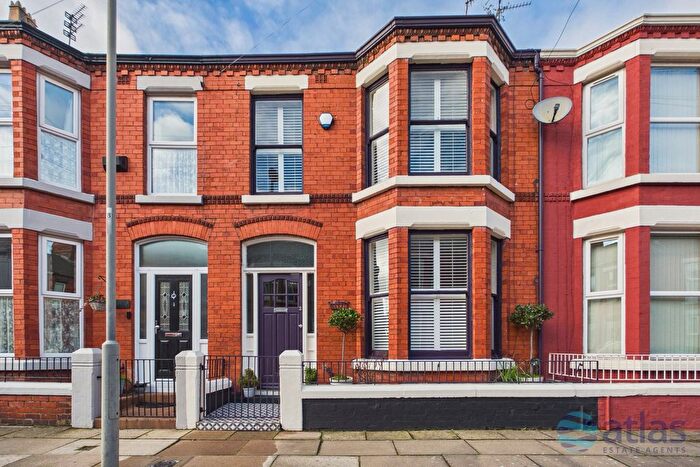
| Terraced House | £151,750.00 | 8,552 Terraced Houses |
| Detached House | £410,707.00 | 949 Detached Houses |
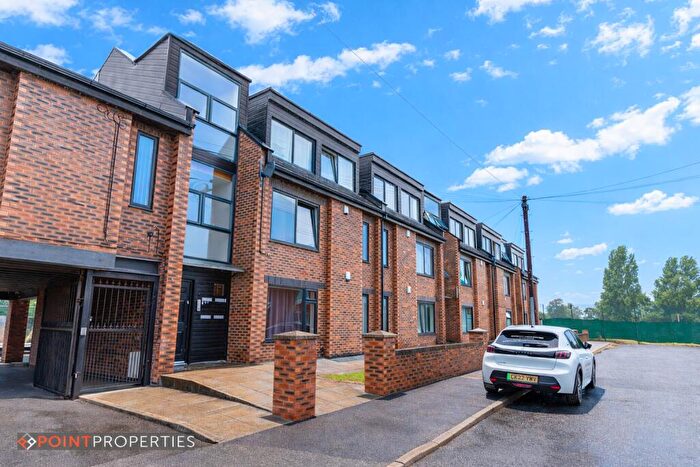
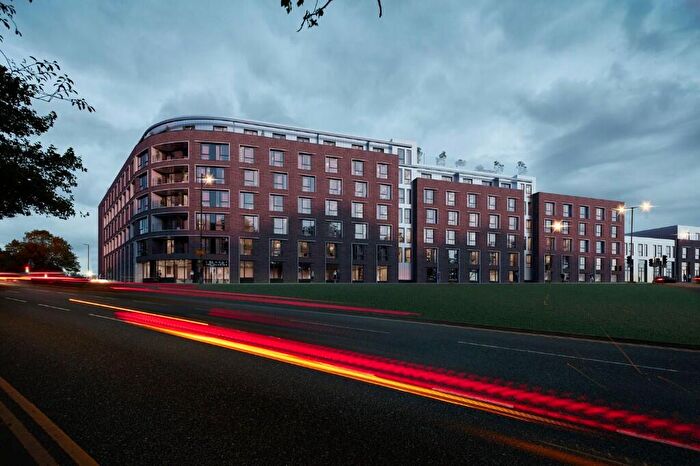
| Flat | £151,841.00 | 3,316 Flats |

