
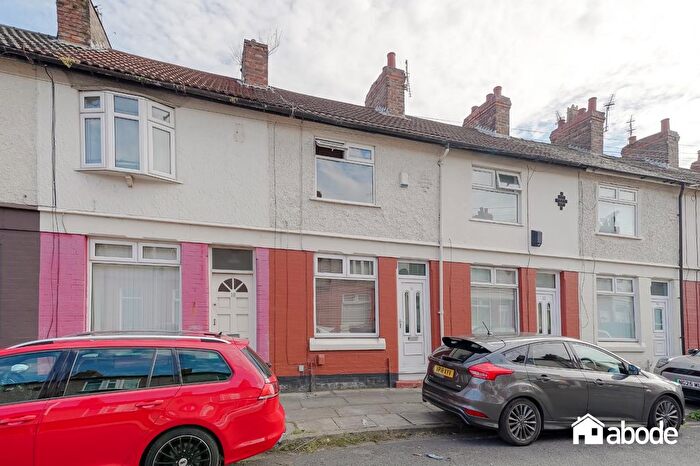
Houses for sale in Liverpool, Liverpool
House Prices in Liverpool
Properties in Liverpool have an average house price of £190k and had 18,002 Property Transactions within the last 3 years.¹
Liverpool is an area in Liverpool with 209,475 households², where the most expensive property was sold for £3.97M.
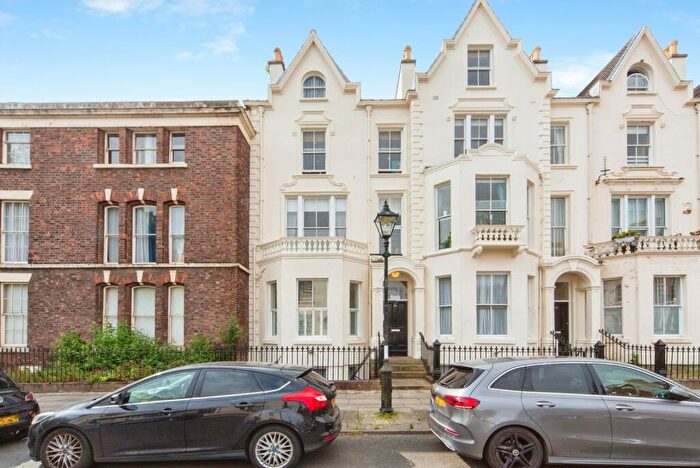
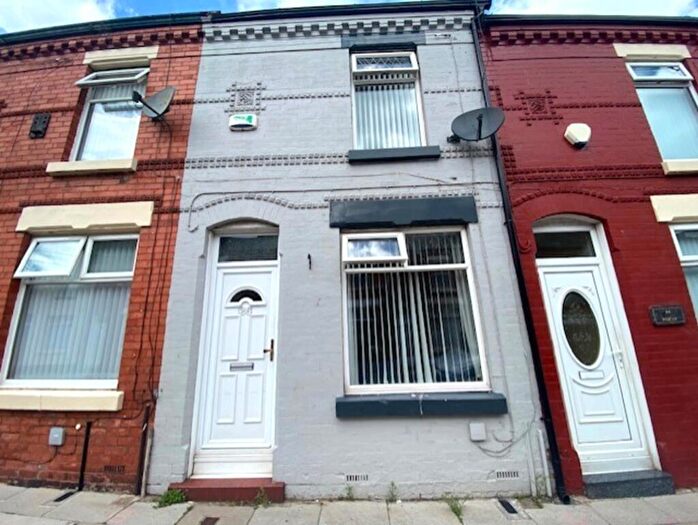
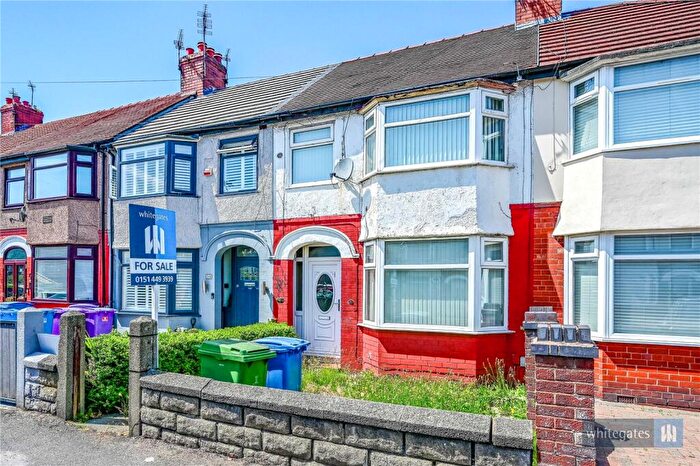
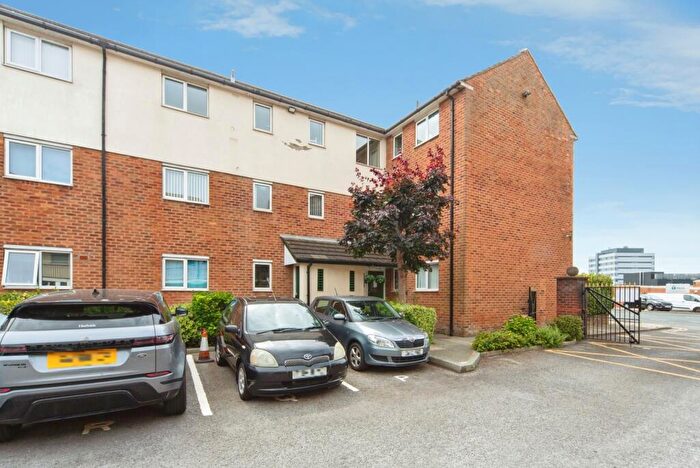
Properties for sale in Liverpool
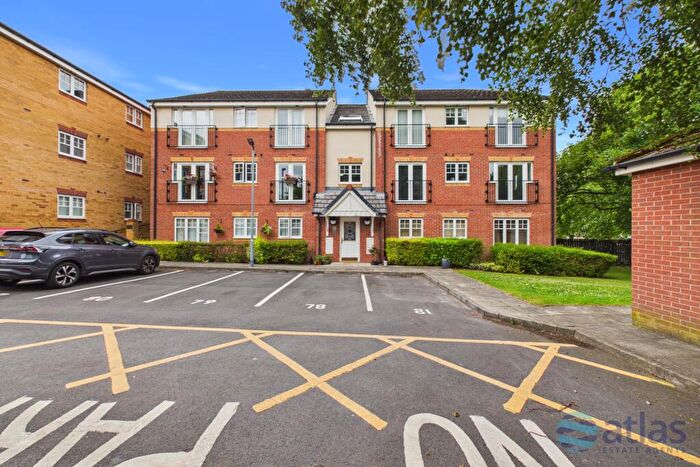
![]()
If you are looking to sell your house, let it out, or receive a property valuation, an expert can help you.
Click the button below to get started.

Neighbourhoods in Liverpool
Navigate through our locations to find the location of your next house in Liverpool, Liverpool for sale or to rent.
- Allerton And Hunts Cross
- Anfield
- Belle Vale
- Central
- Childwall
- Church
- Clubmoor
- County
- Cressington
- Croxteth
- Everton
- Fazakerley
- Greenbank
- Kensington And Fairfield
- Kirkdale
- Knotty Ash
- Mossley Hill
- Norris Green
- Old Swan
- Picton
- Princes Park
- Riverside
- Speke-garston
- St Michaels
- Tuebrook And Stoneycroft
- Warbreck
- Wavertree
- West Derby
- Woolton
- Yew Tree
- West Derby Leyfield
- Sandfield Park
- Smithdown
- Sefton Park
- Much Woolton & Hunts Cross
- Springwood
- Waterfront North
- Waterfront South
- Kirkdale West
- Clubmoor West
- Old Swan West
- Toxteth
- Dingle
- Walton
- Vauxhall
- City Centre South
- Festival Gardens
- Canning
- City Centre North
- Fazakerley West
- Allerton
- Greenbank Park
- Grassendale & Cressington
- Garston
- Speke
- Brownlow Hill
- Everton West
- Tuebrook Breckside Park
- Kensington & Fairfield
- Everton East
- Edge Hill
Property price trends in Liverpool
According to the latest Land Registry data, the average home in Liverpool sold for £198,191 in 2026. That figure comes from a substantial record of 208,517 sales logged over the past 31 years.
Prices have continued to climb over the last three years. Compared with 2023, when the typical sale came in around £184,102, that's a rise of roughly 7.7%.
Looking back five years, average prices are up about 12.4% since 2021, a gain of around £21,833 in cash terms.
Zoom out to the past decade for the fuller picture. Back in 2016, homes here averaged £133,496, so the typical sold price has climbed about 48.5% since then, roughly 4% a year. Stretch the view to fifteen years and that annual pace eases back to about 3%.
Frequently asked questions about Liverpool
What is the average price for a property for sale in Liverpool?
The average price for a property for sale in Liverpool is £189,778. This amount is 0.09% lower than the average price in Liverpool. There are more than 10,000 property listings for sale in Liverpool.
What locations have the most expensive properties for sale in Liverpool?
The locations with the most expensive properties for sale in Liverpool are Church at an average of £361,631, Woolton at an average of £361,450 and Mossley Hill at an average of £323,202.
What locations have the most affordable properties for sale in Liverpool?
The locations with the most affordable properties for sale in Liverpool are County at an average of £98,781, Anfield at an average of £109,940 and Tuebrook And Stoneycroft at an average of £123,962.
Which train stations are available in or near Liverpool?
Some of the train stations available in or near Liverpool are Wavertree Technology Park, Edge Hill and Broad Green.
Property Price Paid in Liverpool by Year
The average sold property price by year was:
| Year | Average Sold Price | Price Change |
Sold Properties
|
|---|---|---|---|
| 2026 | £198,191 | -1% |
404 Properties |
| 2025 | £200,917 | 8% |
5,442 Properties |
| 2024 | £184,903 | 0,4% |
6,212 Properties |
| 2023 | £184,102 | 2% |
5,944 Properties |
| 2022 | £179,640 | 2% |
7,134 Properties |
| 2021 | £176,358 | 12% |
8,028 Properties |
| 2020 | £155,405 | 8% |
6,157 Properties |
| 2019 | £142,954 | 1% |
8,509 Properties |
| 2018 | £142,238 | 1% |
8,875 Properties |
| 2017 | £140,922 | 5% |
8,326 Properties |
Property Price per Property Type in Liverpool
Here you can find historic sold price data in order to help with your property search.
The average Property Paid Price for specific property types in the last three years are:
| Property Type | Average Sold Price | Sold Properties |
|---|---|---|
| Semi Detached House | £247,404.00 | 4,170 Semi Detached Houses |
| Terraced House | £153,738.00 | 9,238 Terraced Houses |
| Detached House | £414,913.00 | 1,035 Detached Houses |
| Flat | £150,336.00 | 3,559 Flats |
Transport in Liverpool
Please see below transportation links in this area:
