
Houses for sale & to rent in Biscot, Luton
House Prices in Biscot
Properties in Biscot have an average house price of £257k and had 286 Property Transactions within the last 3 years¹.
Biscot is an area in Luton, Luton with 4,513 households², where the most expensive property was sold for £1.8M.
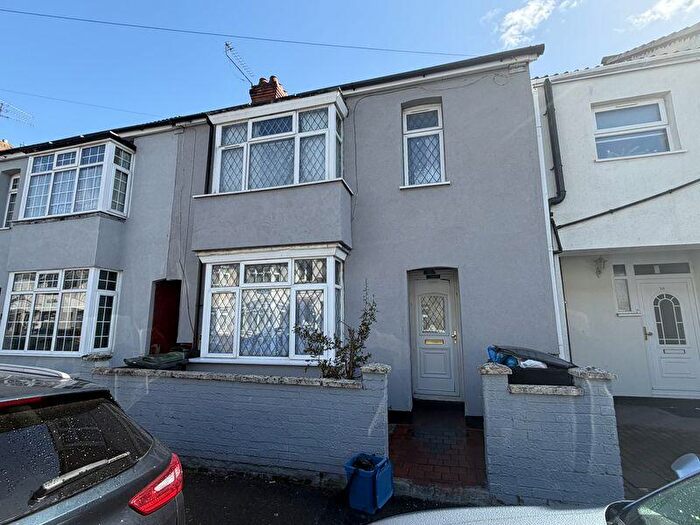
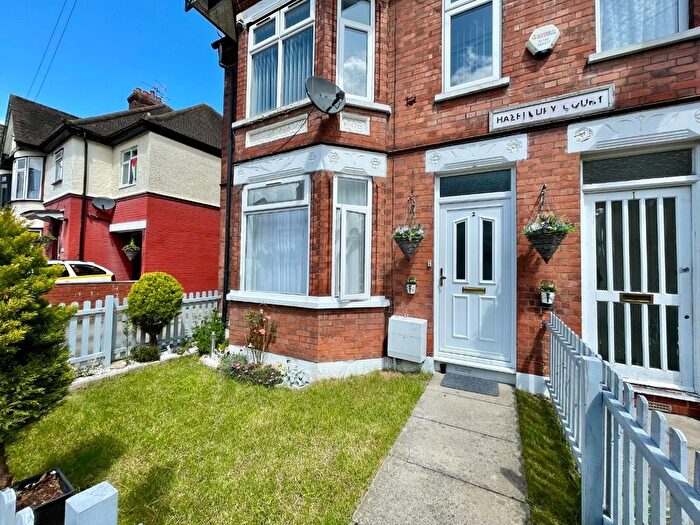
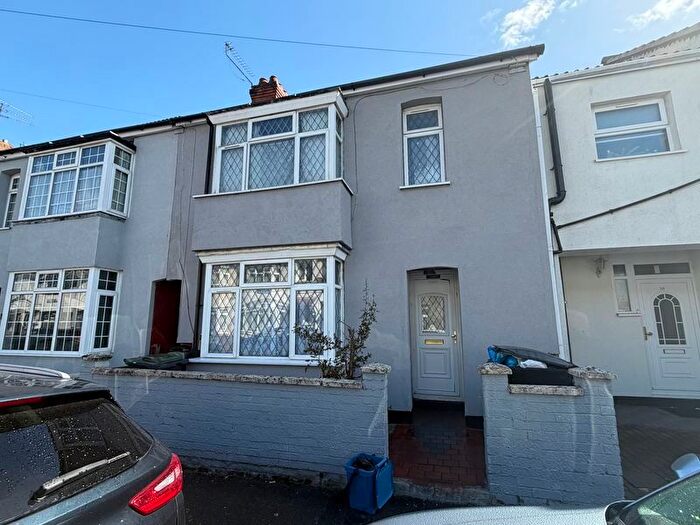
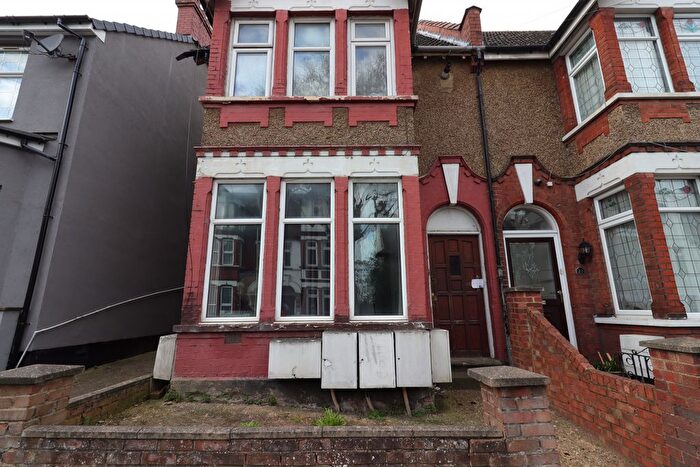
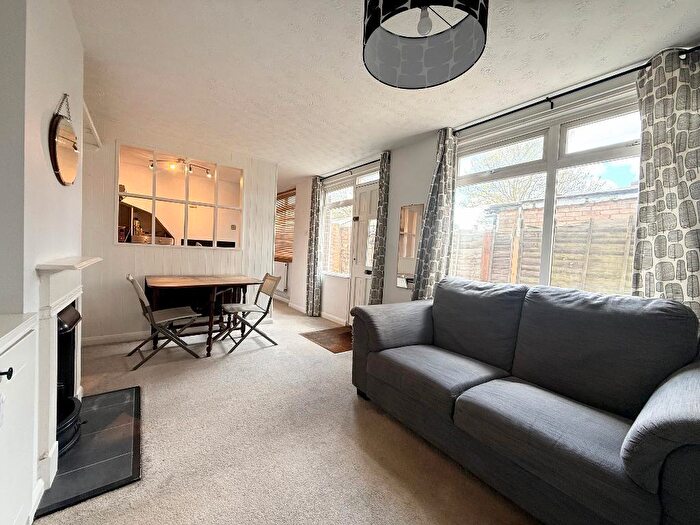
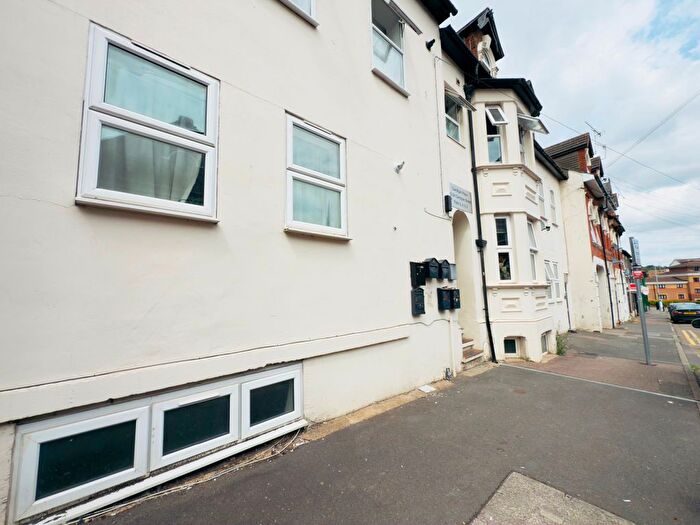
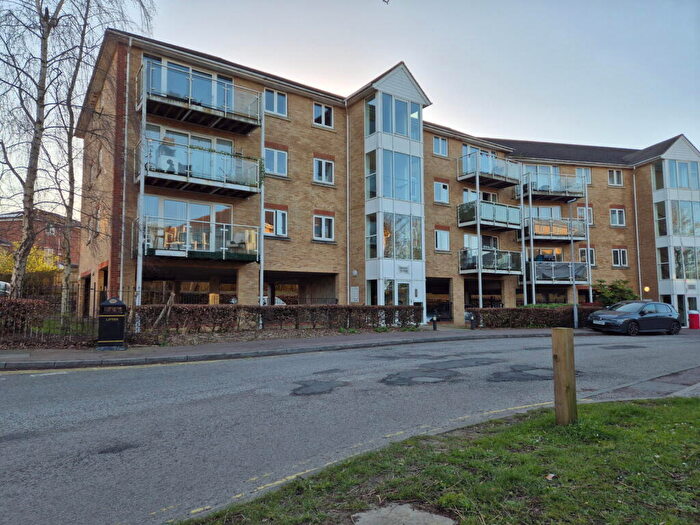
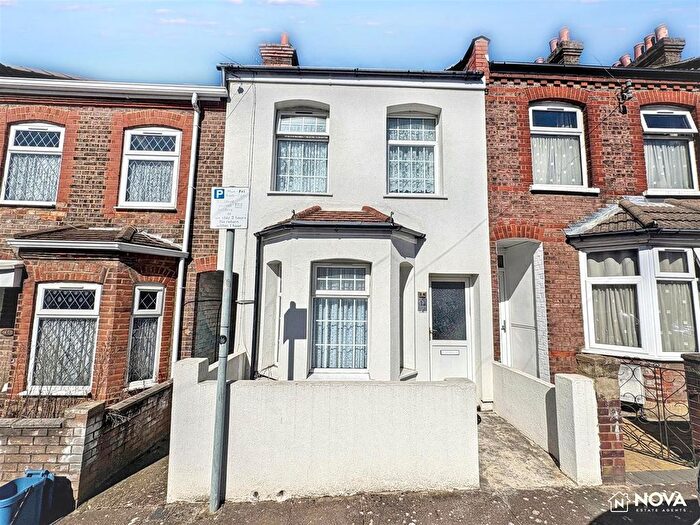
Properties for sale in Biscot
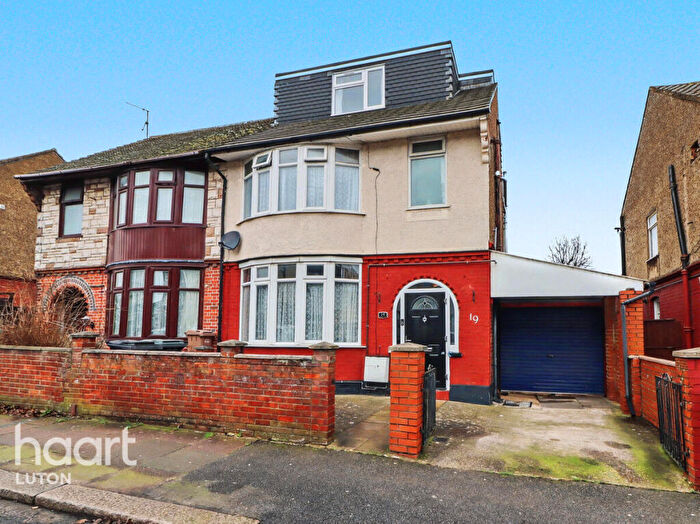
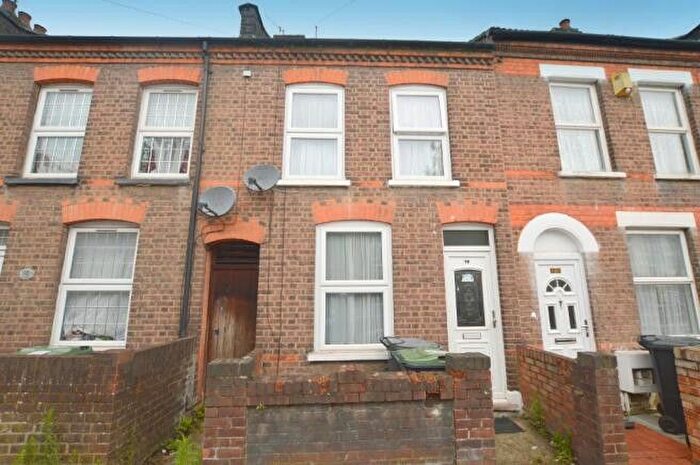
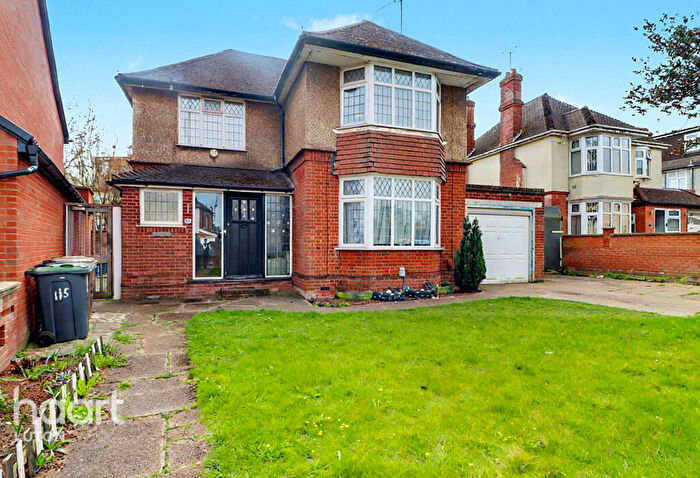
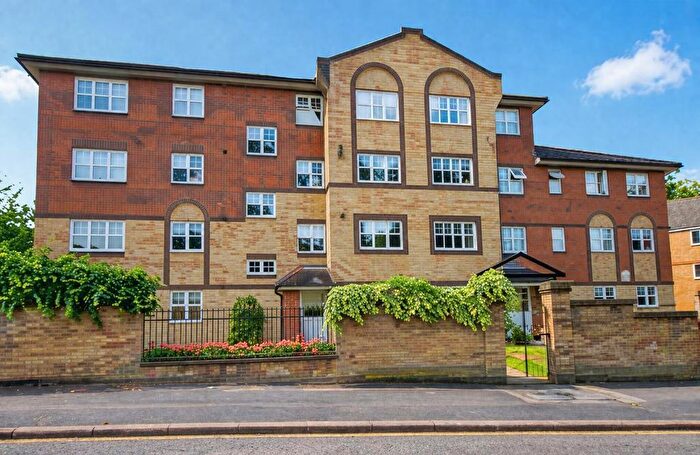
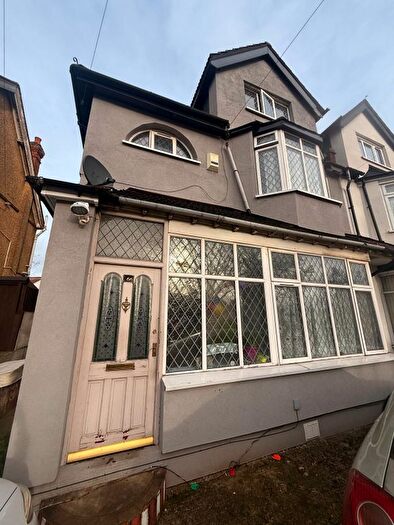

![]()
If you are looking to sell your house, let it out, or receive a property valuation, an expert can help you.
Click the button below to get started.


Roads and Postcodes in Biscot
Navigate through our locations to find the location of your next house in Biscot, Luton for sale or to rent.
Transport near Biscot

- FAQ
- Price Paid By Year
- Property Type Price
Frequently asked questions about Biscot
What is the average price for a property for sale in Biscot?
The average price for a property for sale in Biscot is £257,090. This amount is 14% lower than the average price in Luton. There are 2,319 property listings for sale in Biscot.
What streets have the most expensive properties for sale in Biscot?
The streets with the most expensive properties for sale in Biscot are Lansdowne Road at an average of £653,666, Montrose Avenue at an average of £640,000 and Marlborough Road at an average of £492,500.
What streets have the most affordable properties for sale in Biscot?
The streets with the most affordable properties for sale in Biscot are Bury Park Road at an average of £78,000, Nightingale Court at an average of £136,700 and Milliners Way at an average of £142,722.
Which train stations are available in or near Biscot?
Some of the train stations available in or near Biscot are Luton, Leagrave and Luton Airport Parkway.
Property Price Paid in Biscot by Year
The average sold property price by year was:
| Year | Average Sold Price | Price Change |
Sold Properties
|
|---|---|---|---|
| 2026 | £160,000 | -45% |
1 Property |
| 2025 | £231,582 | -20% |
81 Properties |
| 2024 | £277,537 | 8% |
108 Properties |
| 2023 | £256,620 | - |
96 Properties |
| 2022 | £256,505 | 5% |
92 Properties |
| 2021 | £244,752 | 2% |
122 Properties |
| 2020 | £240,999 | 12% |
74 Properties |
| 2019 | £213,012 | -9% |
100 Properties |
| 2018 | £232,934 | 18% |
110 Properties |
| 2017 | £191,961 | -3% |
166 Properties |
| 2016 | £197,873 | 14% |
135 Properties |
| 2015 | £170,140 | 13% |
136 Properties |
| 2014 | £148,263 | -9% |
132 Properties |
| 2013 | £161,242 | 5% |
69 Properties |
| 2012 | £153,267 | -10% |
77 Properties |
| 2011 | £168,631 | 10% |
85 Properties |
| 2010 | £151,330 | 4% |
93 Properties |
| 2009 | £145,955 | -7% |
89 Properties |
| 2008 | £155,836 | 1% |
127 Properties |
| 2007 | £153,527 | 1% |
301 Properties |
| 2006 | £151,949 | 2% |
276 Properties |
| 2005 | £148,791 | 7% |
297 Properties |
| 2004 | £137,949 | 18% |
363 Properties |
| 2003 | £113,470 | 20% |
314 Properties |
| 2002 | £91,103 | 19% |
370 Properties |
| 2001 | £73,621 | 15% |
322 Properties |
| 2000 | £62,319 | 18% |
283 Properties |
| 1999 | £51,022 | 10% |
298 Properties |
| 1998 | £45,673 | 10% |
266 Properties |
| 1997 | £41,132 | 4% |
246 Properties |
| 1996 | £39,297 | -3% |
237 Properties |
| 1995 | £40,407 | - |
186 Properties |
Property Price per Property Type in Biscot
Here you can find historic sold price data in order to help with your property search.
The average Property Paid Price for specific property types in the last three years are:
| Property Type | Average Sold Price | Sold Properties |
|---|---|---|
| Flat | £149,745.00 | 98 Flats |
| Semi Detached House | £346,042.00 | 75 Semi Detached Houses |
| Detached House | £580,800.00 | 15 Detached Houses |
| Terraced House | £246,810.00 | 98 Terraced Houses |