
Houses for sale & to rent in Dallow, Luton
House Prices in Dallow
Properties in Dallow have an average house price of £246,989.00 and had 307 Property Transactions within the last 3 years¹.
Dallow is an area in Luton, Luton with 4,584 households², where the most expensive property was sold for £835,000.00.
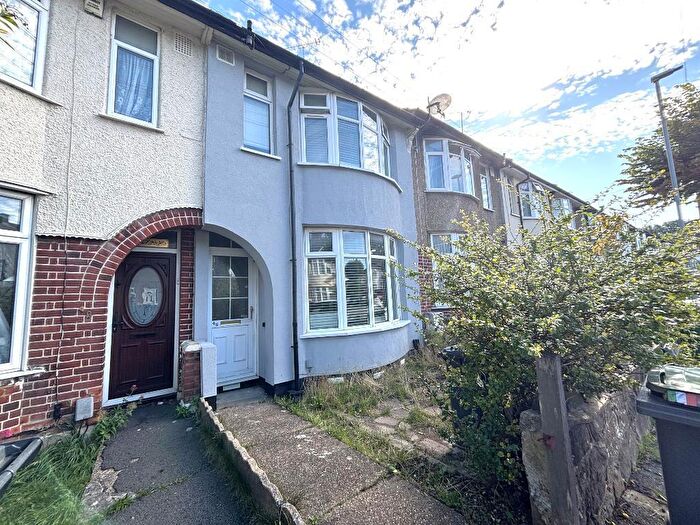
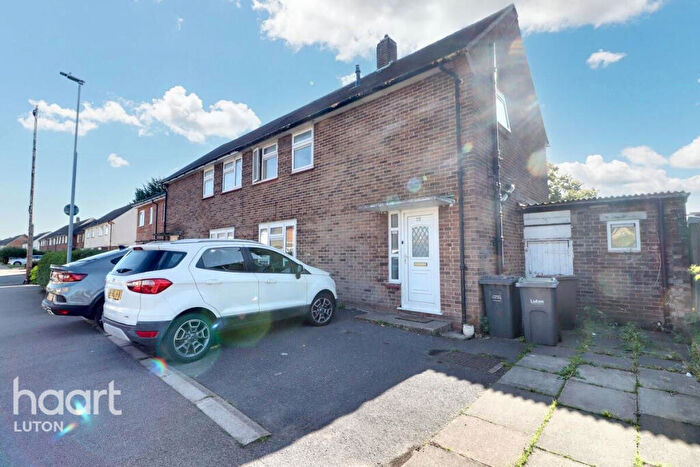
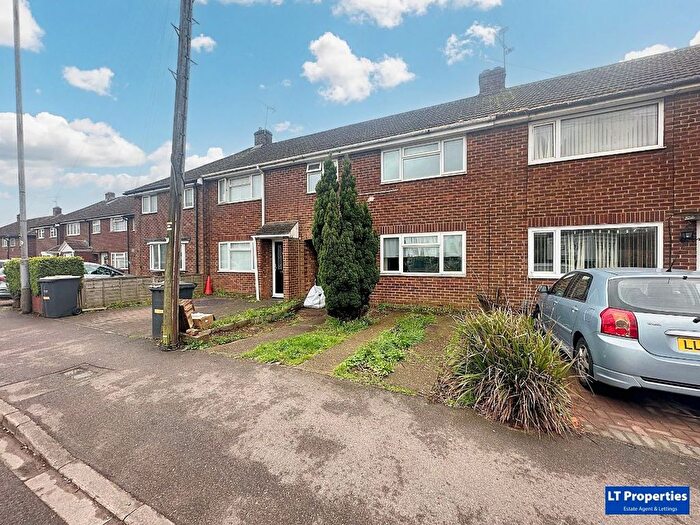
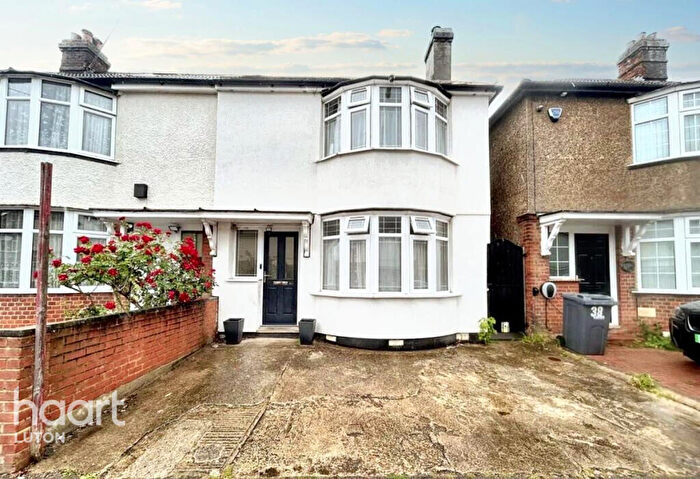
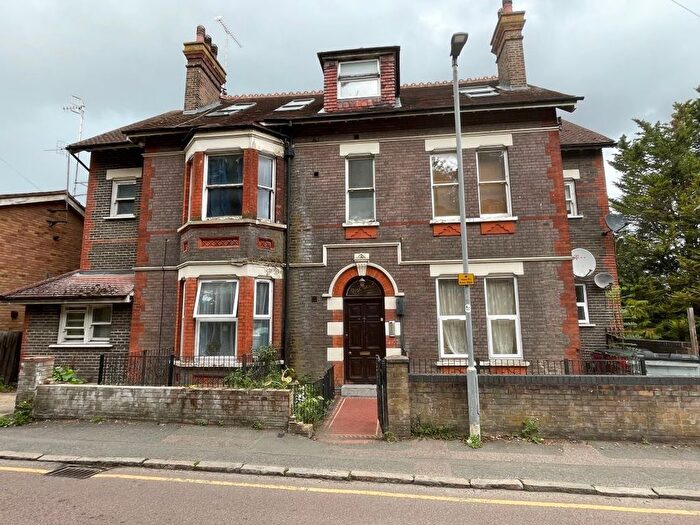
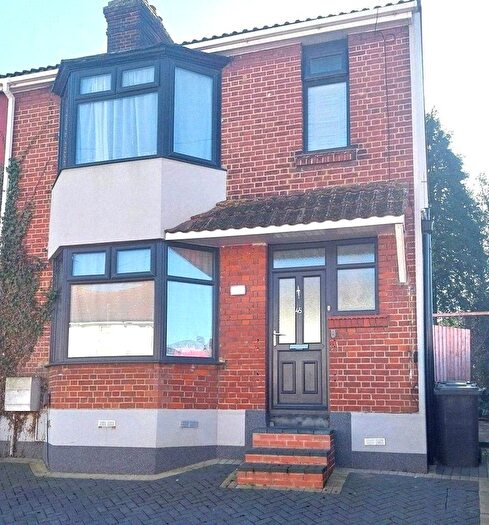
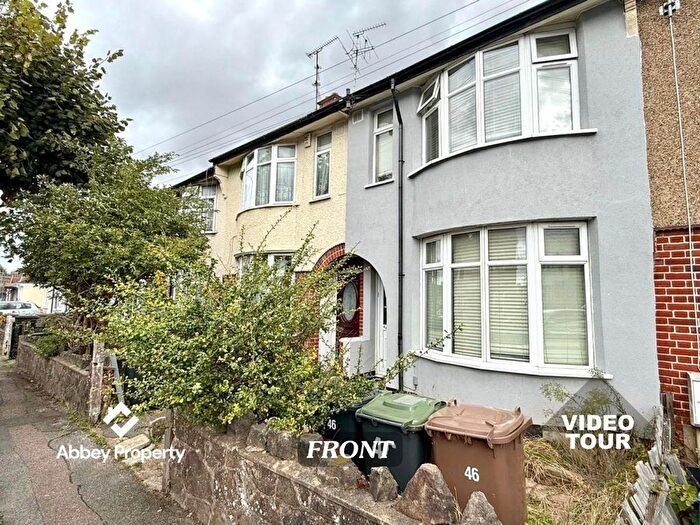
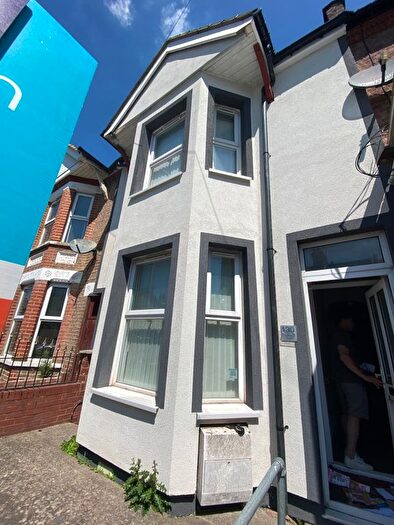
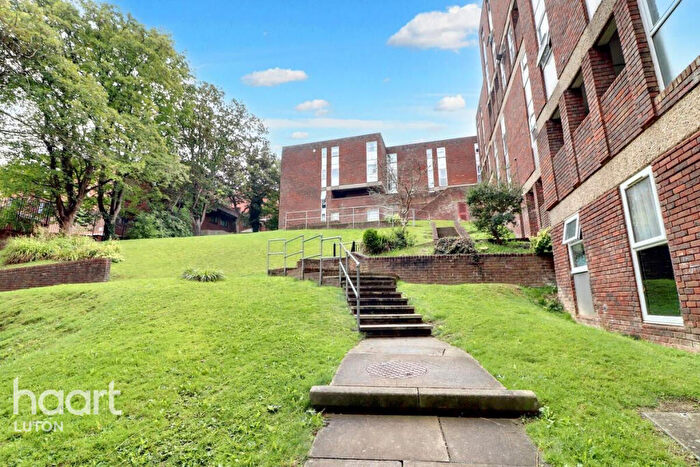
Properties for sale in Dallow


![]()
If you are looking to sell your house, let it out, or receive a property valuation, an expert can help you.
Click the button below to get started.


Roads and Postcodes in Dallow
Navigate through our locations to find the location of your next house in Dallow, Luton for sale or to rent.
Transport near Dallow

- FAQ
- Price Paid By Year
- Property Type Price
Frequently asked questions about Dallow
What is the average price for a property for sale in Dallow?
The average price for a property for sale in Dallow is £246,989. This amount is 17% lower than the average price in Luton. There are 1,419 property listings for sale in Dallow.
What streets have the most expensive properties for sale in Dallow?
The streets with the most expensive properties for sale in Dallow are Beresford Road at an average of £378,750, Chatsworth Road at an average of £338,250 and Highfield Road at an average of £313,600.
What streets have the most affordable properties for sale in Dallow?
The streets with the most affordable properties for sale in Dallow are Laporte Way at an average of £129,500, Mulberry Close at an average of £143,333 and Hazelbury Crescent at an average of £154,825.
Which train stations are available in or near Dallow?
Some of the train stations available in or near Dallow are Luton, Leagrave and Luton Airport Parkway.
Property Price Paid in Dallow by Year
The average sold property price by year was:
| Year | Average Sold Price | Price Change |
Sold Properties
|
|---|---|---|---|
| 2025 | £232,161 | -7% |
31 Properties |
| 2024 | £248,619 | 3% |
76 Properties |
| 2023 | £240,980 | -6% |
87 Properties |
| 2022 | £254,587 | 4% |
113 Properties |
| 2021 | £243,869 | 13% |
141 Properties |
| 2020 | £212,210 | 11% |
83 Properties |
| 2019 | £189,526 | -7% |
161 Properties |
| 2018 | £201,930 | -8% |
119 Properties |
| 2017 | £217,270 | 7% |
155 Properties |
| 2016 | £201,557 | 20% |
190 Properties |
| 2015 | £160,506 | 16% |
129 Properties |
| 2014 | £134,199 | 3% |
137 Properties |
| 2013 | £130,727 | 3% |
102 Properties |
| 2012 | £127,255 | 2% |
75 Properties |
| 2011 | £124,621 | -3% |
80 Properties |
| 2010 | £128,513 | 3% |
82 Properties |
| 2009 | £125,144 | -15% |
65 Properties |
| 2008 | £143,803 | 2% |
130 Properties |
| 2007 | £141,642 | 10% |
282 Properties |
| 2006 | £127,719 | 2% |
298 Properties |
| 2005 | £125,173 | 3% |
287 Properties |
| 2004 | £120,851 | 12% |
313 Properties |
| 2003 | £106,640 | 16% |
352 Properties |
| 2002 | £89,270 | 26% |
413 Properties |
| 2001 | £66,455 | 14% |
330 Properties |
| 2000 | £57,448 | 22% |
344 Properties |
| 1999 | £44,532 | 14% |
298 Properties |
| 1998 | £38,244 | 10% |
298 Properties |
| 1997 | £34,275 | 10% |
262 Properties |
| 1996 | £30,851 | -9% |
249 Properties |
| 1995 | £33,536 | - |
191 Properties |
Property Price per Property Type in Dallow
Here you can find historic sold price data in order to help with your property search.
The average Property Paid Price for specific property types in the last three years are:
| Property Type | Average Sold Price | Sold Properties |
|---|---|---|
| Flat | £136,625.00 | 30 Flats |
| Semi Detached House | £278,707.00 | 53 Semi Detached Houses |
| Terraced House | £250,819.00 | 220 Terraced Houses |
| Detached House | £443,826.00 | 4 Detached Houses |