
Houses for sale & to rent in LU1 1PH, Oban Terrace, Dallow, Luton
House Prices in LU1 1PH, Oban Terrace, Dallow
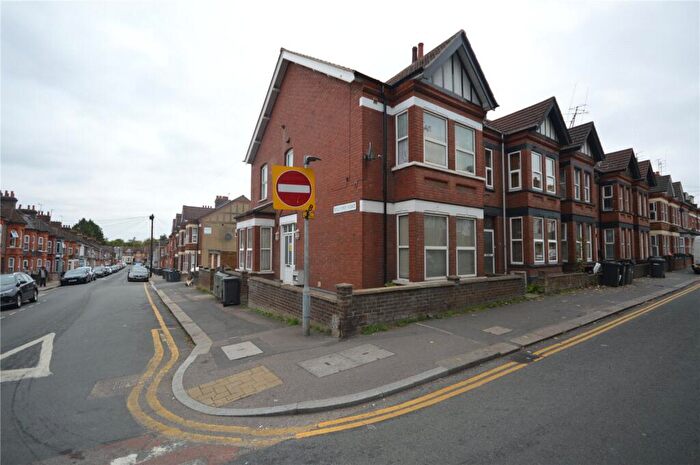
Properties in LU1 1PH have no sales history available within the last 3 years. LU1 1PH is a postcode in Oban Terrace located in Dallow, an area in Luton, Luton, with 5 households².
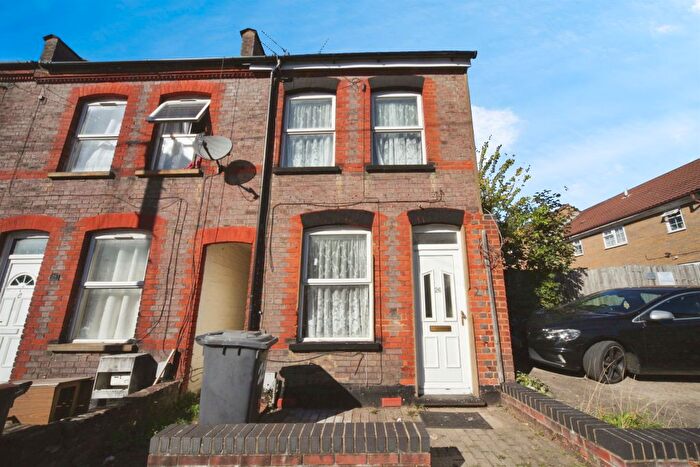
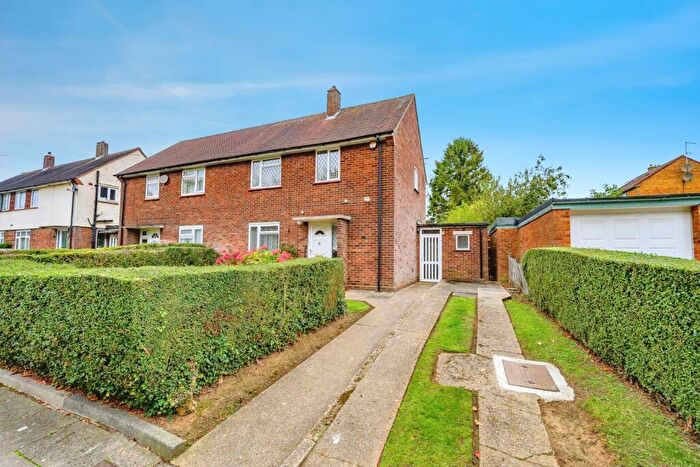
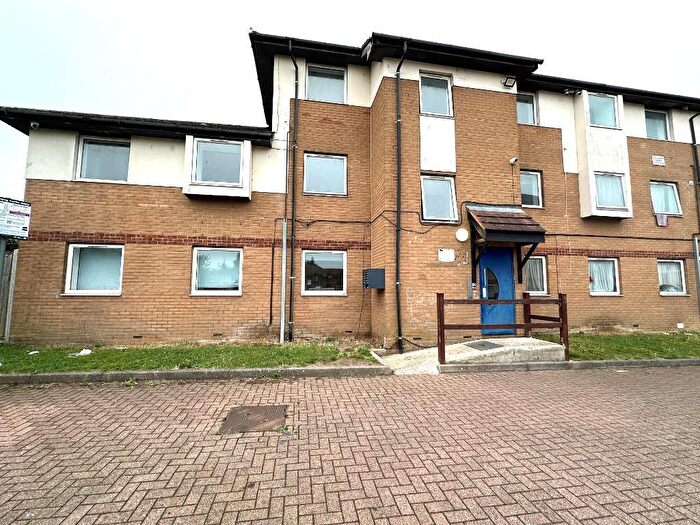
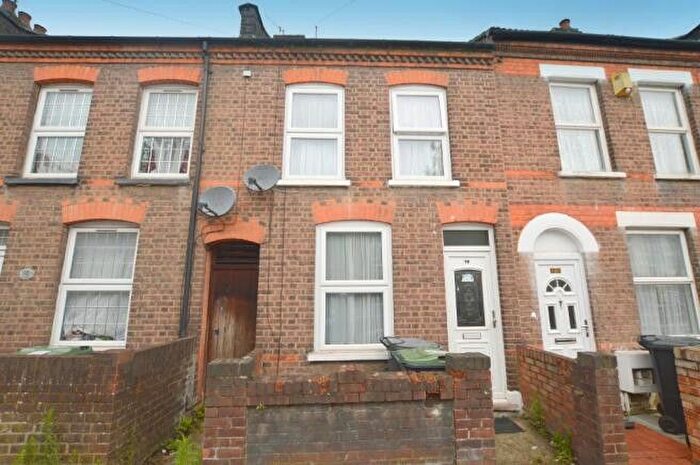
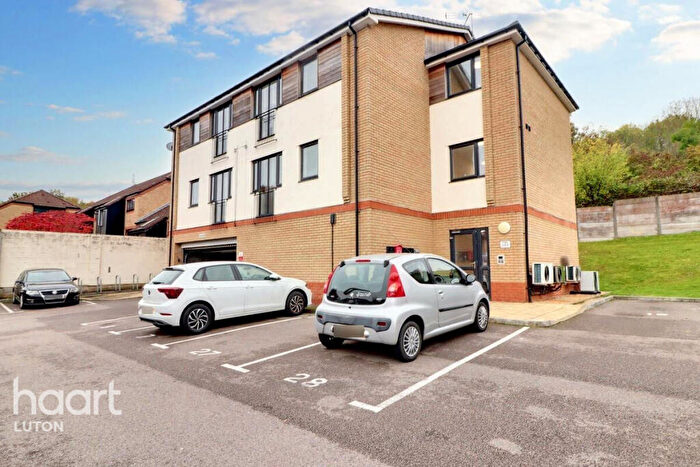
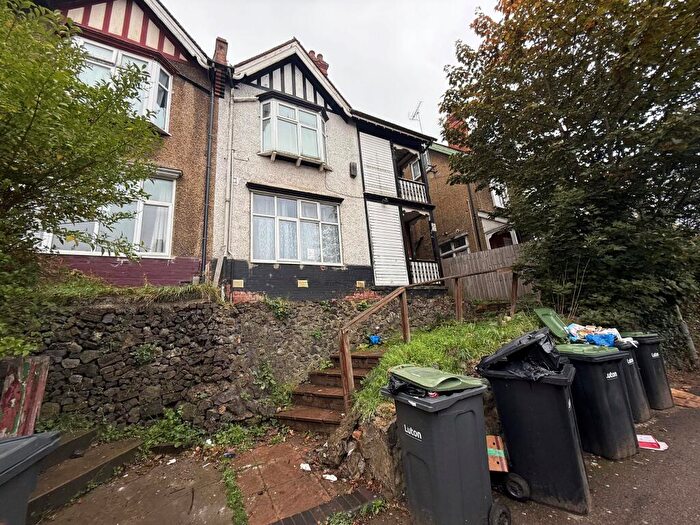
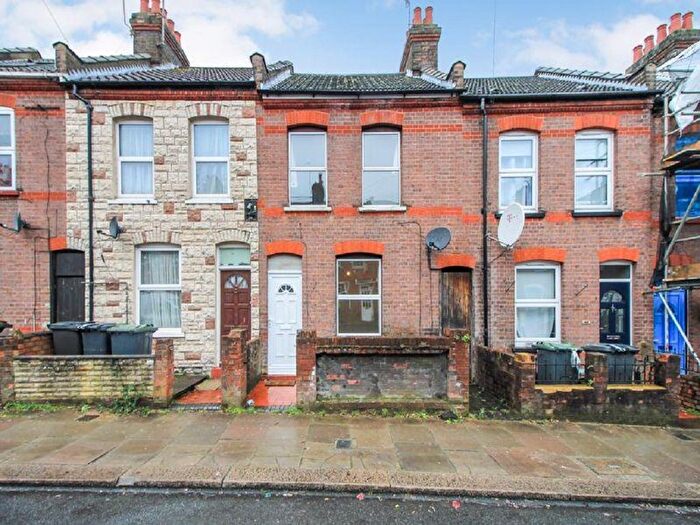
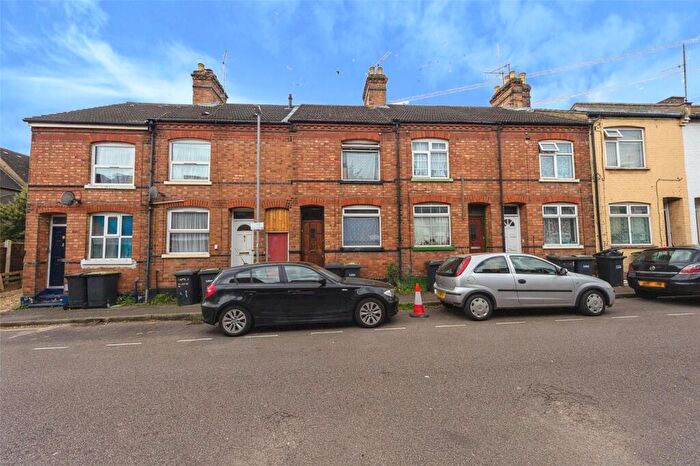
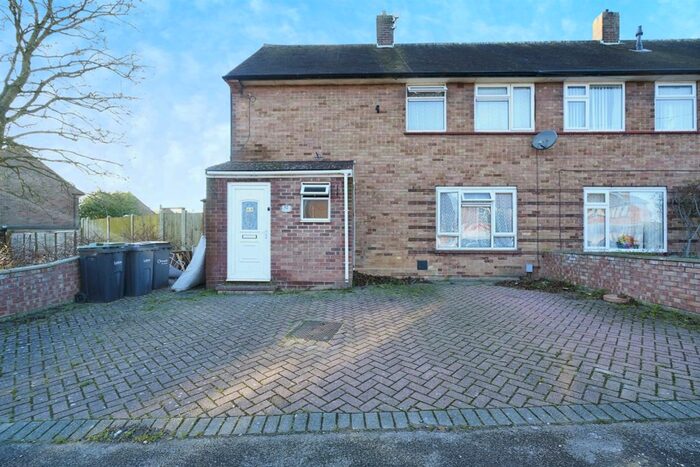
Properties for sale near LU1 1PH, Oban Terrace
![]()
If you are looking to sell your house, let it out, or receive a property valuation, an expert can help you.
Click the button below to get started.


Price Paid in Oban Terrace, LU1 1PH, Dallow
6 Oban Terrace, LU1 1PH, Dallow Luton
Property 6 has been sold 3 times. The last time it was sold was in 29/05/2015 and the sold price was £170,000.00.
This terraced house, sold as a freehold on 29/05/2015, is a 75 sqm mid-terrace house with an EPC rating of D.
| Date | Price | Property Type | Tenure | Classification |
|---|---|---|---|---|
| 29/05/2015 | £170,000.00 | Terraced House | freehold | Established Building |
| 30/11/2005 | £141,500.00 | Terraced House | freehold | Established Building |
| 13/11/2000 | £71,000.00 | Terraced House | freehold | Established Building |
8 Oban Terrace, LU1 1PH, Dallow Luton
Property 8 has been sold 1 time. The last time it was sold was in 18/01/2008 and the sold price was £161,000.00.
This terraced house, sold as a freehold on 18/01/2008, is a 87 sqm end-terrace house with an EPC rating of C.
| Date | Price | Property Type | Tenure | Classification |
|---|---|---|---|---|
| 18/01/2008 | £161,000.00 | Terraced House | freehold | Established Building |
7 Oban Terrace, LU1 1PH, Dallow Luton
Property 7 has been sold 1 time. The last time it was sold was in 13/02/2004 and the sold price was £126,500.00.
This is a Terraced House which was sold as a freehold in 13/02/2004
| Date | Price | Property Type | Tenure | Classification |
|---|---|---|---|---|
| 13/02/2004 | £126,500.00 | Terraced House | freehold | Established Building |
Transport near LU1 1PH, Oban Terrace

House price paid reports for LU1 1PH, Oban Terrace
Click on the buttons below to see price paid reports by year or property price:
- Price Paid By Year
Property Price Paid in LU1 1PH, Oban Terrace by Year
The average sold property price by year was:
| Year | Average Sold Price | Price Change |
Sold Properties
|
|---|---|---|---|
| 2015 | £170,000 | 5% |
1 Property |
| 2008 | £161,000 | 12% |
1 Property |
| 2005 | £141,500 | 11% |
1 Property |
| 2004 | £126,500 | 44% |
1 Property |
| 2000 | £71,000 | - |
1 Property |