
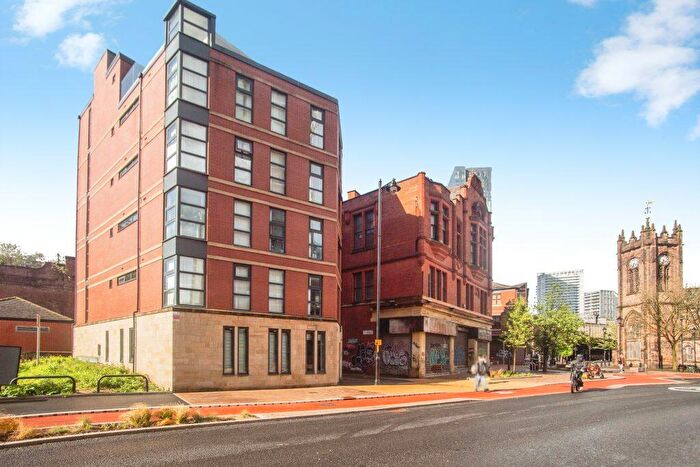
Houses for sale & to rent in Deansgate, Manchester
House Prices in Deansgate
Properties in Deansgate have an average house price of £466k and had 77 Property Transactions within the last 3 years¹.
Deansgate is an area in Manchester, Manchester with 507 households², where the most expensive property was sold for £2.5M.
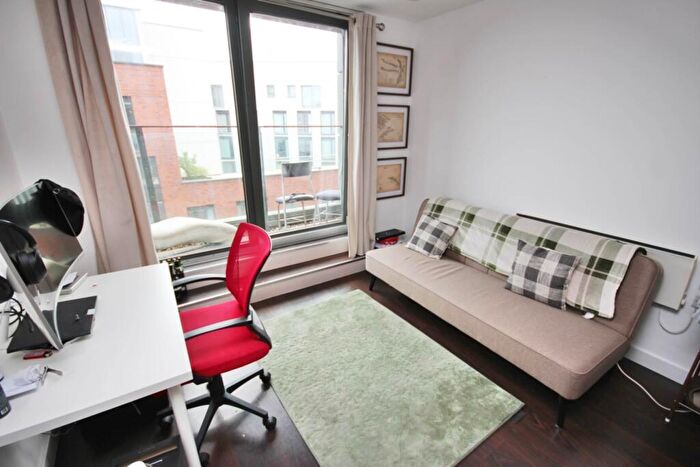
Properties for sale in Deansgate


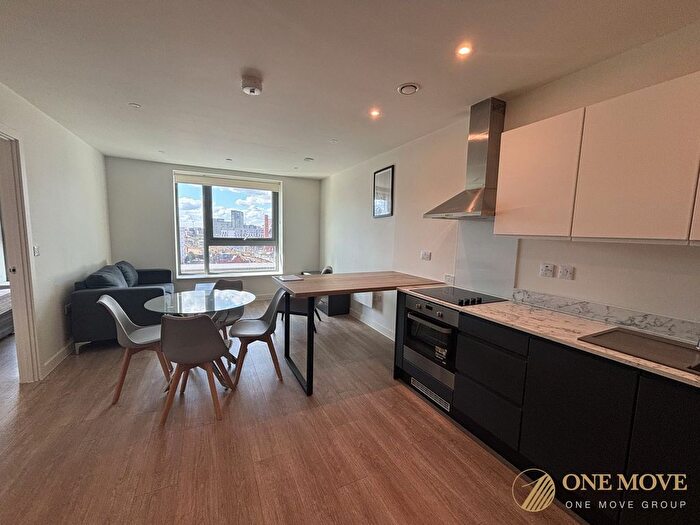
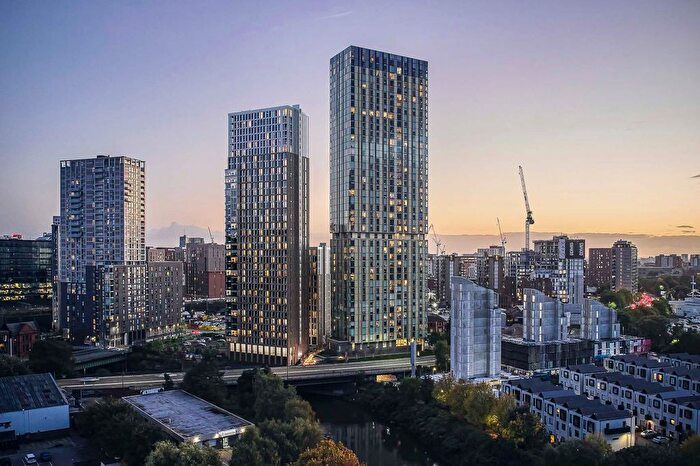

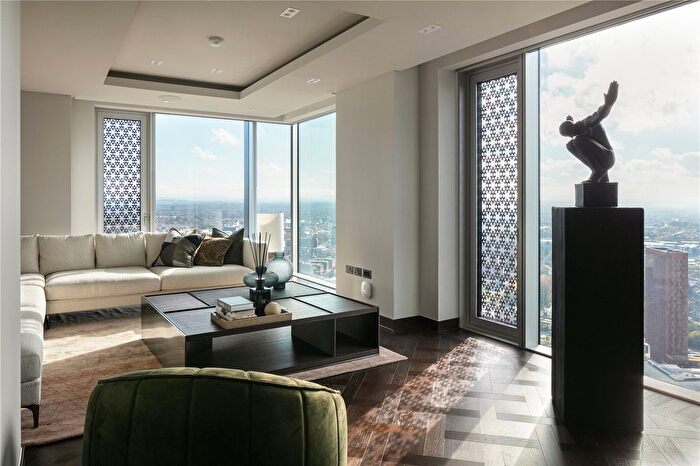
![]()
If you are looking to sell your house, let it out, or receive a property valuation, an expert can help you.
Click the button below to get started.


Roads and Postcodes in Deansgate
Navigate through our locations to find the location of your next house in Deansgate, Manchester for sale or to rent.
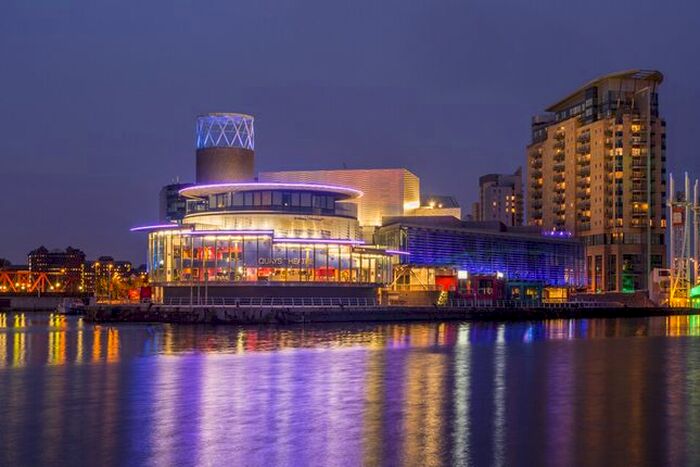
Transport near Deansgate
-
 Manchester Oxford Road Station
 -
Deansgate Station
-
Salford Central Station
-
Manchester Victoria Station
-
Manchester Piccadilly Station
-
Salford Crescent Station
-
Ardwick Station
-
Ashburys Station
-
Manchester United Football Ground Station
-
Belle Vue Station
- FAQ
- Price Paid By Year
- Property Type Price
Frequently asked questions about Deansgate
What is the average price for a property for sale in Deansgate?
The average price for a property for sale in Deansgate is £465,933. This amount is 79% higher than the average price in Manchester. There are more than 10,000 property listings for sale in Deansgate.
What streets have the most expensive properties for sale in Deansgate?
The streets with the most expensive properties for sale in Deansgate are St John Street at an average of £1,650,000, King Street at an average of £658,129 and OWEN STREET at an average of £447,803.
What streets have the most affordable properties for sale in Deansgate?
The streets with the most affordable properties for sale in Deansgate are Princess Street at an average of £154,000, POTATO WHARF at an average of £214,950 and WHITWORTH STREET WEST at an average of £253,400.
Which train stations are available in or near Deansgate?
Some of the train stations available in or near Deansgate are Manchester Oxford Road, Deansgate and Salford Central.
Property Price Paid in Deansgate by Year
The average sold property price by year was:
| Year | Average Sold Price | Price Change |
Sold Properties
|
|---|---|---|---|
| 2026 | £204,000 | -133% |
1 Property |
| 2025 | £475,413 | -3% |
20 Properties |
| 2024 | £490,744 | 10% |
29 Properties |
| 2023 | £441,962 | -11% |
27 Properties |
| 2022 | £490,668 | 14% |
54 Properties |
| 2021 | £423,538 | 19% |
74 Properties |
| 2020 | £343,043 | -19% |
580 Properties |
| 2019 | £408,043 | 32% |
20 Properties |
| 2018 | £277,036 | 44% |
40 Properties |
| 2017 | £156,359 | -53% |
159 Properties |
| 2016 | £239,531 | 34% |
299 Properties |
| 2015 | £158,205 | 45% |
128 Properties |
| 2014 | £87,710 | -886% |
4 Properties |
| 2012 | £865,000 | 88% |
1 Property |
| 2010 | £100,000 | -210% |
1 Property |
| 2009 | £310,000 | -83% |
2 Properties |
| 2008 | £565,833 | 77% |
3 Properties |
| 2007 | £132,500 | -115% |
2 Properties |
| 2006 | £285,000 | -71% |
2 Properties |
| 2005 | £487,500 | 52% |
2 Properties |
| 2004 | £235,000 | -101% |
1 Property |
| 2003 | £471,625 | 26% |
4 Properties |
| 2002 | £349,250 | -1288,7% |
2 Properties |
| 2001 | £4,850,000 | 90% |
1 Property |
| 1999 | £464,218 | 93% |
4 Properties |
| 1998 | £32,500 | -401% |
2 Properties |
| 1997 | £162,770 | -3% |
2 Properties |
| 1996 | £167,500 | 70% |
2 Properties |
| 1995 | £50,000 | - |
1 Property |
Property Price per Property Type in Deansgate
Here you can find historic sold price data in order to help with your property search.
The average Property Paid Price for specific property types in the last three years are:
| Property Type | Average Sold Price | Sold Properties |
|---|---|---|
| Terraced House | £1,487,500.00 | 4 Terraced Houses |
| Flat | £409,957.00 | 73 Flats |