
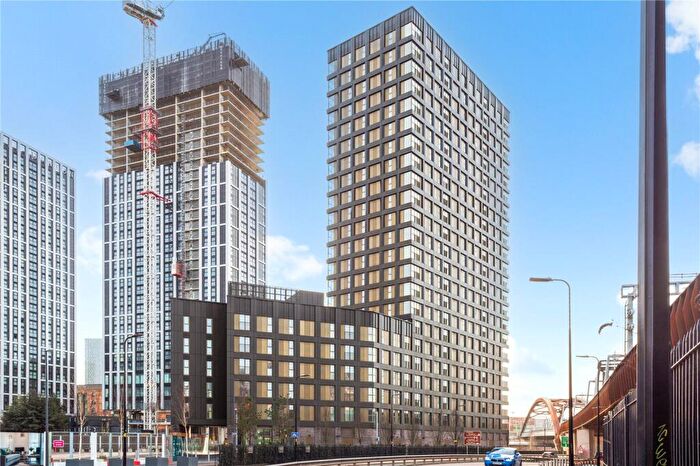
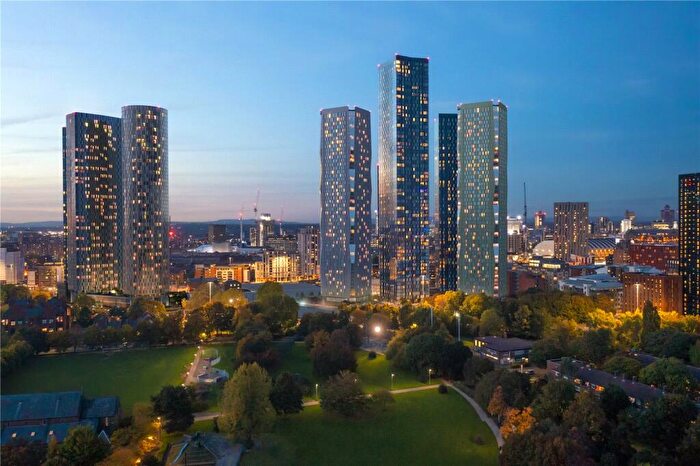
Houses for sale & to rent in City Centre, Manchester
House Prices in City Centre
Properties in City Centre have an average house price of £232k and had 780 Property Transactions within the last 3 years¹.
City Centre is an area in Manchester, Manchester with 6,867 households², where the most expensive property was sold for £1.2M.
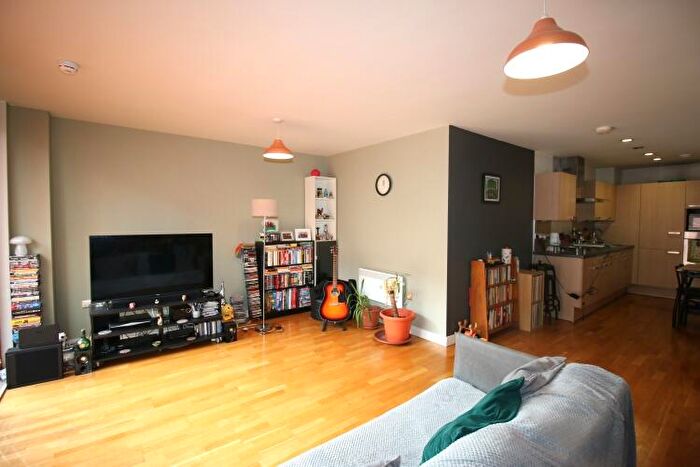
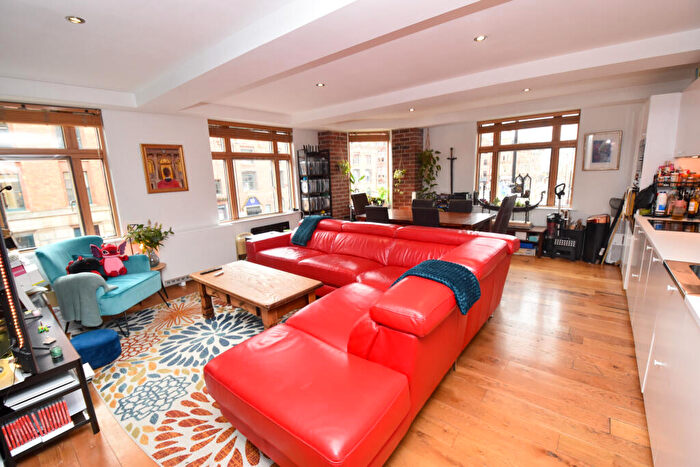
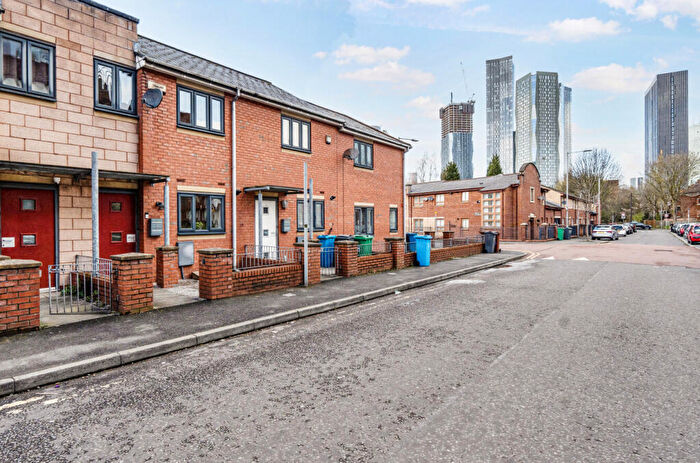
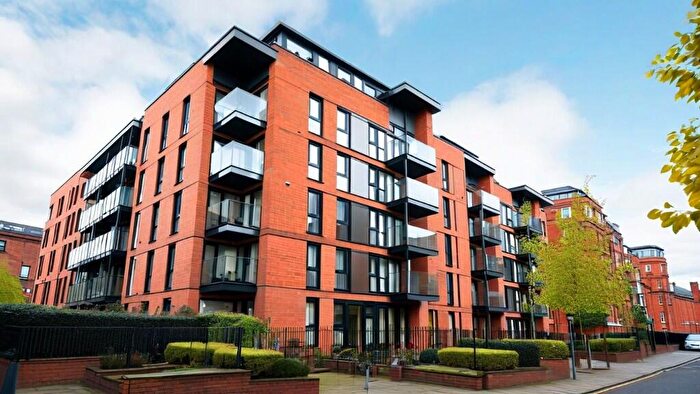
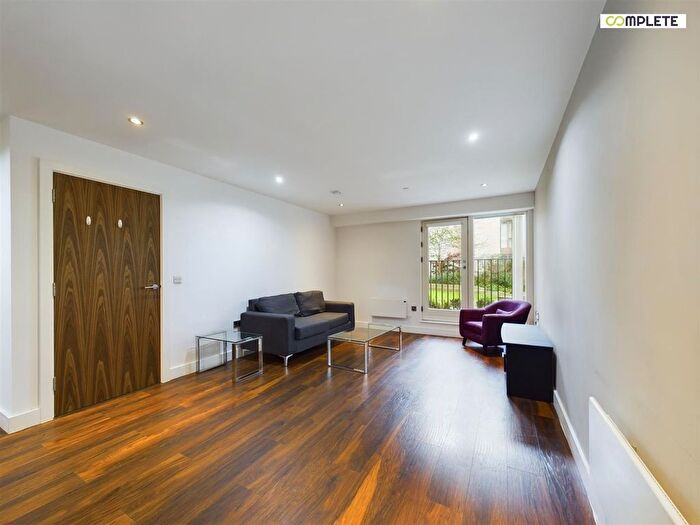
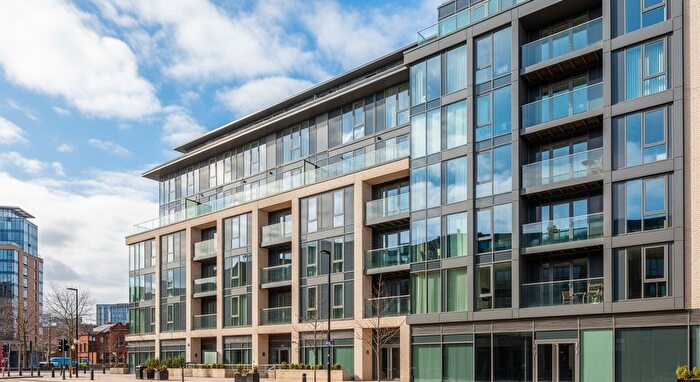
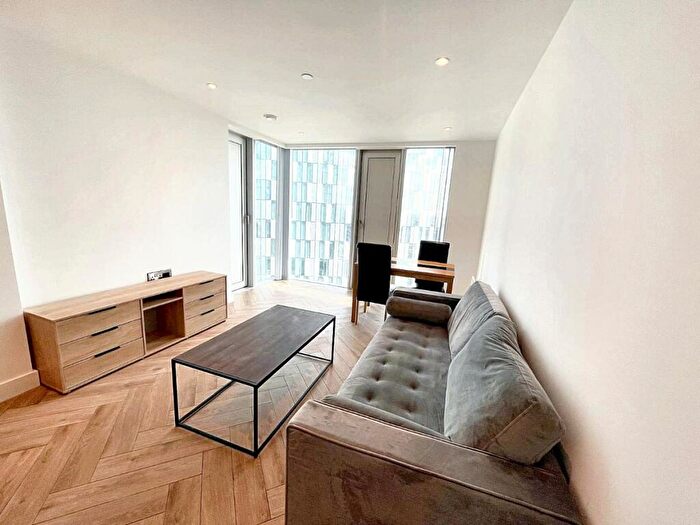
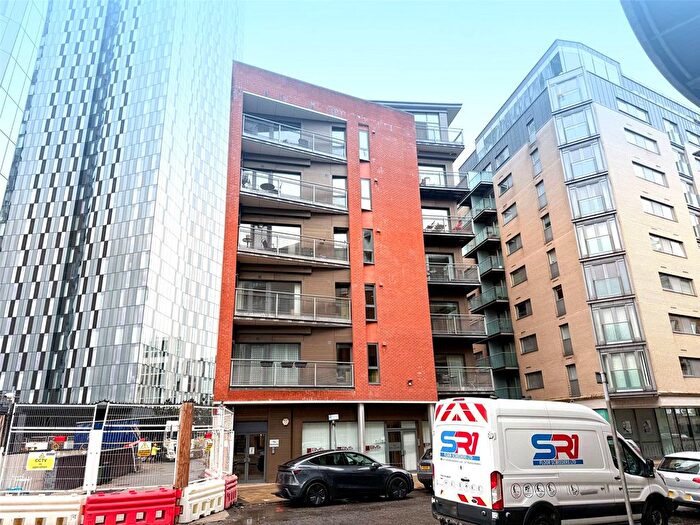
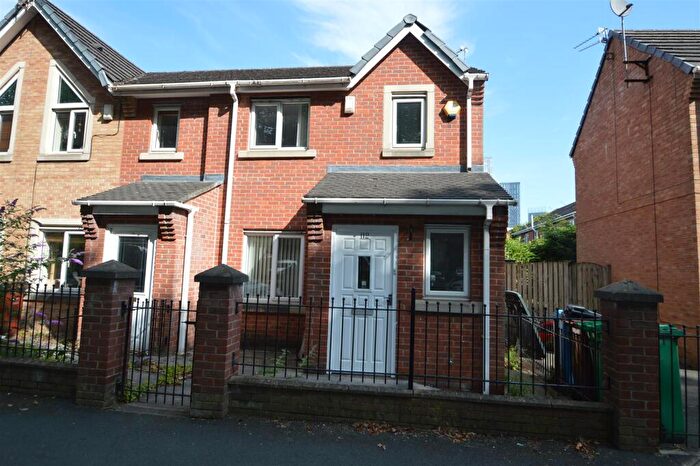
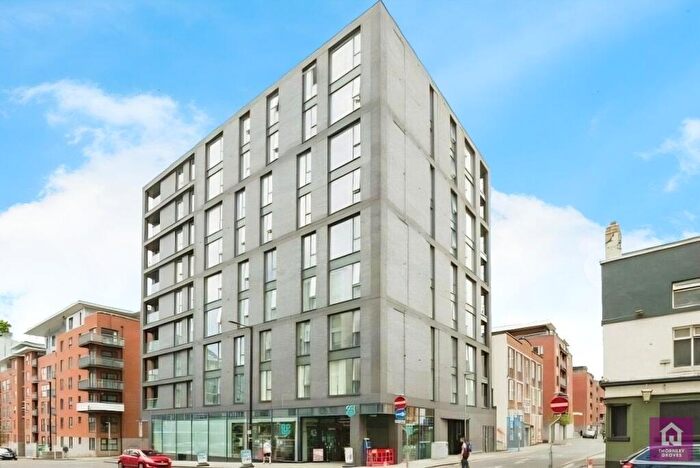
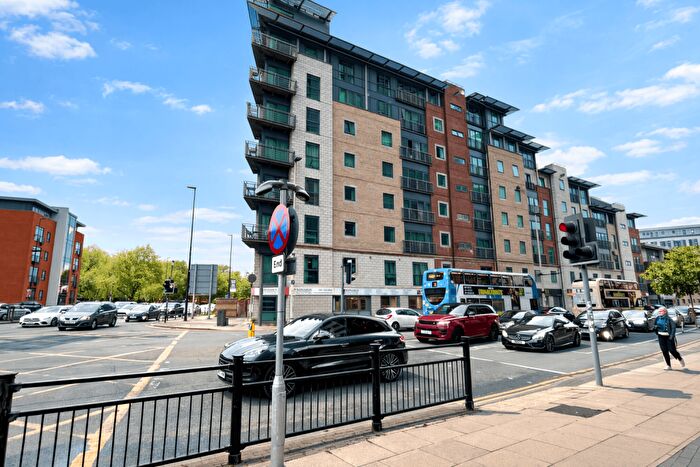
Properties for sale in City Centre

![]()
If you are looking to sell your house, let it out, or receive a property valuation, an expert can help you.
Click the button below to get started.


Roads and Postcodes in City Centre
Navigate through our locations to find the location of your next house in City Centre, Manchester for sale or to rent.
| Streets | Postcodes |
|---|---|
| Ashill Walk | M3 4FJ |
| Aytoun Street | M1 3BL M1 3DA M1 3DB |
| Barton Street | M3 4NN |
| Blantyre Street | M15 4EB M15 4EG M15 4JJ M15 4JS M15 4JT M15 4JU M15 4LG |
| Bloom Street | M1 3LR |
| Bombay Street | M1 7AT |
| Booth Street | M2 4AT |
| Brazil Street | M1 3PW |
| Bridge Street | M3 3BW |
| Bridgewater Street | M3 4NH |
| Cambridge Street | M1 5BY M1 5BZ M1 5GF M1 5GG M1 5GH |
| Canal Street | M1 3EZ M1 3WD |
| Castle Quay | M15 4NT |
| Chepstow Street | M1 5JF |
| Chester Road | M15 4QG |
| Chorlton Street | M1 3HW |
| Church Street | M4 1PE M4 1PN M4 1PY |
| City Road East | M15 4QA M15 4QD M15 4QE M15 4QF M15 4QL M15 4QN M15 4TA M15 4TB M15 4TD M15 4TE M15 4TF M15 4TH |
| Cobourg Street | M1 3GB |
| Collier Street | M3 4NA |
| Commercial Street | M15 4QW M15 4QY M15 4RQ |
| Constance Street | M15 4JQ |
| Cross Street | M2 4JE PR1 3AJ |
| Culvercliffe Walk | M3 4FL |
| Dale Street | M1 2HH M1 2HS M1 2PE M1 1BA M1 1EY M1 1JA |
| Deansgate | M3 1AZ M3 4LA M3 4LB M3 4LG M3 4LT M3 4LU M3 4LX |
| Dickinson Street | M1 4LX |
| Ducie Street | M1 2DP M1 2DQ |
| Duke Street | M3 4NF |
| Edgehill Street | M4 1BB |
| George Street | M1 4AB |
| Gillbrook Road | M60 2WH |
| Granby Row | M1 7AB M1 7AR |
| Great Bridgewater Street | M1 5JG M1 5JW |
| Great Marlborough Street | M1 5AL |
| Harter Street | M1 6HP |
| High Street | M4 1ED |
| Hilton Street | M1 2BL M1 2EH |
| Hulme Street | M1 5GL |
| John Dalton Street | M2 6LE |
| Joiner Street | M4 1PH M4 1PP M4 1PR |
| Jordan Street | M15 4PY M15 4QU M15 4QX |
| Jutland Street | M1 2DS |
| Kennedy Street | M2 4BY |
| King Street West | M3 2WN |
| Leftbank | M3 3AD M3 3AE M3 3AF M3 3AG M3 3AH M3 3AJ M3 3AL |
| Lever Street | M1 1BY |
| Little John Street | M3 3GZ |
| Little Peter Street | M15 4QH M15 4QJ |
| Liverpool Road | M3 4AQ M3 4JN M3 4NQ M3 4NW |
| Lower Byrom Street | M3 4AN |
| Lower Chatham Street | M1 5TF |
| Lower Ormond Street | M1 5QD M1 5QE M1 5QF M1 5QG |
| Mirabel Street | M3 1PJ |
| New Wakefield Street | M1 5NP |
| Newton Street | M1 1HE |
| Oldham Street | M1 1JN M1 1JQ |
| Oxford Court | M2 3WQ |
| Oxford Road | M1 6EY |
| Piccadilly | M1 2BU M1 1LT |
| Piccadilly Place | M1 3BP M1 3BR |
| Police Street | M2 7LQ M2 7LU |
| Porchfield Square | M3 4FG |
| Portland Street | M1 6DF |
| Potato Wharf | M3 4BB M3 4BD M3 4NB |
| Princess Street | M1 4DA M1 4LB M1 6BD M1 6BE M1 6HR M1 6NF M1 7AF M1 7EP M2 4FN |
| Rice Street | M3 4JL |
| Richmond Street | M1 3WB |
| River Street | M1 5BB M1 5BG |
| Rozel Square | M3 4FQ |
| Sackville Street | M1 3LZ M1 3NF M1 3WE |
| Samuel Ogden Street | M1 7AX |
| Shudehill | M4 1EZ M4 2AF |
| Slate Wharf | M15 4SW M15 4SX M15 4SY M15 4SZ |
| Southern Street | M3 4NJ |
| St Marys Parsonage | M3 2DD M3 2DE |
| Tariff Street | M1 2FF |
| Thomas Street | M4 1DH |
| Tib Street | M4 1LA |
| Turner Street | M4 1DW M4 1DY M4 1DZ |
| Union Street | M4 1PB EH1 3AB |
| Victoria Street | M3 1ST |
| Watson Street | M3 3EH M3 4EE M3 4EF M3 4EH M3 4EP |
| Whitworth Street | M1 3AB M1 3BS M1 3NR M1 3NT M1 3WS M1 5BE M1 6LQ |
| Whitworth Street West | M1 5BD M1 5DB M1 5DD M1 5DE M1 5EA M1 5EB M1 5ED M1 5ND |
| Withy Grove | M4 2BJ |
| Woollam Place | M3 4JJ |
Transport near City Centre
-
 Manchester Oxford Road Station
 -
Deansgate Station
-
Manchester Piccadilly Station
-
Salford Central Station
-
Manchester Victoria Station
-
Ardwick Station
-
Salford Crescent Station
-
Ashburys Station
-
Manchester United Football Ground Station
-
Belle Vue Station
- FAQ
- Price Paid By Year
- Property Type Price
Frequently asked questions about City Centre
What is the average price for a property for sale in City Centre?
The average price for a property for sale in City Centre is £232,093. This amount is 11% lower than the average price in Manchester. There are more than 10,000 property listings for sale in City Centre.
What streets have the most expensive properties for sale in City Centre?
The streets with the most expensive properties for sale in City Centre are Oxford Court at an average of £842,681, Richmond Street at an average of £622,500 and Southern Street at an average of £426,875.
What streets have the most affordable properties for sale in City Centre?
The streets with the most affordable properties for sale in City Centre are Piccadilly at an average of £111,920, Withy Grove at an average of £130,000 and Oldham Street at an average of £142,833.
Which train stations are available in or near City Centre?
Some of the train stations available in or near City Centre are Manchester Oxford Road, Deansgate and Manchester Piccadilly.
Property Price Paid in City Centre by Year
The average sold property price by year was:
| Year | Average Sold Price | Price Change |
Sold Properties
|
|---|---|---|---|
| 2026 | £287,166 | 19% |
6 Properties |
| 2025 | £231,536 | 1% |
238 Properties |
| 2024 | £228,564 | -4% |
340 Properties |
| 2023 | £237,204 | -0,1% |
196 Properties |
| 2022 | £237,546 | -28% |
305 Properties |
| 2021 | £303,924 | 22% |
306 Properties |
| 2020 | £237,387 | -1% |
213 Properties |
| 2019 | £238,779 | 5% |
359 Properties |
| 2018 | £226,877 | -1% |
461 Properties |
| 2017 | £229,129 | 8% |
536 Properties |
| 2016 | £210,133 | 12% |
620 Properties |
| 2015 | £185,962 | 5% |
667 Properties |
| 2014 | £176,442 | -3% |
561 Properties |
| 2013 | £181,505 | 7% |
427 Properties |
| 2012 | £168,378 | -4% |
311 Properties |
| 2011 | £175,725 | -3% |
303 Properties |
| 2010 | £181,193 | 14% |
424 Properties |
| 2009 | £155,572 | -18% |
460 Properties |
| 2008 | £182,843 | -21% |
387 Properties |
| 2007 | £221,567 | 15% |
1,215 Properties |
| 2006 | £188,293 | 7% |
1,327 Properties |
| 2005 | £175,364 | -3% |
1,017 Properties |
| 2004 | £180,894 | 7% |
970 Properties |
| 2003 | £167,713 | 3% |
1,050 Properties |
| 2002 | £162,312 | 10% |
1,197 Properties |
| 2001 | £146,886 | 18% |
635 Properties |
| 2000 | £120,550 | 18% |
528 Properties |
| 1999 | £99,391 | 13% |
399 Properties |
| 1998 | £86,390 | 11% |
277 Properties |
| 1997 | £77,181 | 2% |
177 Properties |
| 1996 | £75,854 | 17% |
146 Properties |
| 1995 | £63,269 | - |
139 Properties |
Property Price per Property Type in City Centre
Here you can find historic sold price data in order to help with your property search.
The average Property Paid Price for specific property types in the last three years are:
| Property Type | Average Sold Price | Sold Properties |
|---|---|---|
| Flat | £227,140.00 | 767 Flats |
| Detached House | £407,000.00 | 4 Detached Houses |
| Terraced House | £622,835.00 | 8 Terraced Houses |
| Semi Detached House | £205,000.00 | 1 Semi Detached House |