
Houses for sale & to rent in Olney, Newport Pagnell
House Prices in Olney
Properties in Olney have an average house price of £544k and had 89 Property Transactions within the last 3 years¹.
Olney is an area in Newport Pagnell, Milton Keynes with 1,111 households², where the most expensive property was sold for £2.29M.
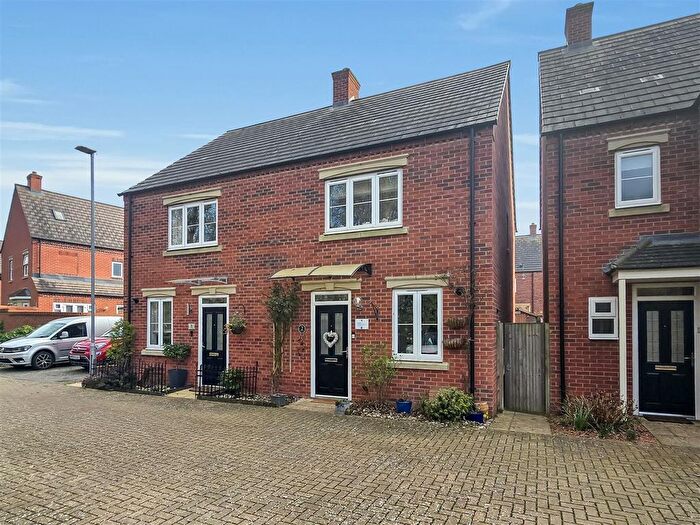
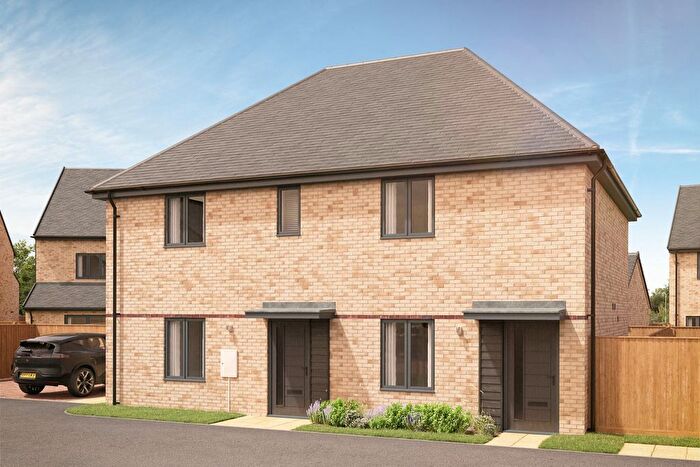
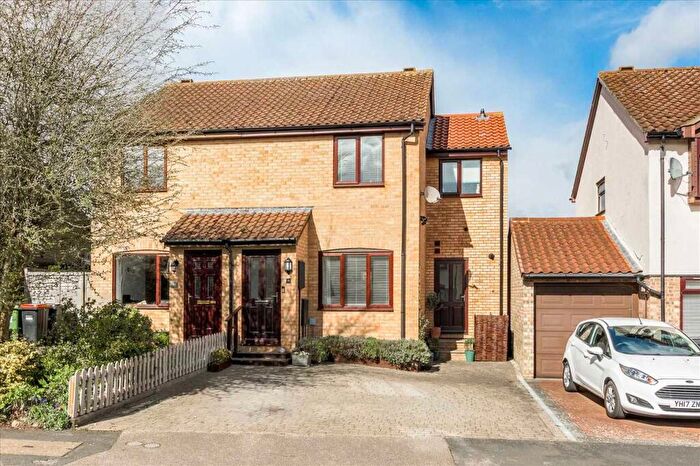
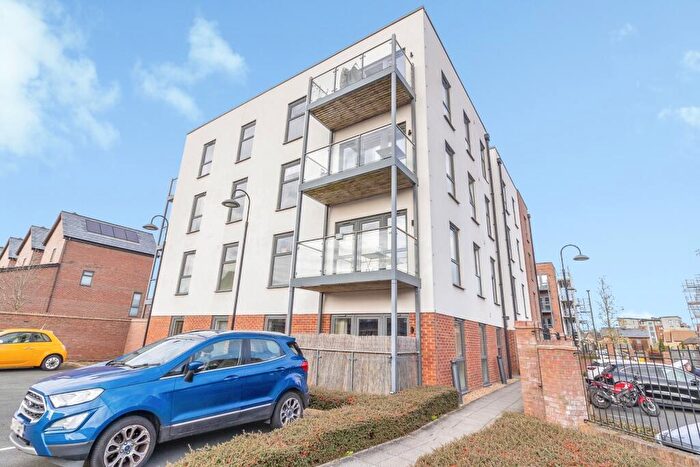
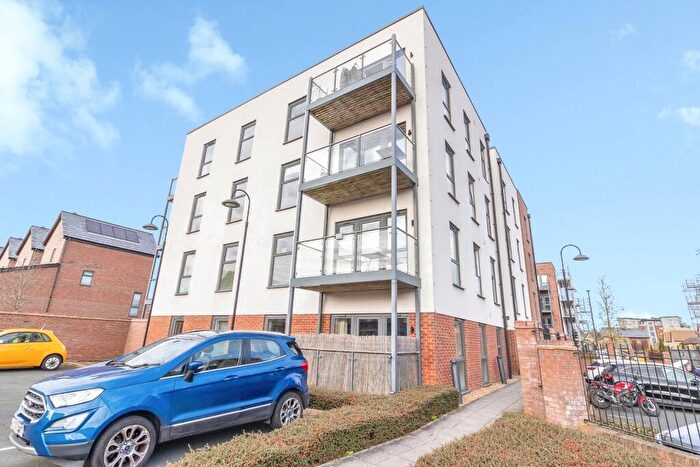
Properties for sale in Olney
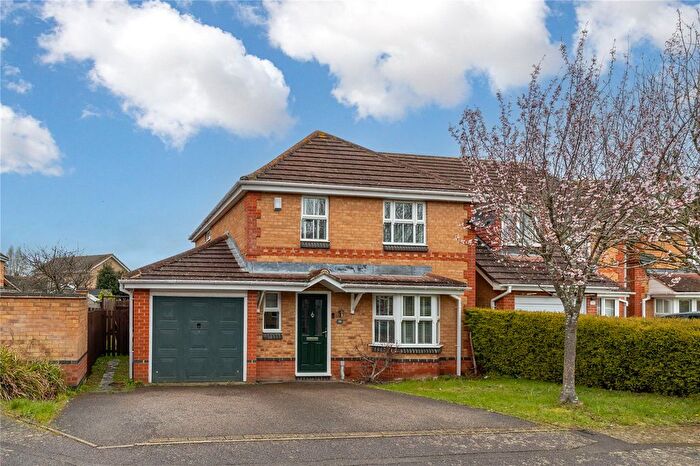
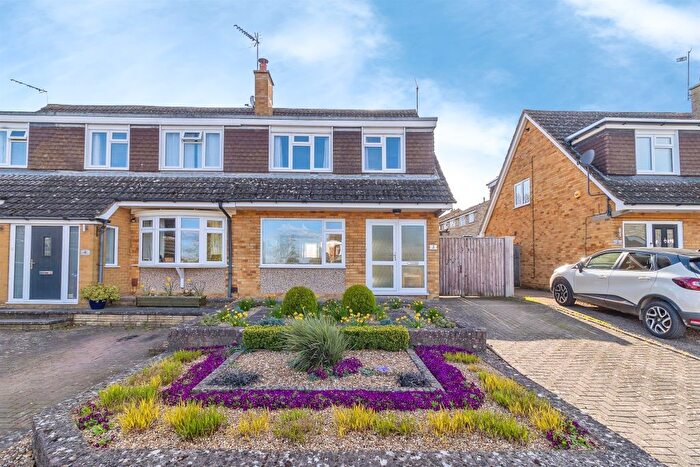
![]()
If you are looking to sell your house, let it out, or receive a property valuation, an expert can help you.
Click the button below to get started.

Roads and Postcodes in Olney
Navigate through our locations to find the location of your next house in Olney, Newport Pagnell for sale or to rent.
| Streets | Postcodes |
|---|---|
| Bakers View | MK16 9FS |
| Bedford Road | MK16 9NG MK16 9NQ |
| Bedlam Lane | MK16 9JF |
| Bedlam Walk | MK16 9JG |
| Broadmead | MK16 9FG |
| Brook End | MK16 9HH |
| Broughton Grounds | MK16 0HZ |
| Broughton Grounds Lane | MK16 0HX |
| Bryans Crescent | MK16 9LR |
| Carters Close | MK16 9NW |
| Chequers Lane | MK16 9LJ |
| Chicheley Hill | MK16 9JA |
| Chicheley Road | MK16 9LP MK16 9HU MK16 9LS |
| Church End | MK16 9PD |
| Church Lane | MK16 8JY |
| Church Road | MK16 9PA MK16 9PB |
| Church Walk | MK16 9LL |
| Compton Court | MK16 0HQ |
| Cranfield Road | MK16 0HB MK16 0HL MK16 0HN MK16 9JU MK16 0FJ MK16 9HP |
| Crofts End | MK16 9ND MK16 9NE |
| East End | MK16 9HW |
| Fences Lane | MK16 9EN |
| Field Close | MK16 9PN |
| Folly Lane | MK16 9LN MK16 9LW |
| Garden Lane | MK16 9ED |
| Glen Fields | MK16 0FE |
| Griggs Orchard | MK16 9PL |
| Gun Lane | MK16 9PE |
| Hackett Place | MK16 9LX |
| Hall Lane | MK16 9JQ |
| Hardmead | MK16 9JY MK16 9JZ MK16 9LB |
| Hazelmead Drive | MK16 9FW |
| High Street | MK16 9HN MK16 9LH MK16 9NA MK16 9NB MK16 9NU MK16 9NX MK16 9NY MK16 9QP |
| Hill View | MK16 9NJ |
| Hurst End | MK16 9HS |
| Kilpin Green | MK16 9LY MK16 9LZ |
| Knoll Close | MK16 9PQ |
| Lewenscroft | MK16 9JN |
| Leys View | MK16 9NL |
| Little End | MK16 9JB |
| London Road | MK16 0JA MK16 0JB |
| Main Road | MK16 9JS |
| Manor Courtyard | MK16 9PR |
| Maryot Close | MK16 9PP |
| Mercers Manor Barns | MK16 9PU |
| Newport Road | MK16 0HP MK16 0HW MK16 9JR MK16 0HR MK16 0HS |
| North Crawley Road | MK16 9HG MK16 9HQ |
| Northampton Road | MK16 8NJ MK16 8QZ |
| Orchard Way | MK16 9LU |
| Park Road | MK16 9PF MK16 9PG |
| Perry Lane | MK16 9NH MK16 9PW |
| Pound Lane | MK16 9HL |
| Pyms Stables | MK16 0FG |
| Red Brick Cottages | MK16 8LE |
| School Lane | MK16 9NF |
| Sherington Road | MK16 8NL |
| Spring Mews | MK16 9FT |
| The Close | MK16 8JZ MK16 9LA |
| The Knoll | MK16 9NZ |
| Tower Close | MK16 9EU |
| Turvey Road | MK16 9JX |
| Village Close | MK16 9PZ |
| Violets Close | MK16 9LG |
| Water Lane | MK16 9NP MK16 9NR MK16 9NT |
| Willen Road | MK16 0JJ MK16 0QE |
| Wood End Lane | MK16 0HD |
| MK16 8JX MK16 8LB MK16 9ES MK16 9ET MK16 9HJ MK16 9JH MK16 9JW MK16 9LT MK16 8LD MK16 8LF MK16 8LX MK16 9EX MK16 9HR MK16 9JD MK16 9JE MK16 9JJ MK16 9JL MK16 9JP MK16 9JT MK16 9NN |
Transport near Olney
-
 Wolverton Station
 -
Woburn Sands Station
-
Aspley Guise Station
-
Milton Keynes Central Station
-
Ridgmont Station
-
Bow Brickhill Station
-
Lidlington Station
-
Fenny Stratford Station
-
Millbrook (Bedfordshire) Station
-
Stewartby Station
- FAQ
- Price Paid By Year
- Property Type Price
Frequently asked questions about Olney
What is the average price for a property for sale in Olney?
The average price for a property for sale in Olney is £544,036. This amount is 45% higher than the average price in Newport Pagnell. There are more than 10,000 property listings for sale in Olney.
What streets have the most expensive properties for sale in Olney?
The streets with the most expensive properties for sale in Olney are Bedford Road at an average of £1,480,500, Wood End Lane at an average of £1,250,000 and Brook End at an average of £870,000.
What streets have the most affordable properties for sale in Olney?
The streets with the most affordable properties for sale in Olney are Chequers Lane at an average of £211,000, Bedlam Walk at an average of £232,500 and Perry Lane at an average of £255,250.
Which train stations are available in or near Olney?
Some of the train stations available in or near Olney are Wolverton, Woburn Sands and Aspley Guise.
Property Price Paid in Olney by Year
The average sold property price by year was:
| Year | Average Sold Price | Price Change |
Sold Properties
|
|---|---|---|---|
| 2025 | £501,308 | -3% |
30 Properties |
| 2024 | £517,773 | -20% |
31 Properties |
| 2023 | £618,892 | -23% |
28 Properties |
| 2022 | £758,208 | 23% |
24 Properties |
| 2021 | £580,936 | 8% |
50 Properties |
| 2020 | £531,922 | 16% |
33 Properties |
| 2019 | £444,232 | -14% |
31 Properties |
| 2018 | £505,750 | 2% |
32 Properties |
| 2017 | £497,533 | 12% |
31 Properties |
| 2016 | £436,883 | -2% |
30 Properties |
| 2015 | £445,485 | 25% |
36 Properties |
| 2014 | £332,141 | 3% |
49 Properties |
| 2013 | £322,956 | -15% |
46 Properties |
| 2012 | £372,894 | 3% |
29 Properties |
| 2011 | £360,183 | -10% |
30 Properties |
| 2010 | £394,543 | 13% |
32 Properties |
| 2009 | £343,574 | -15% |
20 Properties |
| 2008 | £395,401 | 11% |
33 Properties |
| 2007 | £352,167 | 14% |
55 Properties |
| 2006 | £303,480 | -5% |
43 Properties |
| 2005 | £317,952 | 12% |
37 Properties |
| 2004 | £280,891 | -6% |
26 Properties |
| 2003 | £297,428 | 24% |
47 Properties |
| 2002 | £226,836 | 26% |
61 Properties |
| 2001 | £167,985 | -10% |
43 Properties |
| 2000 | £184,485 | 14% |
47 Properties |
| 1999 | £159,276 | 18% |
56 Properties |
| 1998 | £130,238 | 8% |
43 Properties |
| 1997 | £120,144 | -1% |
59 Properties |
| 1996 | £121,181 | 7% |
48 Properties |
| 1995 | £112,905 | - |
34 Properties |
Property Price per Property Type in Olney
Here you can find historic sold price data in order to help with your property search.
The average Property Paid Price for specific property types in the last three years are:
| Property Type | Average Sold Price | Sold Properties |
|---|---|---|
| Semi Detached House | £455,031.00 | 24 Semi Detached Houses |
| Detached House | £644,142.00 | 49 Detached Houses |
| Terraced House | £370,968.00 | 16 Terraced Houses |