
Houses for sale & to rent in MK46 5NS, Short Massey, Olney, Olney
House Prices in MK46 5NS, Short Massey, Olney
Properties in MK46 5NS have no sales history available within the last 3 years. MK46 5NS is a postcode in Short Massey located in Olney, an area in Olney, Milton Keynes, with 7 households².
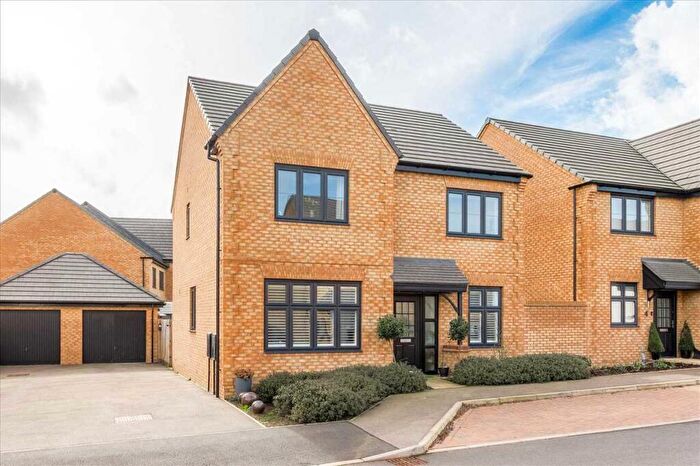
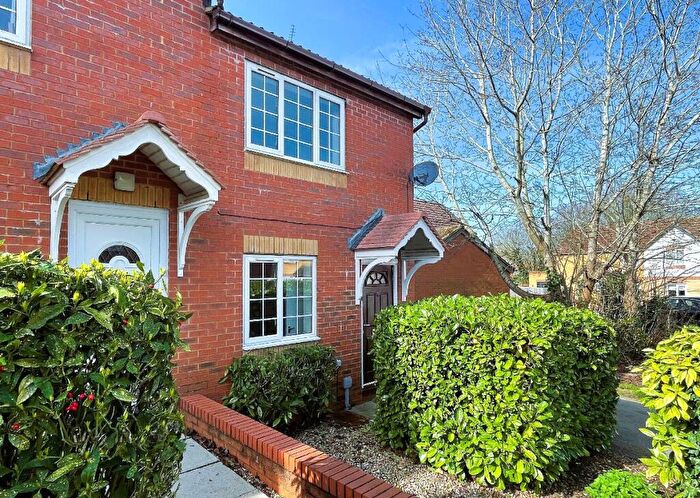
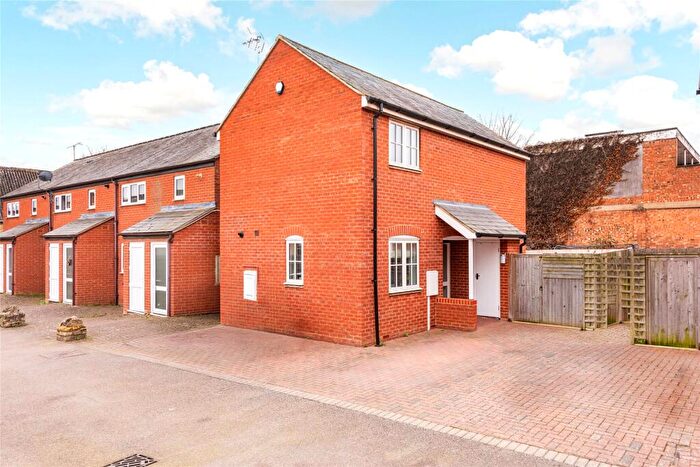
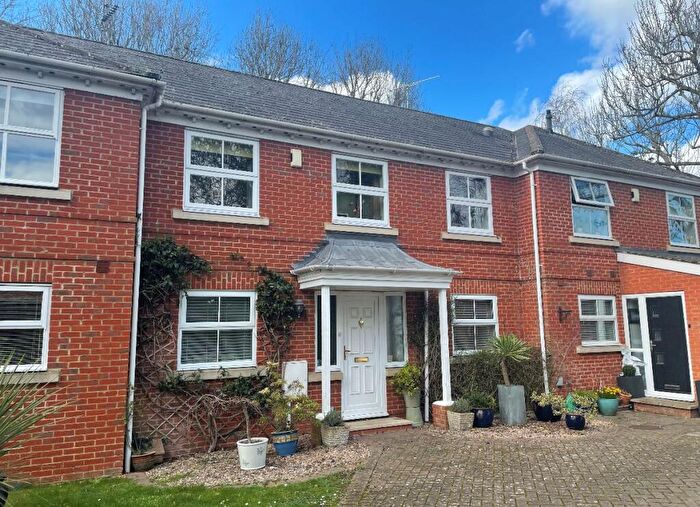
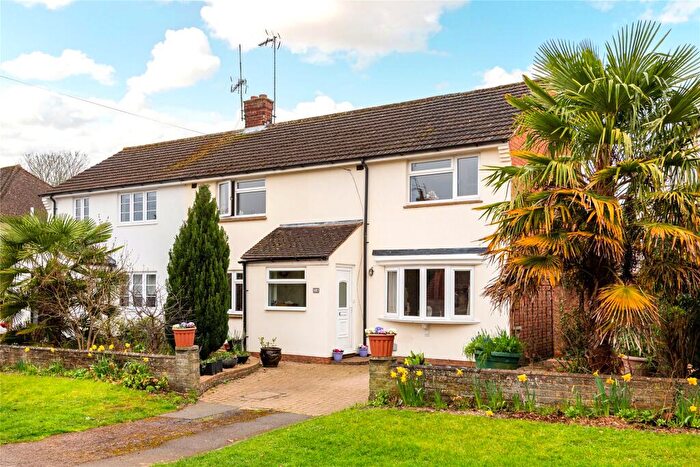
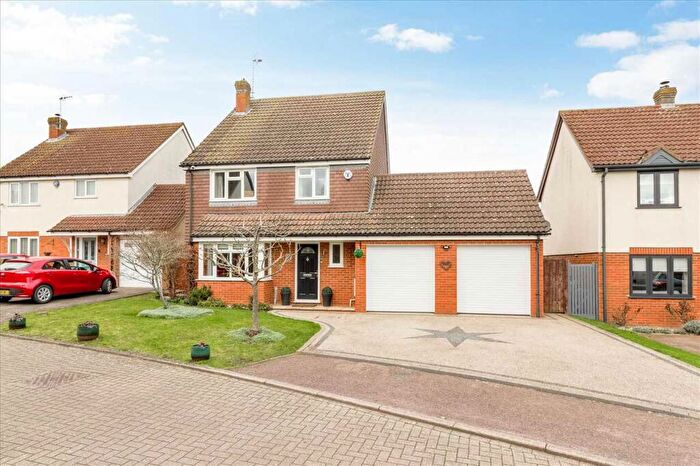
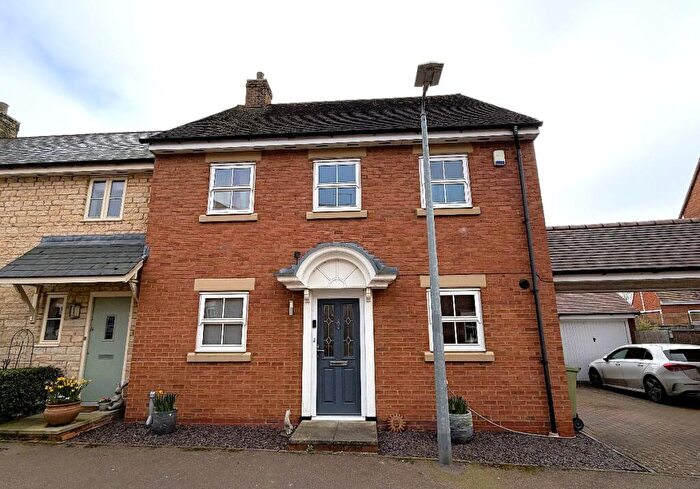
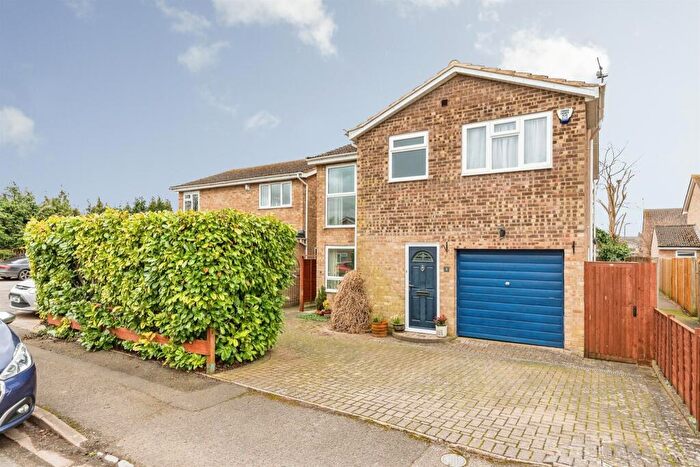
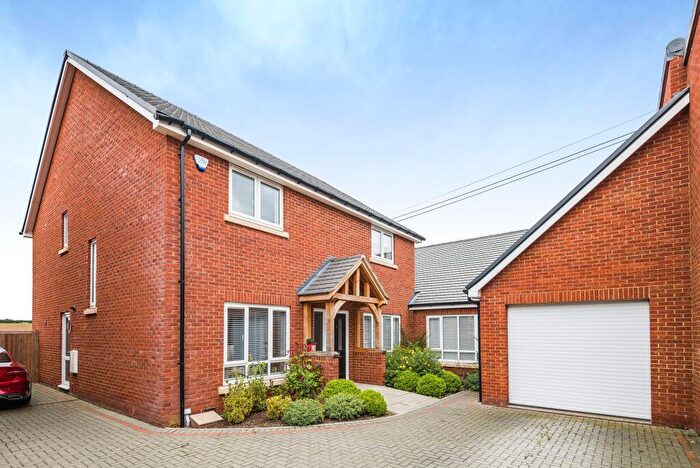
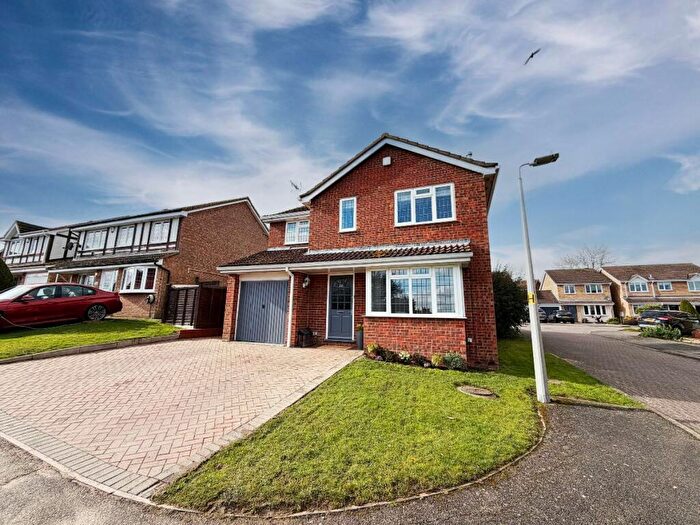
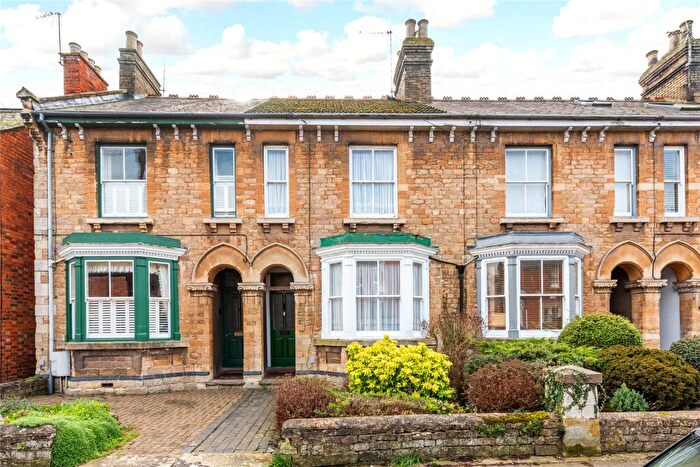
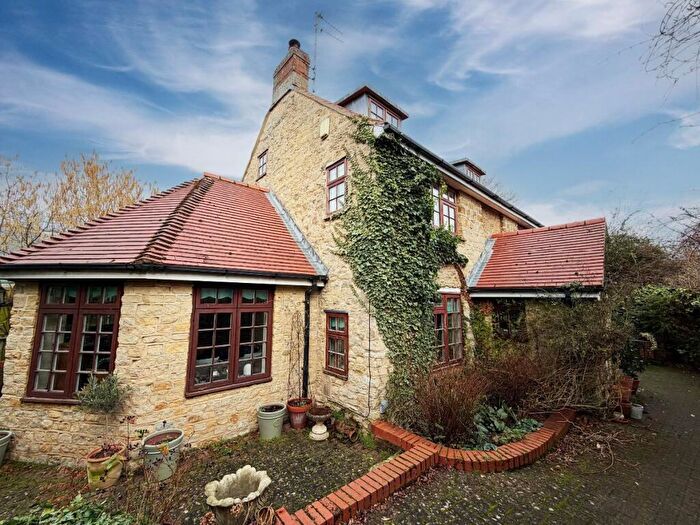
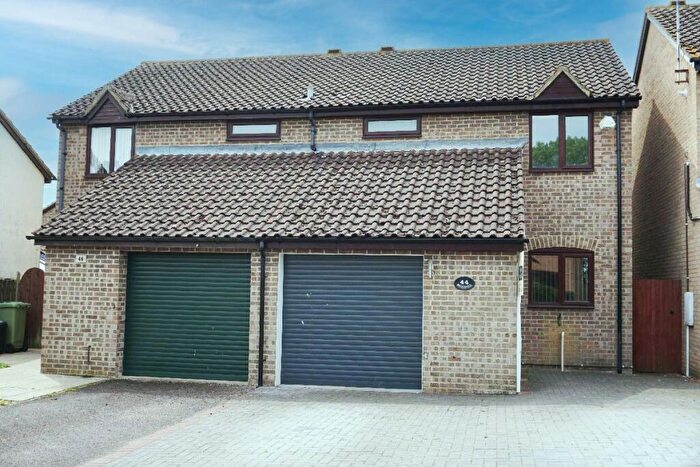
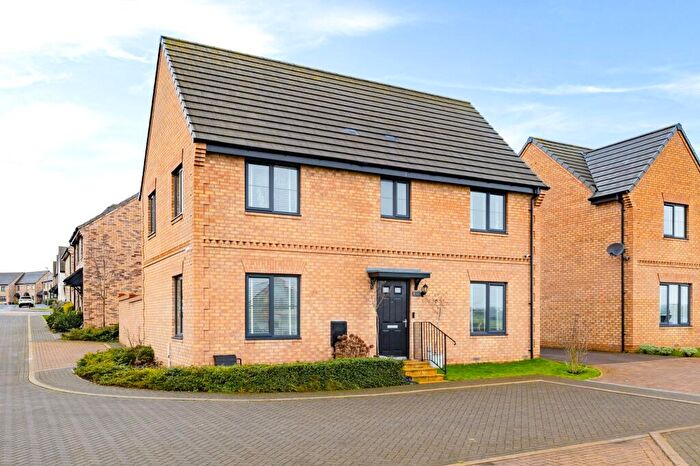
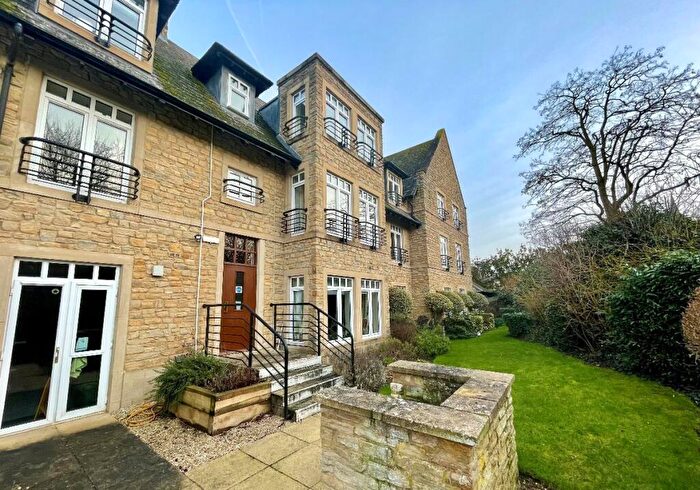
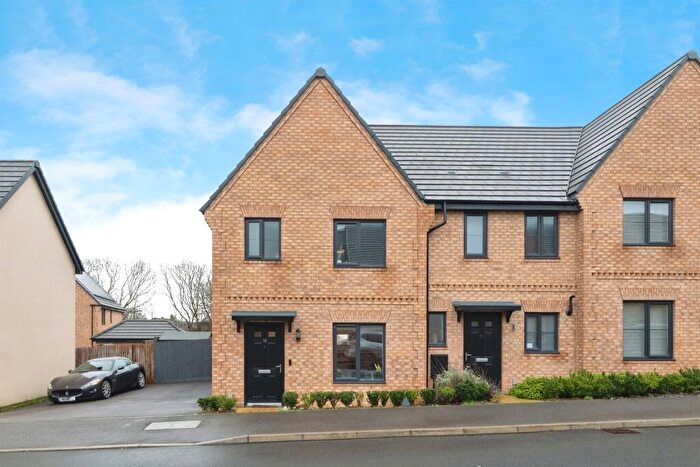
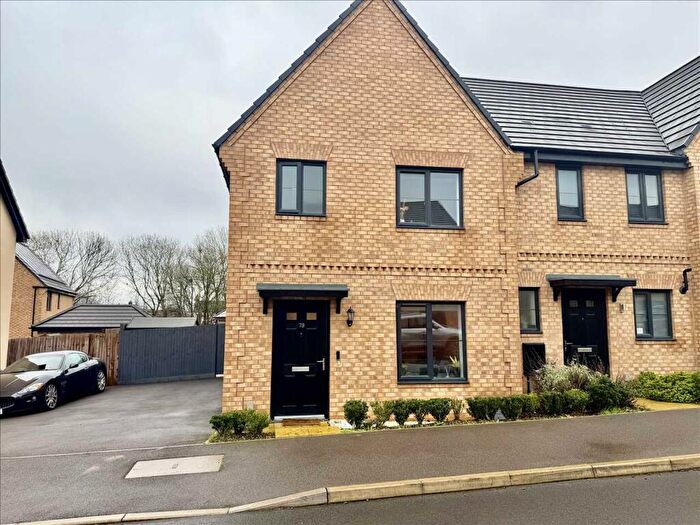
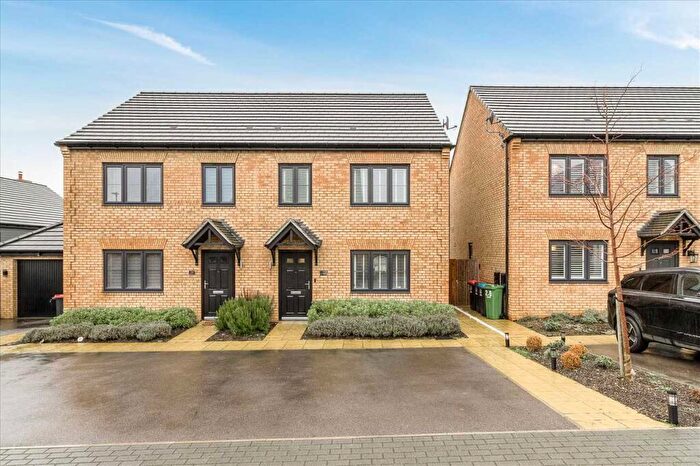
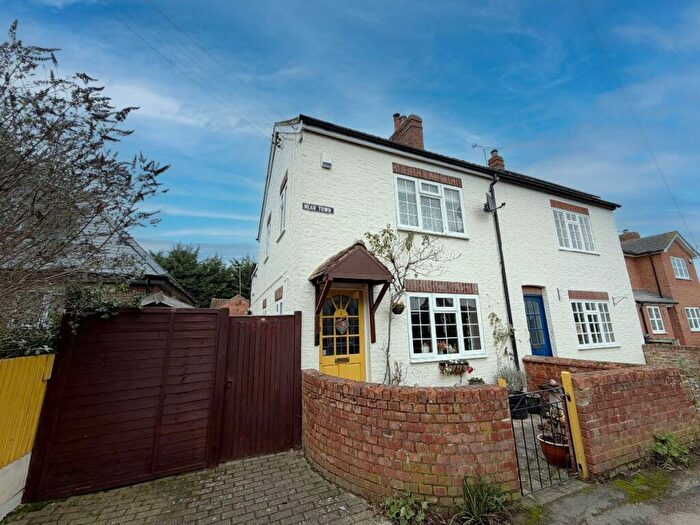
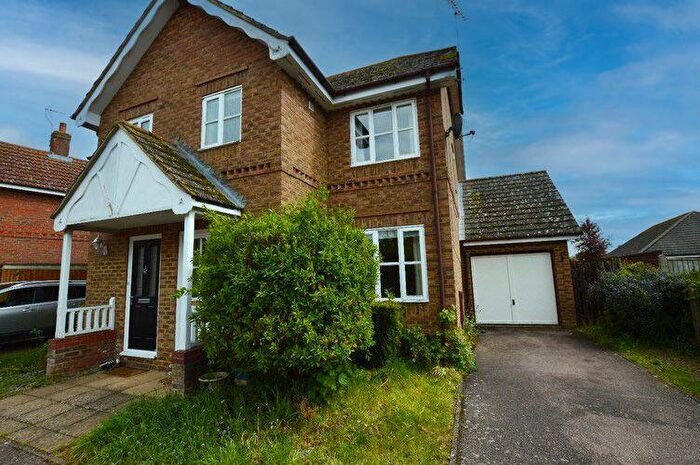
Properties for sale near MK46 5NS, Short Massey
![]()
If you are looking to sell your house, let it out, or receive a property valuation, an expert can help you.
Click the button below to get started.

Price Paid in Short Massey, MK46 5NS, Olney
1 Short Massey, MK46 5NS, Olney Olney
Property 1 has been sold 3 times. The last time it was sold was in 10/03/2021 and the sold price was £410,000.00.
This detached house, sold as a freehold on 10/03/2021, is a 99 sqm detached house with an EPC rating of D.
| Date | Price | Property Type | Tenure | Classification |
|---|---|---|---|---|
| 10/03/2021 | £410,000.00 | Detached House | freehold | Established Building |
| 21/11/2011 | £240,000.00 | Detached House | freehold | Established Building |
| 07/07/1997 | £82,500.00 | Detached House | freehold | Established Building |
5 Short Massey, MK46 5NS, Olney Olney
Property 5 has been sold 2 times. The last time it was sold was in 31/01/2018 and the sold price was £472,000.00.
This is a Detached House which was sold as a freehold in 31/01/2018
| Date | Price | Property Type | Tenure | Classification |
|---|---|---|---|---|
| 31/01/2018 | £472,000.00 | Detached House | freehold | Established Building |
| 10/03/1995 | £94,000.00 | Detached House | freehold | Established Building |
4 Short Massey, MK46 5NS, Olney Olney
Property 4 has been sold 3 times. The last time it was sold was in 19/02/2016 and the sold price was £432,500.00.
This detached house, sold as a freehold on 19/02/2016, is a 145 sqm detached house with an EPC rating of D.
| Date | Price | Property Type | Tenure | Classification |
|---|---|---|---|---|
| 19/02/2016 | £432,500.00 | Detached House | freehold | Established Building |
| 04/03/2015 | £401,000.00 | Detached House | freehold | Established Building |
| 14/02/1995 | £88,000.00 | Detached House | freehold | Established Building |
7 Short Massey, MK46 5NS, Olney Olney
Property 7 has been sold 2 times. The last time it was sold was in 26/06/2013 and the sold price was £320,000.00.
This detached house, sold as a freehold on 26/06/2013, is a 122 sqm detached house with an EPC rating of D.
| Date | Price | Property Type | Tenure | Classification |
|---|---|---|---|---|
| 26/06/2013 | £320,000.00 | Detached House | freehold | Established Building |
| 12/01/1996 | £91,000.00 | Detached House | freehold | Established Building |
6 Short Massey, MK46 5NS, Olney Olney
Property 6 has been sold 1 time. The last time it was sold was in 13/12/2006 and the sold price was £300,000.00.
This is a Detached House which was sold as a freehold in 13/12/2006
| Date | Price | Property Type | Tenure | Classification |
|---|---|---|---|---|
| 13/12/2006 | £300,000.00 | Detached House | freehold | Established Building |
3 Short Massey, MK46 5NS, Olney Olney
Property 3 has been sold 1 time. The last time it was sold was in 03/02/2006 and the sold price was £282,500.00.
This detached house, sold as a freehold on 03/02/2006, is a 135 sqm detached house with an EPC rating of D.
| Date | Price | Property Type | Tenure | Classification |
|---|---|---|---|---|
| 03/02/2006 | £282,500.00 | Detached House | freehold | Established Building |
2 Short Massey, MK46 5NS, Olney Olney
Property 2 has been sold 1 time. The last time it was sold was in 03/10/1996 and the sold price was £89,000.00.
This is a Detached House which was sold as a freehold in 03/10/1996
| Date | Price | Property Type | Tenure | Classification |
|---|---|---|---|---|
| 03/10/1996 | £89,000.00 | Detached House | freehold | Established Building |
Transport near MK46 5NS, Short Massey
-
 Wolverton Station
 -
Milton Keynes Central Station
-
Northampton Station
-
Kempston Hardwick Station
-
Bedford Midland Station
House price paid reports for MK46 5NS, Short Massey
Click on the buttons below to see price paid reports by year or property price:
- Price Paid By Year
Property Price Paid in MK46 5NS, Short Massey by Year
The average sold property price by year was:
| Year | Average Sold Price | Price Change |
Sold Properties
|
|---|---|---|---|
| 2021 | £410,000 | -15% |
1 Property |
| 2018 | £472,000 | 8% |
1 Property |
| 2016 | £432,500 | 7% |
1 Property |
| 2015 | £401,000 | 20% |
1 Property |
| 2013 | £320,000 | 25% |
1 Property |
| 2011 | £240,000 | -21% |
1 Property |
| 2006 | £291,250 | 72% |
2 Properties |
| 1997 | £82,500 | -9% |
1 Property |
| 1996 | £90,000 | -1% |
2 Properties |
| 1995 | £91,000 | - |
2 Properties |