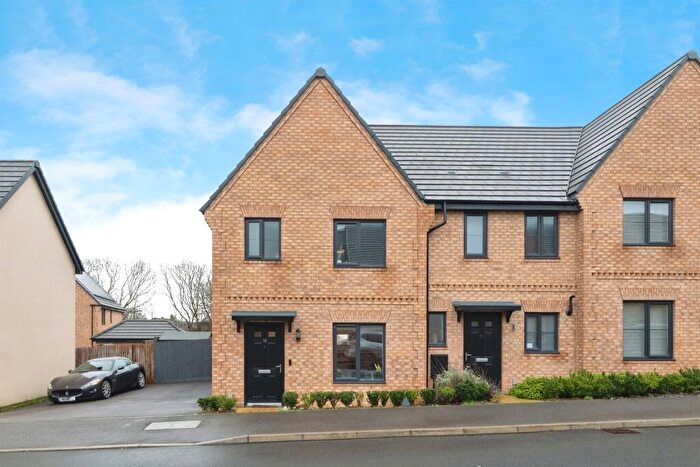
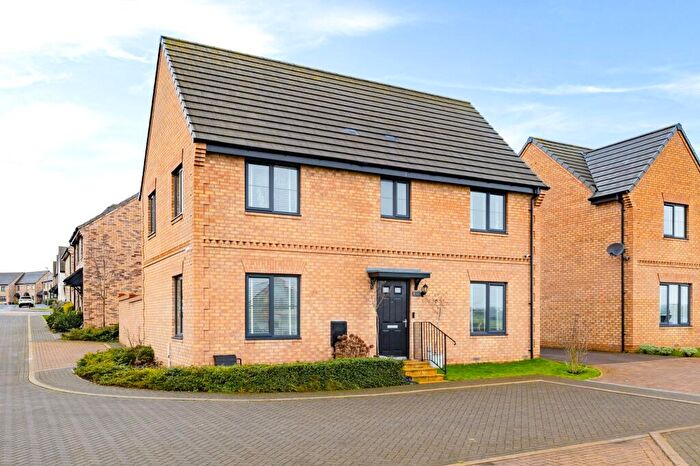
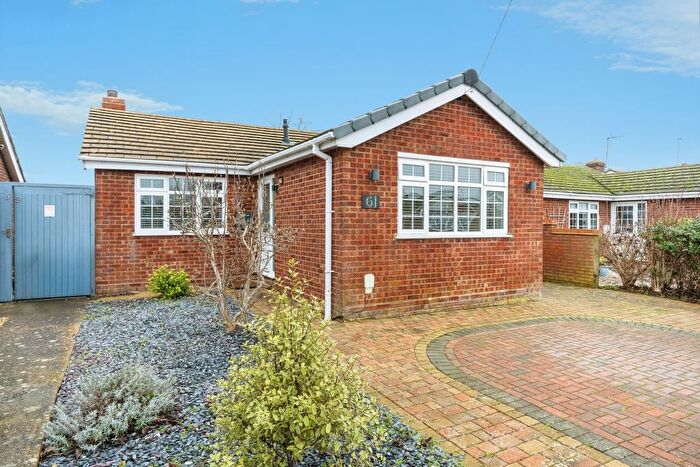
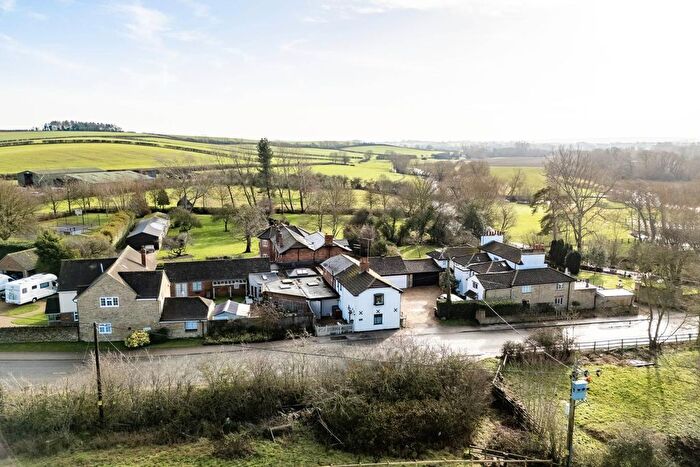
Houses for sale & to rent in Olney, Olney
House Prices in Olney
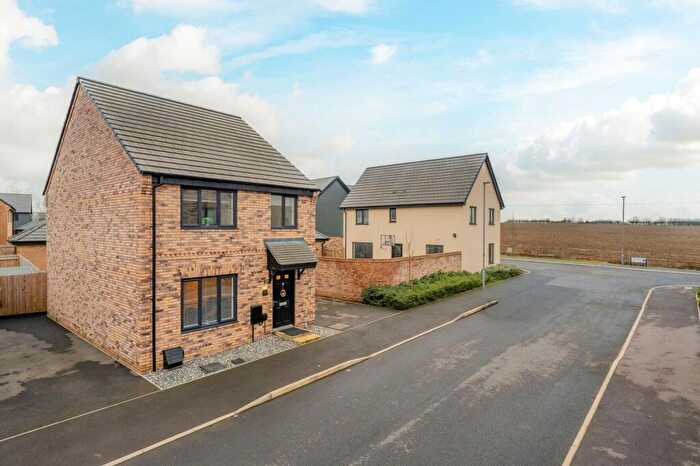
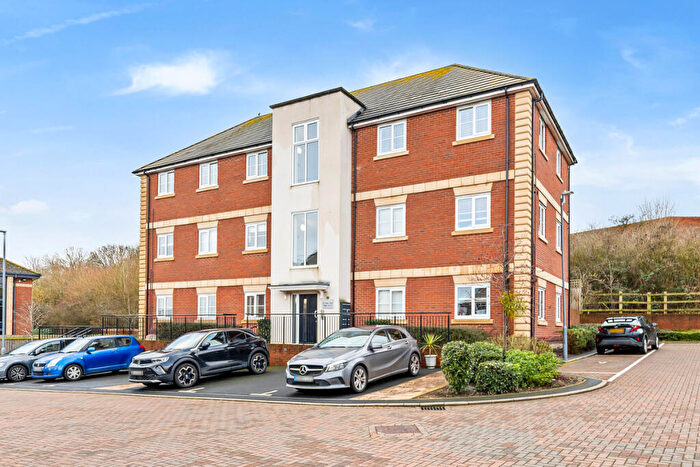
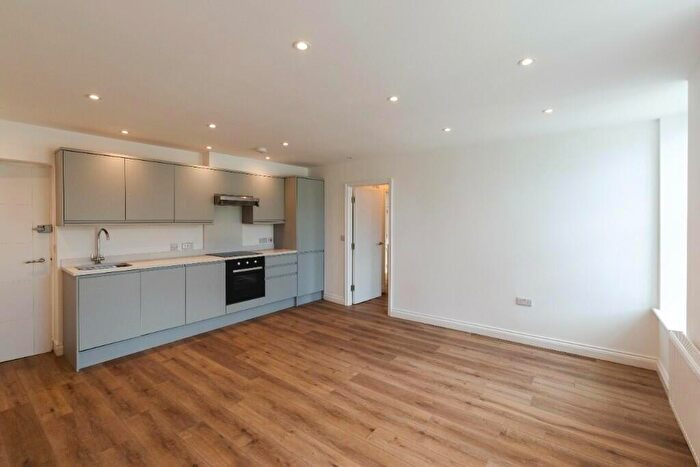
Properties in Olney have an average house price of £432,405.00 and had 438 Property Transactions within the last 3 years¹.
Olney is an area in Olney, Milton Keynes with 3,827 households², where the most expensive property was sold for £1,625,000.00.
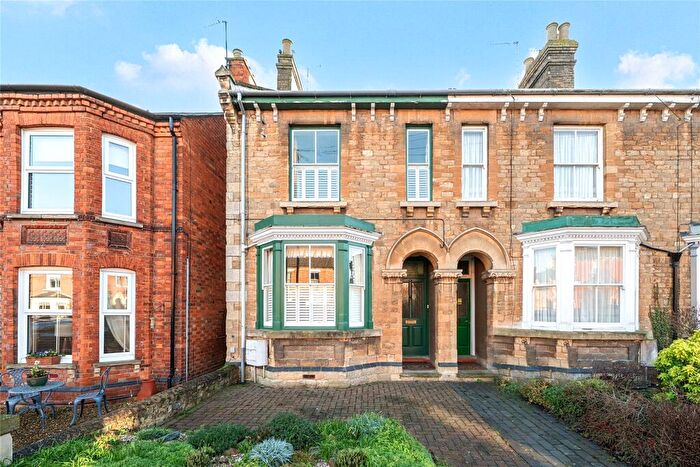
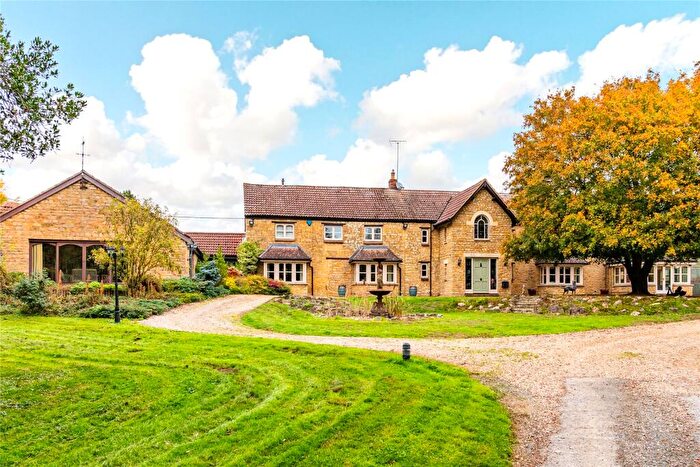
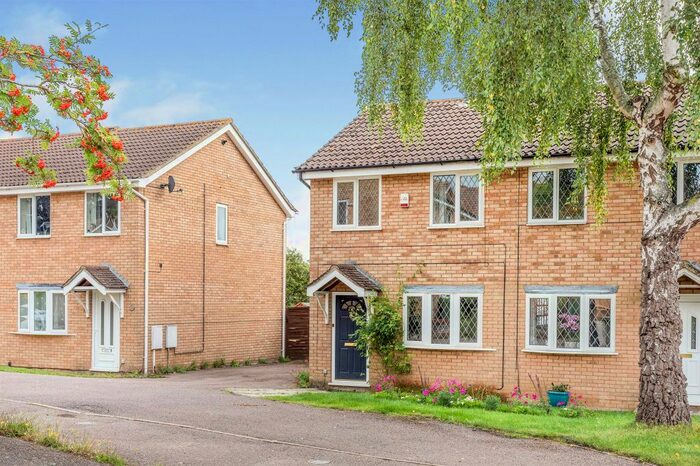
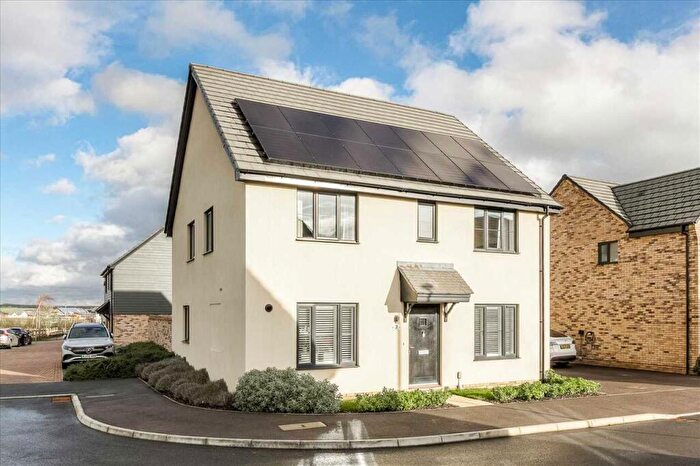
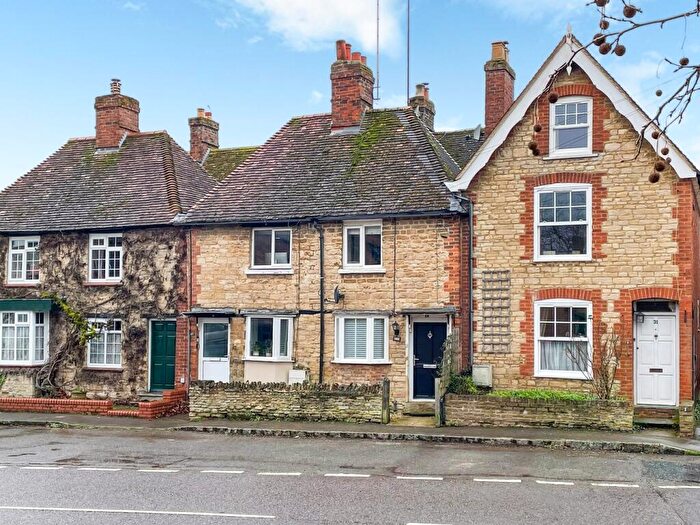
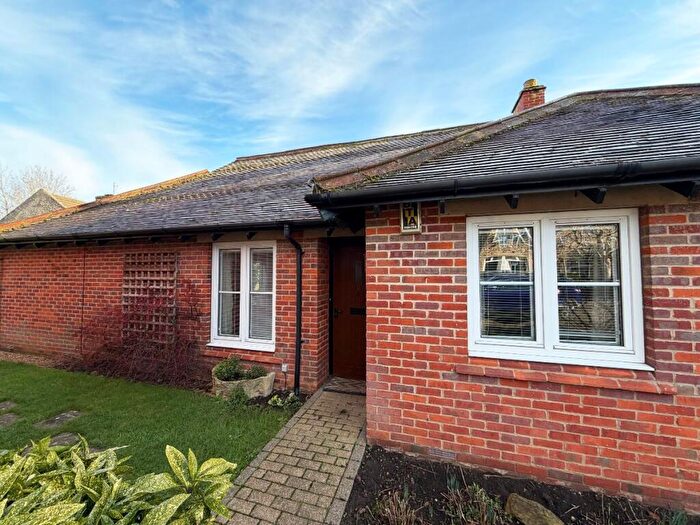
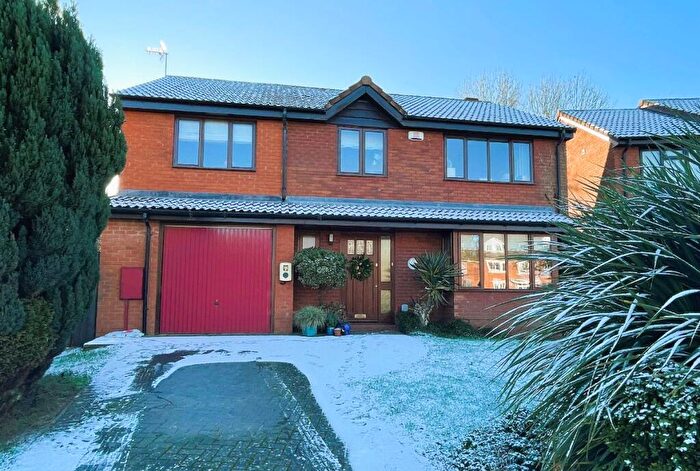
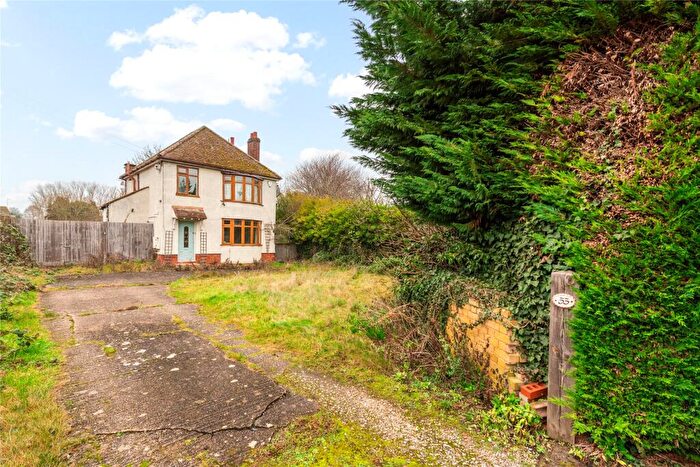
Properties for sale in Olney
Roads and Postcodes in Olney
Navigate through our locations to find the location of your next house in Olney, Olney for sale or to rent.
| Streets | Postcodes |
|---|---|
| Abbey Way | MK46 5AP |
| Anding Close | MK46 5QL |
| Ashlea | MK46 5HW |
| Aspreys | MK46 5LN MK46 5LW |
| Austen Avenue | MK46 4DL |
| Bacon Hill | MK46 5QJ |
| Battle Close | MK46 5BT |
| Bay Lane | MK46 5AT |
| Bedford Road | MK46 4HD MK46 4HR |
| Bedford Road East | MK46 4HW |
| Beech Avenue | MK46 5AE |
| Berrells Court | MK46 4AR |
| Bridge Street | MK46 4AB |
| Brittens Court | MK46 5LG |
| Carey Way | MK46 4DR |
| Castle Road | MK46 4JD MK46 4JE MK46 4JG |
| Chantry Rise | MK46 5FE |
| Chaseport Close | MK46 5AG |
| Cherry Orchard | MK46 5PT |
| Church Lane | MK46 5DD |
| Church Street | MK46 4AD |
| Clay Pit Lane | MK46 5FQ |
| Clifton Court | MK46 4AW |
| Cobbs Court | MK46 5QN |
| Cobbs Garden | MK46 5QE MK46 5QG |
| Colsons Way | MK46 5EQ |
| Common Street | MK46 5AR MK46 5AS |
| Coneygere | MK46 4AE MK46 4AF |
| Court Corner | MK46 5QH |
| Cowper Street | MK46 4BW |
| Cowpers Orchard | MK46 5QA |
| Crab Tree Close | MK46 5DU |
| Cross Lane | MK46 5LD |
| Dagnall Road | MK46 5BJ |
| Dartmouth Road | MK46 4BH MK46 4EH |
| Dells | MK46 5HY |
| Dickens Spinney | MK46 5PW |
| Dinglederry | MK46 5ES MK46 5ET MK46 5EU MK46 5HA |
| East Street | MK46 4AP MK46 4BT MK46 4DA MK46 4DH MK46 4DJ MK46 4DW MK46 4DE |
| Elmlea Drive | MK46 5HU MK46 5HX |
| Fairfield Close | MK46 4DP |
| Ferne Furlong | MK46 5EN |
| Fishermans Close | MK46 5PA |
| Flaggs Meadow | MK46 5NL |
| Flaxlands Row | MK46 5NU |
| Fountain Court | MK46 4DG |
| Foxhill | MK46 5AZ MK46 5DE MK46 5DF MK46 5DG MK46 5DQ MK46 5EE MK46 5HE MK46 5HF MK46 5HG MK46 5PE MK46 5PF MK46 5PG |
| Freemans Gardens | MK46 4AU |
| Gilpin Way | MK46 4DN |
| Gravel Walk | MK46 5JA |
| Gregory Court | MK46 4DQ |
| Guinea Orchard | MK46 5PD |
| Harrold Road | MK46 4HU MK46 4HX |
| Harvey Drive | MK46 5DL |
| Hawkswood | MK46 5NB |
| Heritage Court | MK46 5FW |
| High Street | MK46 4BB MK46 4BE MK46 4EB MK46 4EF MK46 4EX MK46 4HA MK46 5DH MK46 5JB MK46 5JR MK46 5JS |
| High Street South | MK46 4AA |
| Hipwell Court | MK46 5QB |
| Holes Lane | MK46 4BX |
| Hollow Wood | MK46 5LY MK46 5LZ |
| Honey Hill | MK46 5LT |
| Hoppers Hill | MK46 5FN |
| Hulton Drive | MK46 5BS MK46 5BW MK46 5BY |
| Jacks Close | MK46 4HQ |
| Johnsons Field | MK46 5JF |
| Joiners Way | MK46 4JF |
| Kippell Hill | MK46 5ER |
| Kitchener Close | MK46 4JH |
| Knights Close | MK46 4JL |
| Lace Mews | MK46 4JS |
| Langlands | MK46 4EL MK46 4EP |
| Lavendon Road | MK46 4HJ MK46 4DF MK46 4FA MK46 4HH |
| Lilly Hill | MK46 5EZ |
| Lime Street | MK46 5BA |
| Long Lane | MK46 5HL |
| Long Massey | MK46 5NR |
| Longmire | MK46 4EG |
| Manor Court | MK46 5NJ |
| Market Place | MK46 4BA MK46 4AJ MK46 4EA |
| Maybush Walk | MK46 5NA |
| Meadow Court | MK46 5NT |
| Midland Road | MK46 4BL MK46 4BP |
| Mobbs Close | MK46 4DZ |
| Moores Hill | MK46 5DY |
| Morgans Yard | MK46 4DY |
| Mow Mead | MK46 5EF |
| Near Town | MK46 4AN |
| Near Town Gardens | MK46 4AZ |
| New Row | MK46 4EZ |
| Newport Road | MK46 5JD MK46 5JG MK46 5JH |
| Newton Road | MK46 5DN MK46 5DP MK46 5JJ MK46 5JW |
| Newton Street | MK46 4BS |
| North End | MK46 5AN MK46 5AW |
| Northampton Road | MK46 4EY |
| Oakdown Crescent | MK46 5BG |
| Old Brickyard Close | MK46 4EN |
| Olney Road | MK46 4ER MK46 4ES MK46 4ET MK46 4EU MK46 5BU MK46 5BX MK46 5JZ MK46 5FJ |
| Orchard Rise | MK46 5HB |
| Orchard Walk | MK46 4HE |
| Osborns Court | MK46 4LA |
| Osier Way | MK46 5FP |
| Overhills | MK46 5PP |
| Oxleys | MK46 5PH MK46 5PJ |
| Palmers Road | MK46 4JX MK46 4JY |
| Paxton Close | MK46 5PR |
| Pebody Place | MK46 5FL |
| Petsoe End | MK46 5JL MK46 5JN |
| Pevers Lane | MK46 5JT |
| Prospect Place | MK46 5JQ |
| Rabans Close | MK46 5NG |
| Ravenstone Mill Road | MK46 5FX |
| Rectory Orchard | MK46 4HB |
| Rivetts Close | MK46 5PB |
| Rose Court | MK46 4BY |
| Short Massey | MK46 5NS |
| Sillswood | MK46 5PL MK46 5PN |
| Silver End | MK46 4AL |
| Slatepits Croft | MK46 5NF |
| Snelson | MK46 4JA MK46 4JB |
| Soames Close | MK46 4EJ |
| Spinney Hill Road | MK46 5AB MK46 5AD |
| Spring Lane | MK46 5BP MK46 5DS MK46 5HS MK46 5HT MK46 5BL MK46 5BN |
| Springfield Road | MK46 5HN |
| St Josephs Close | MK46 5HD |
| Stanley Court | MK46 5NH |
| Stewarts Lane | MK46 5FR |
| Stilebrook Road | MK46 5EA |
| Stocken Close | MK46 5PU |
| Stoke Goldington Road | MK46 5AU |
| Stone Court | MK46 5ND |
| Stone Pit Close | MK46 5LX |
| Stonemasons Close | MK46 5FF |
| Swains Court | MK46 4EQ |
| Swallow Close | MK46 5FT |
| Swan Court | MK46 4JP |
| Talbots Hyde | MK46 5NP |
| The Close | MK46 5AJ MK46 5JP |
| The Forge | MK46 5BZ |
| The Galleries | MK46 4DX |
| The Glebe | MK46 4HF MK46 4HG MK46 4HY |
| The Maltings | MK46 4AT |
| The Mansions | MK46 5JU |
| The Old Mews | MK46 5GW |
| The Paddock | MK46 5DJ |
| The Pyghtle | MK46 5PS |
| The Rickyard | MK46 5LQ |
| The Salt Box | MK46 4DS |
| The Task | MK46 4DB |
| Thornlea Croft | MK46 5HZ |
| Timpsons Row | MK46 4JJ |
| Wagstaff Way | MK46 5FB MK46 5FD |
| Warrington Crossroads | MK46 4JQ |
| Warrington Road | MK46 4DT MK46 4DU |
| Warwick Terrace | MK46 4BU |
| Wellingborough Road | MK46 4BG MK46 4BJ MK46 4DD |
| West Farm Way | MK46 5QP |
| West Lane | MK46 5DA |
| West Side Rise | MK46 5HP |
| West Street | MK46 5EP MK46 5HH MK46 5HJ MK46 5HR |
| Weston Road | MK46 5AA MK46 5AF MK46 5BD MK46 5BE MK46 5BH MK46 5BQ MK46 5AL |
| Westpits | MK46 5DB |
| White Hill | MK46 5AY |
| Whitmees Close | MK46 5PQ |
| Wood Lane | MK46 5JY MK46 5JX |
| Woodpits Lane | MK46 5NE |
| Yardley Road | MK46 5DX MK46 5DZ MK46 5ED MK46 5EH MK46 5EJ MK46 5EL MK46 5FS |
| MK46 4HL MK46 4HS MK46 5AX MK46 5DR MK46 5DT MK46 5LA MK46 4HN MK46 4HP MK46 4HT MK46 5DW MK46 5EX MK46 5LB MK46 5LF |
Transport near Olney
-
Wolverton Station
-
Milton Keynes Central Station
-
Kempston Hardwick Station
-
Bedford Midland Station
-
Woburn Sands Station
-
Aspley Guise Station
-
Stewartby Station
-
Lidlington Station
- FAQ
- Price Paid By Year
- Property Type Price
Frequently asked questions about Olney
What is the average price for a property for sale in Olney?
The average price for a property for sale in Olney is £432,405. There are 1,387 property listings for sale in Olney.
What streets have the most expensive properties for sale in Olney?
The streets with the most expensive properties for sale in Olney are The Paddock at an average of £1,400,000, Church Street at an average of £1,086,250 and Orchard Rise at an average of £925,000.
What streets have the most affordable properties for sale in Olney?
The streets with the most affordable properties for sale in Olney are Hoppers Hill at an average of £144,666, Berrells Court at an average of £150,000 and Slatepits Croft at an average of £187,250.
Which train stations are available in or near Olney?
Some of the train stations available in or near Olney are Wolverton, Milton Keynes Central and Kempston Hardwick.
Property Price Paid in Olney by Year
The average sold property price by year was:
| Year | Average Sold Price | Price Change |
Sold Properties
|
|---|---|---|---|
| 2025 | £400,826 | -4% |
127 Properties |
| 2024 | £418,542 | -13% |
162 Properties |
| 2023 | £474,395 | 4% |
149 Properties |
| 2022 | £456,002 | 2% |
161 Properties |
| 2021 | £449,114 | 4% |
222 Properties |
| 2020 | £433,056 | 15% |
148 Properties |
| 2019 | £368,873 | -6% |
144 Properties |
| 2018 | £390,033 | 3% |
165 Properties |
| 2017 | £379,490 | -7% |
156 Properties |
| 2016 | £406,315 | 16% |
160 Properties |
| 2015 | £340,923 | 10% |
150 Properties |
| 2014 | £305,207 | 16% |
170 Properties |
| 2013 | £255,684 | -13% |
146 Properties |
| 2012 | £289,268 | 11% |
120 Properties |
| 2011 | £257,662 | -10% |
139 Properties |
| 2010 | £283,557 | 10% |
155 Properties |
| 2009 | £256,534 | -5% |
131 Properties |
| 2008 | £270,545 | -3% |
146 Properties |
| 2007 | £277,739 | 9% |
272 Properties |
| 2006 | £253,776 | 2% |
324 Properties |
| 2005 | £248,762 | 9% |
203 Properties |
| 2004 | £225,707 | 4% |
219 Properties |
| 2003 | £215,926 | 5% |
218 Properties |
| 2002 | £204,551 | 25% |
279 Properties |
| 2001 | £153,173 | 10% |
259 Properties |
| 2000 | £137,177 | 16% |
282 Properties |
| 1999 | £114,648 | 16% |
312 Properties |
| 1998 | £96,743 | 5% |
228 Properties |
| 1997 | £92,192 | 10% |
279 Properties |
| 1996 | £82,529 | -6% |
282 Properties |
| 1995 | £87,087 | - |
280 Properties |
Property Price per Property Type in Olney
Here you can find historic sold price data in order to help with your property search.
The average Property Paid Price for specific property types in the last three years are:
| Property Type | Average Sold Price | Sold Properties |
|---|---|---|
| Flat | £191,856.00 | 28 Flats |
| Semi Detached House | £365,124.00 | 112 Semi Detached Houses |
| Detached House | £582,704.00 | 178 Detached Houses |
| Terraced House | £328,387.00 | 120 Terraced Houses |

