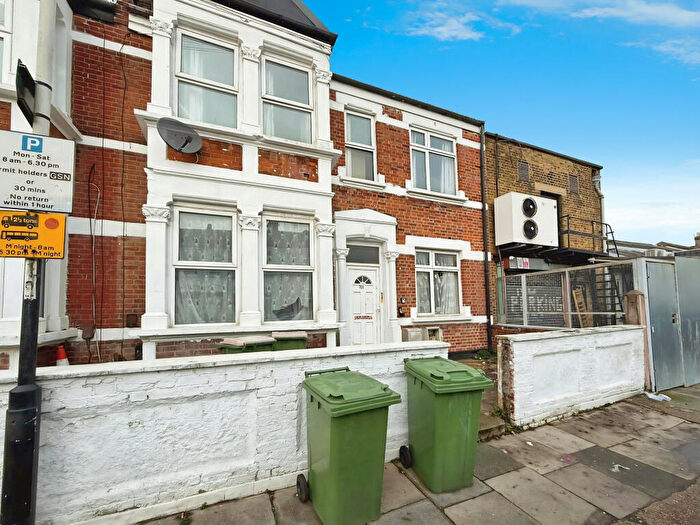
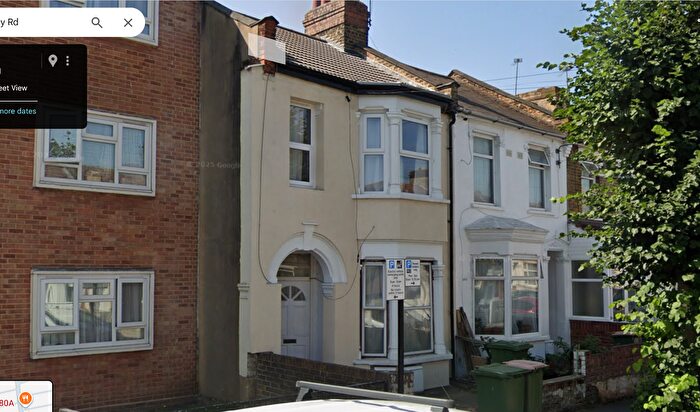
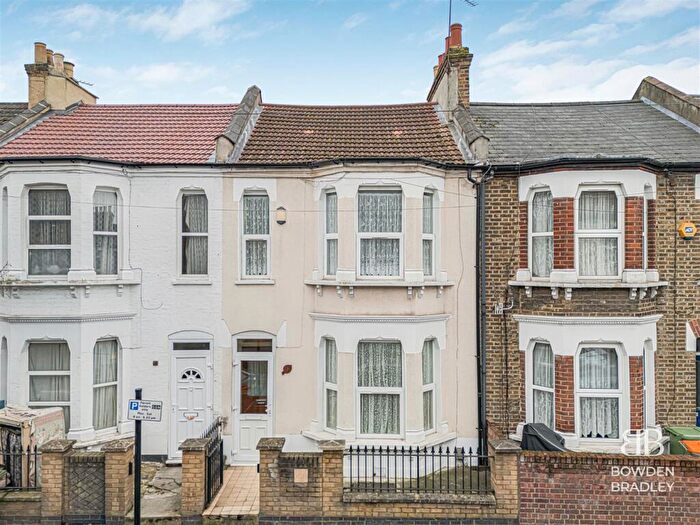
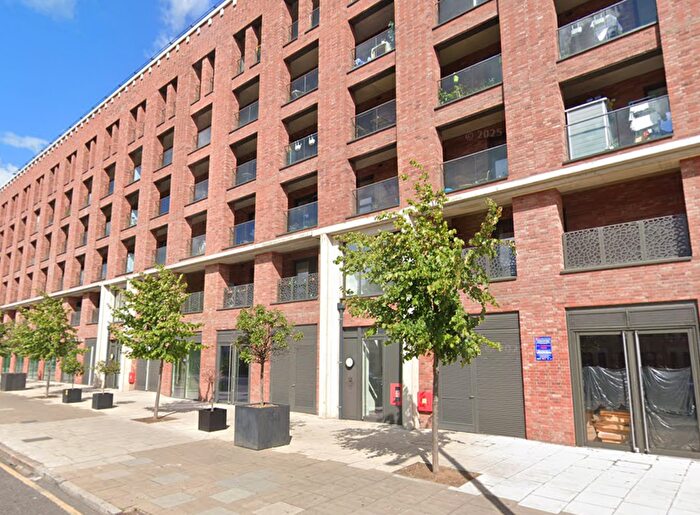
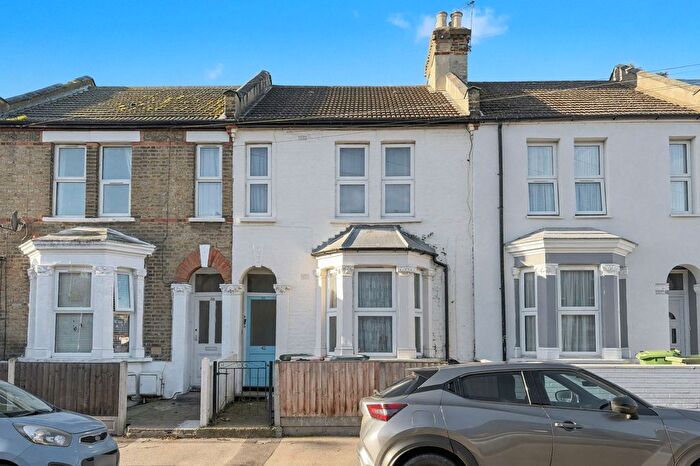
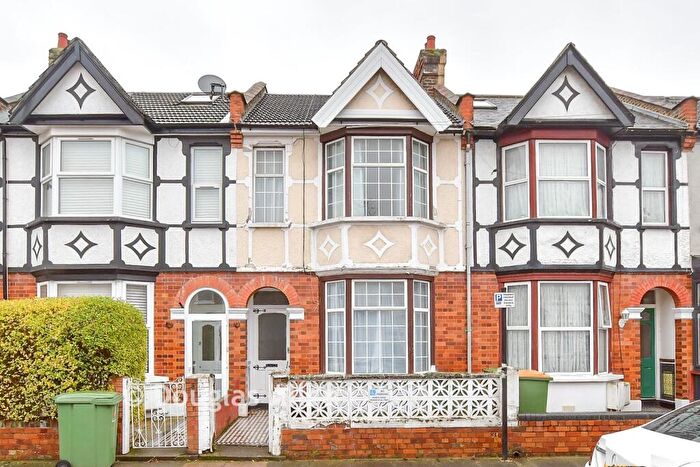
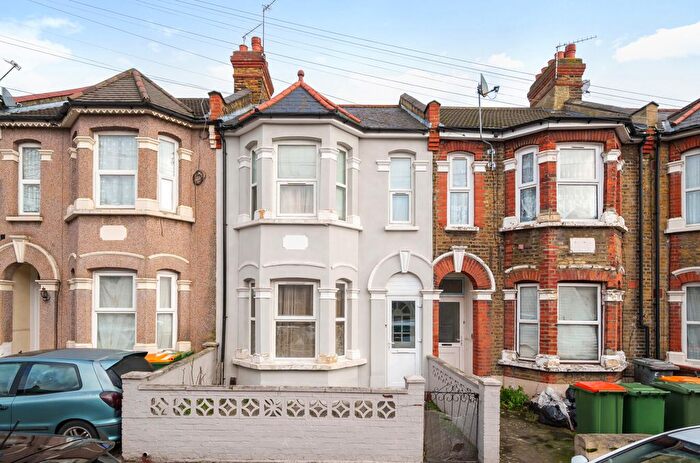
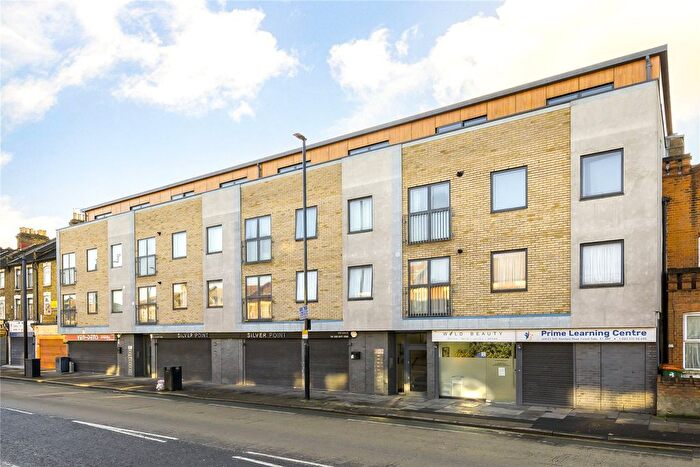
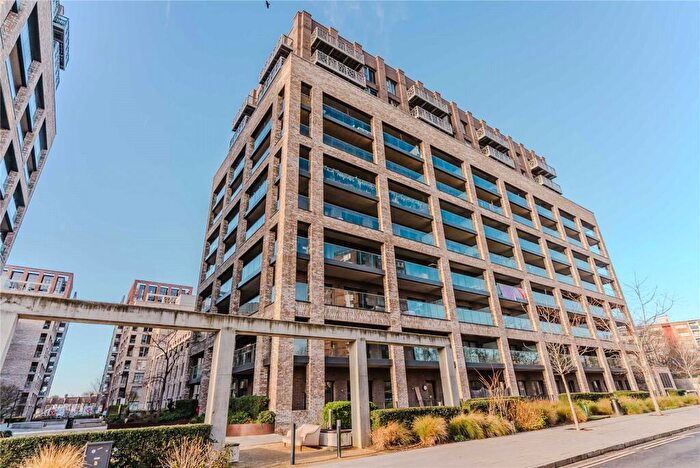
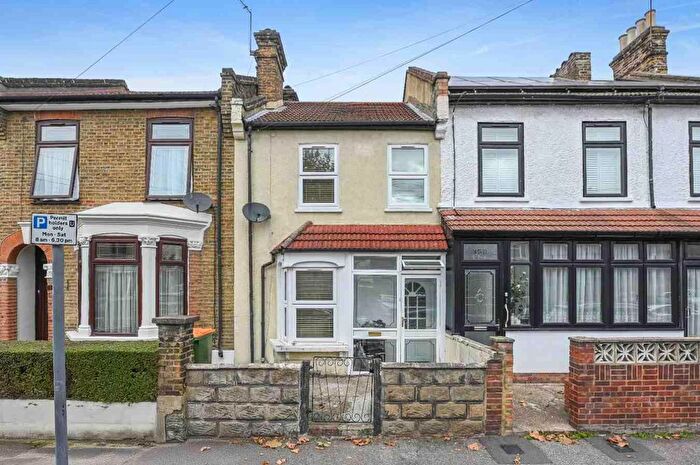
Houses for sale & to rent in Green Street East, London
House Prices in Green Street East
Properties in this part of Green Street East within London have an average house price of £419,463.00 and had 225 Property Transactions within the last 3 years¹. This area has 4,229 households² , where the most expensive property was sold for £724,000.00.
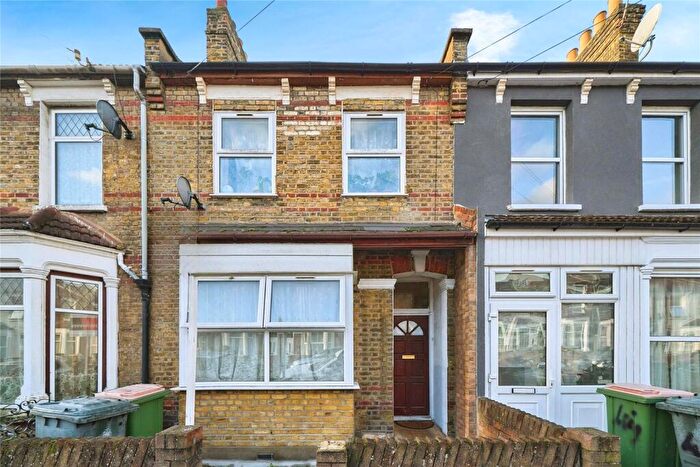
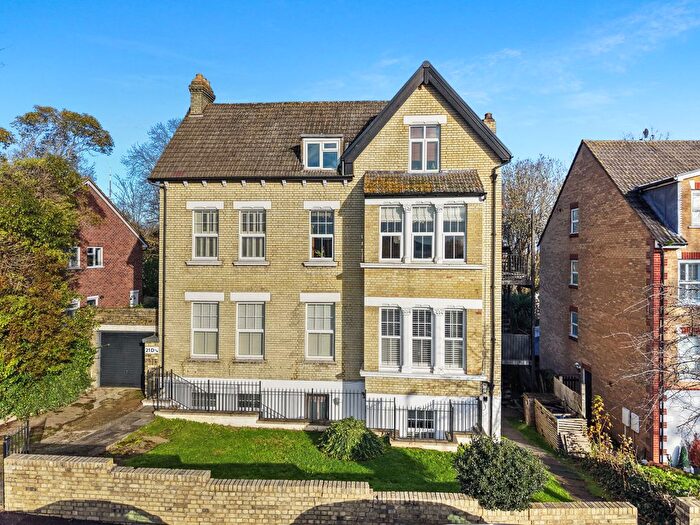
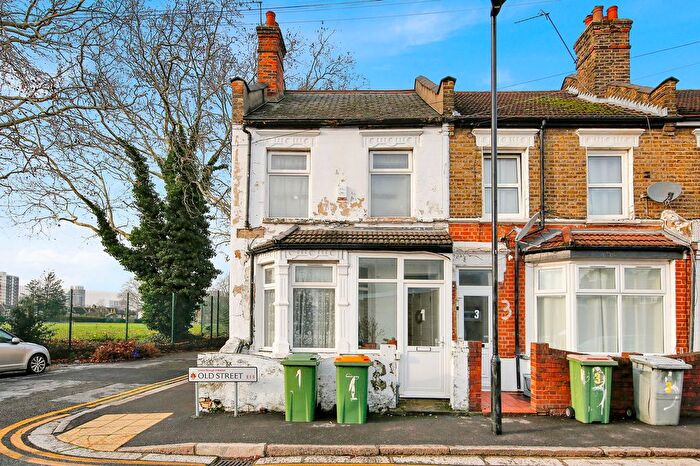
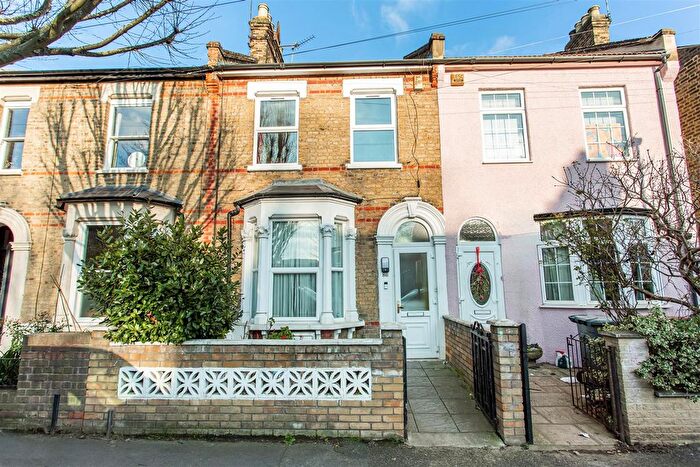
Properties for sale in Green Street East
Roads and Postcodes in Green Street East
Navigate through our locations to find the location of your next house in Green Street East, London for sale or to rent.
| Streets | Postcodes |
|---|---|
| Ashley Road | E7 8PE |
| Birchdale Road | E7 8AS |
| Bristol Road | E7 8HF E7 8HG |
| Carlton Terrace | E7 8LH |
| Charles Road | E7 8PT |
| Crescent Road | E6 1EB E6 1ED |
| Cromwell Road | E7 8PA E7 8PB |
| Derby Road | E7 8NH E7 8NJ |
| Divine Court | E7 8EL |
| Dorset Road | E7 8PR E7 8PS E7 8PX |
| Elizabeth Road | E6 1BP E6 1BW |
| Finden Road | E7 8DE |
| Fry Road | E6 1BS |
| Grangewood Street | E6 1HA |
| Grays Terrace | E7 8NR |
| Green Street | E13 9AR E7 8DA E7 8JE E7 8JF E7 8LJ E7 8LL E13 9AB |
| Halley Road | E7 8DS E7 8DT E7 8DU E7 8DX |
| Henderson Road | E7 8EF E7 8EG |
| Jephson Road | E7 8LZ E7 8NA |
| Katherine Road | E6 1BU E7 8DP E7 8DR E7 8EA E7 8EB E7 8LS E7 8LT E7 8NP E7 8NW E7 8PG E7 8PJ E7 8PP E7 8LW |
| Lansdown Road | E7 8NE E7 8NF |
| Lens Road | E7 8PU |
| Marlborough Road | E7 8HA E7 8HB |
| Monega Road | E7 8EN E7 8EP E7 8ER E7 8EW |
| Oyster Mews | E7 8DQ |
| Park Road | E6 1EA |
| Plashet Grove | E6 1AA E6 1AB E6 1AD E6 1AE E6 1AQ |
| Prestbury Road | E7 8NG E7 8NQ |
| Ratcliff Road | E7 8DD |
| Romford Road | E7 8AP E7 8DF E7 8BF |
| Rosedale Road | E7 8AT E7 8AU |
| Rothsay Road | E7 8LY |
| Sandringham Road | E7 8ED |
| Shaftesbury Road | E7 8PD E7 8PF E7 8PL E7 8PY |
| Sherrard Road | E7 8DN E7 8DW E7 8DY E7 8DZ |
| Shrewsbury Road | E7 8QB E7 8QJ |
| South Esk Road | E7 8EY E7 8EZ E7 8HD E7 8HE |
| St Dunstans Road | E7 8DB |
| St Stephens Parade | E7 8LQ |
| St Stephens Road | E6 1AL E6 1AN E6 1AT E6 1AW E6 1AX |
| Stafford Road | E7 8NL E7 8NN |
| Strone Road | E7 8ES E7 8ET E7 8EU E7 8EX |
| Walpole Road | E6 1AR |
| Washington Road | E6 1AJ |
| Waterloo Road | E6 1AP |
| Whitfield Road | E6 1AS |
| Woodstock Road | E7 8NB E7 8ND |
| Wortley Road | E6 1AY |
| Wyndham Road | E6 1AU |
Transport near Green Street East
-
Upton Park Station
-
Woodgrange Park Station
-
East Ham Station
-
Forest Gate Station
-
Wanstead Park Station
-
Manor Park Station
-
Plaistow Station
-
Maryland Station
-
Abbey Road Station
-
West Ham Station
- FAQ
- Price Paid By Year
- Property Type Price
Frequently asked questions about Green Street East
What is the average price for a property for sale in Green Street East?
The average price for a property for sale in Green Street East is £419,463. This amount is 3% lower than the average price in London. There are 2,821 property listings for sale in Green Street East.
What streets have the most expensive properties for sale in Green Street East?
The streets with the most expensive properties for sale in Green Street East are Ratcliff Road at an average of £551,500, Birchdale Road at an average of £523,750 and Henderson Road at an average of £503,000.
What streets have the most affordable properties for sale in Green Street East?
The streets with the most affordable properties for sale in Green Street East are Crescent Road at an average of £206,057, Grangewood Street at an average of £320,000 and Plashet Grove at an average of £326,111.
Which train stations are available in or near Green Street East?
Some of the train stations available in or near Green Street East are Woodgrange Park, Forest Gate and Wanstead Park.
Which tube stations are available in or near Green Street East?
Some of the tube stations available in or near Green Street East are Upton Park, East Ham and Plaistow.
Property Price Paid in Green Street East by Year
The average sold property price by year was:
| Year | Average Sold Price | Price Change |
Sold Properties
|
|---|---|---|---|
| 2025 | £424,314 | 5% |
35 Properties |
| 2024 | £404,422 | -6% |
49 Properties |
| 2023 | £429,099 | 3% |
76 Properties |
| 2022 | £416,924 | 9% |
65 Properties |
| 2021 | £380,381 | -9% |
86 Properties |
| 2020 | £414,901 | 10% |
51 Properties |
| 2019 | £374,481 | 0,4% |
35 Properties |
| 2018 | £373,074 | 1% |
67 Properties |
| 2017 | £370,629 | 8% |
62 Properties |
| 2016 | £339,671 | 14% |
76 Properties |
| 2015 | £293,243 | 14% |
98 Properties |
| 2014 | £251,493 | 15% |
85 Properties |
| 2013 | £214,879 | -3% |
67 Properties |
| 2012 | £220,395 | 7% |
43 Properties |
| 2011 | £204,365 | -5% |
54 Properties |
| 2010 | £213,769 | 14% |
63 Properties |
| 2009 | £184,020 | -17% |
49 Properties |
| 2008 | £215,306 | -2% |
83 Properties |
| 2007 | £219,037 | 7% |
164 Properties |
| 2006 | £203,108 | 3% |
159 Properties |
| 2005 | £197,769 | 6% |
180 Properties |
| 2004 | £186,073 | 2% |
235 Properties |
| 2003 | £183,062 | 28% |
211 Properties |
| 2002 | £131,494 | 19% |
188 Properties |
| 2001 | £106,088 | 17% |
215 Properties |
| 2000 | £88,239 | 19% |
201 Properties |
| 1999 | £71,523 | 10% |
202 Properties |
| 1998 | £64,443 | 12% |
211 Properties |
| 1997 | £56,466 | 13% |
184 Properties |
| 1996 | £48,950 | 2% |
169 Properties |
| 1995 | £47,764 | - |
174 Properties |
Property Price per Property Type in Green Street East
Here you can find historic sold price data in order to help with your property search.
The average Property Paid Price for specific property types in the last three years are:
| Property Type | Average Sold Price | Sold Properties |
|---|---|---|
| Semi Detached House | £470,000.00 | 1 Semi Detached House |
| Terraced House | £462,473.00 | 171 Terraced Houses |
| Flat | £279,740.00 | 53 Flats |

