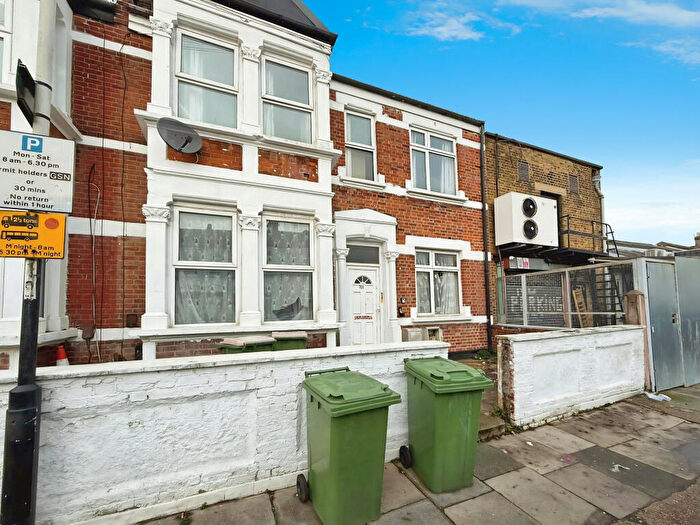
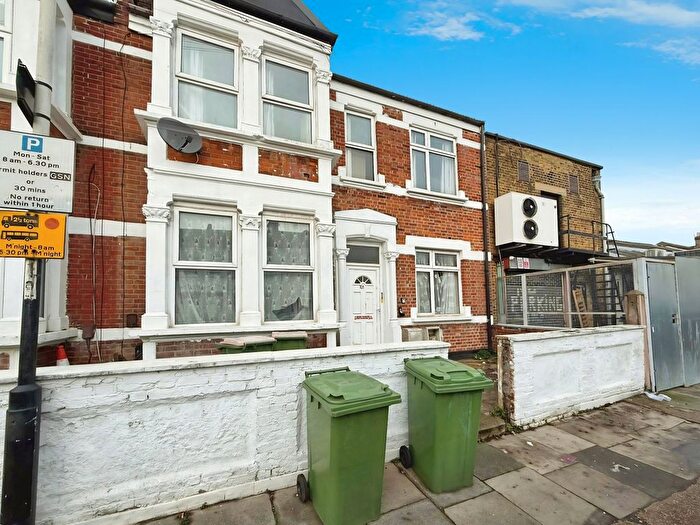
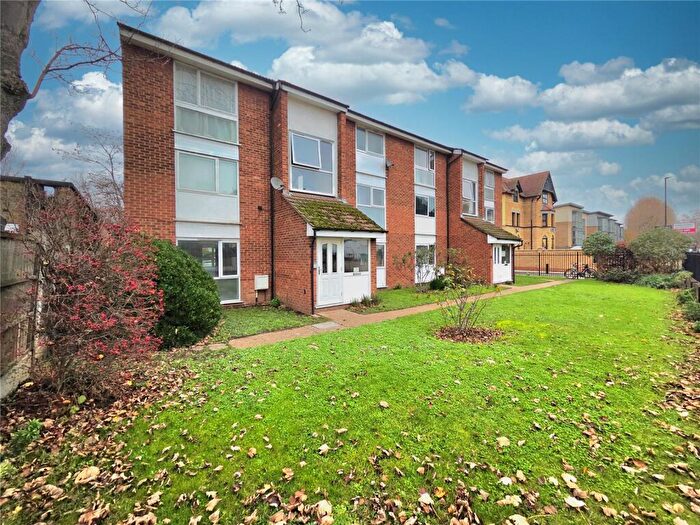
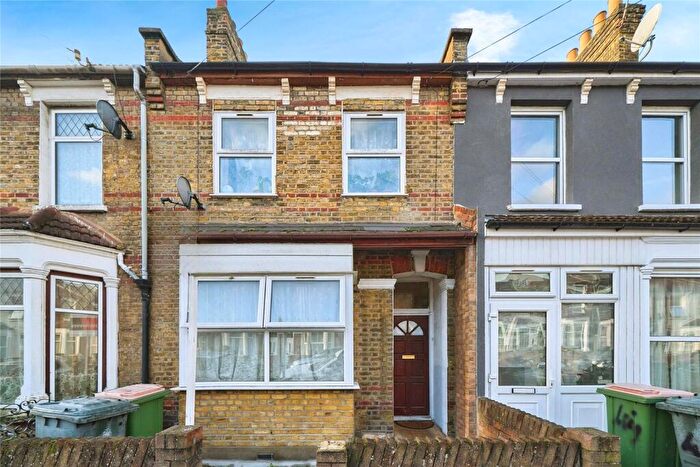
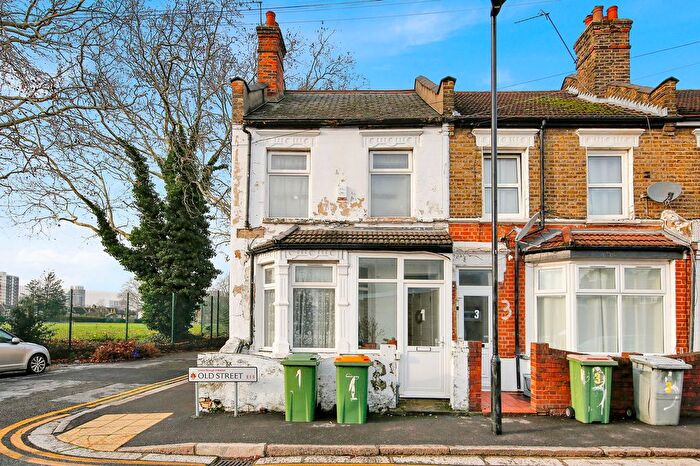
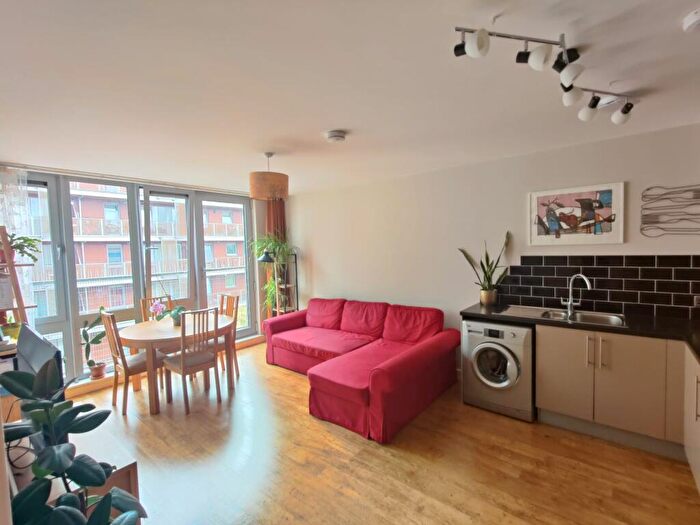
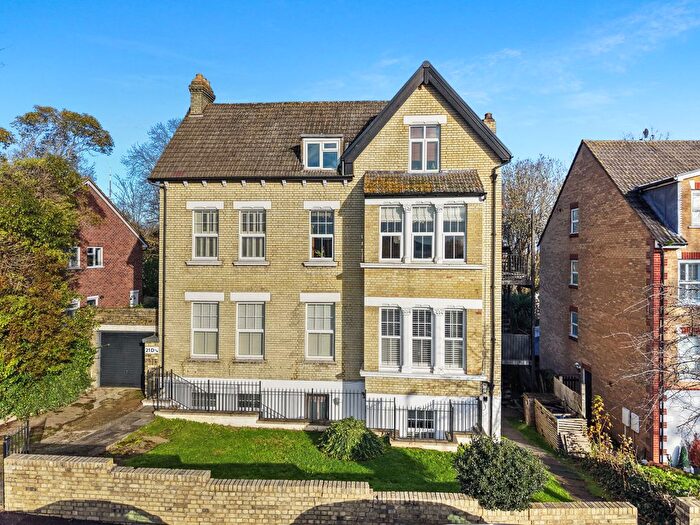
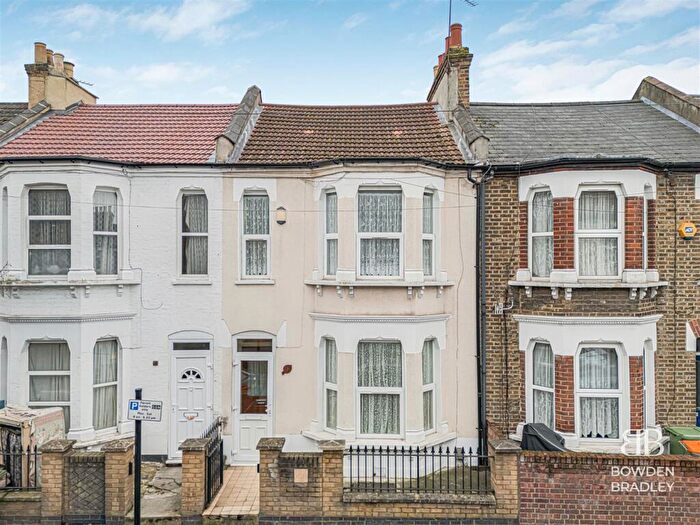
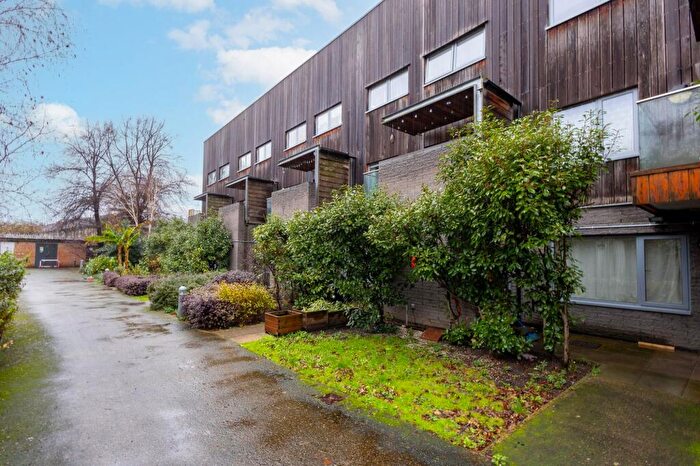
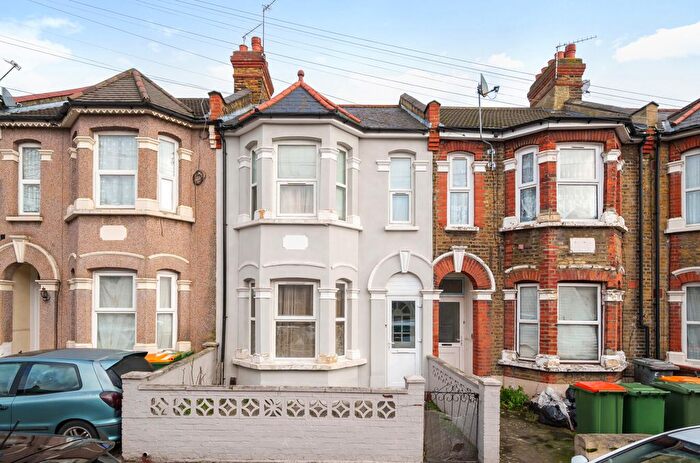
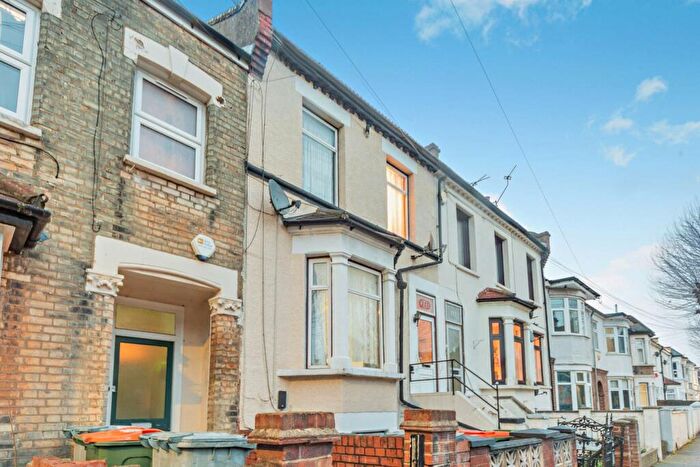
Houses for sale & to rent in Green Street West, London
House Prices in Green Street West
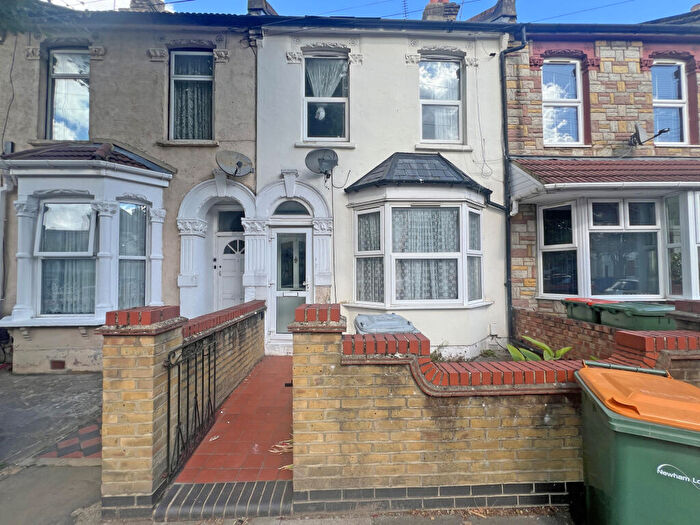
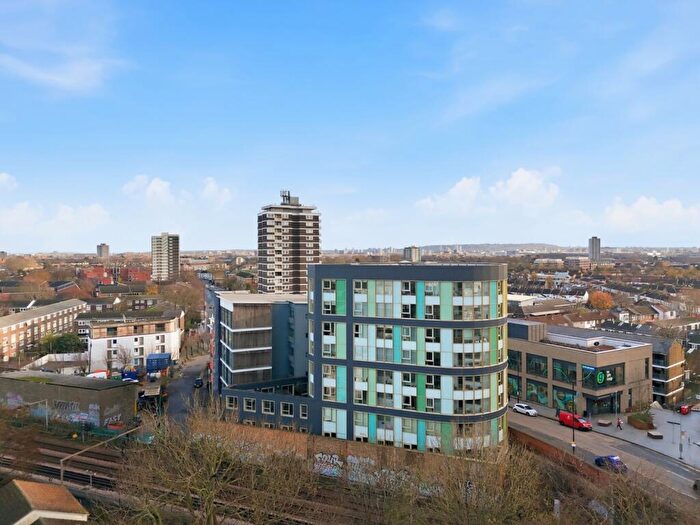
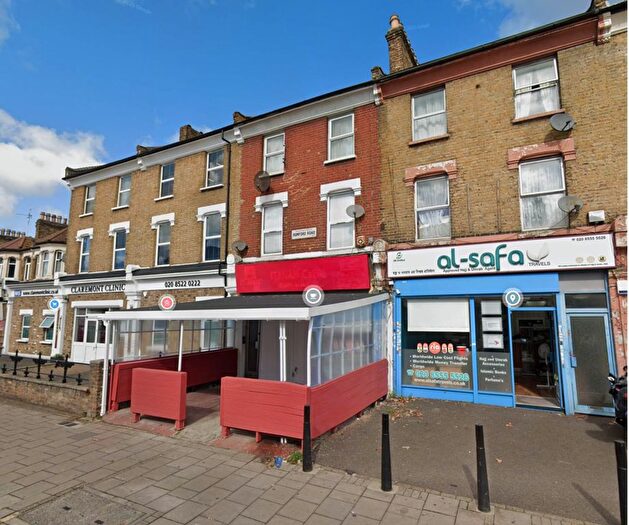
Properties in this part of Green Street West within London have an average house price of £449,836.00 and had 191 Property Transactions within the last 3 years¹. This area has 4,101 households² , where the most expensive property was sold for £895,000.00.
Properties for sale in Green Street West
Roads and Postcodes in Green Street West
Navigate through our locations to find the location of your next house in Green Street West, London for sale or to rent.
| Streets | Postcodes |
|---|---|
| Beauchamp Road | E7 9PD |
| Belton Road | E7 9PF |
| Boleyn Road | E7 9QD E7 9QE E7 9QF E7 9QG E7 9QH E7 9QJ |
| Cheshunt Road | E7 8JD |
| Churston Avenue | E13 0RH E13 0RJ |
| Donald Road | E13 0QE E13 0QF |
| Doris Road | E7 9PL |
| Dunbar Road | E7 9NH E7 9NQ |
| Elmhurst Road | E7 9PG E7 9PQ |
| Ferndale Road | E7 8JX |
| Glenparke Road | E7 8BP E7 8BW |
| Green Street | E13 9AP E7 8BZ E7 8JG E7 8JQ E7 8JT E7 8LE E7 8LF E7 8LG |
| Grosvenor Road | E7 8HZ E7 8JA E7 8JB |
| Gwendoline Avenue | E13 0QR E13 0RD E13 0RE E13 0RF |
| Ham Park Road | E7 9LQ |
| Harold Road | E13 0SE E13 0SF E13 0SG E13 0SQ |
| Ismailia Road | E7 9PH |
| Kingsley Road | E7 9PP |
| Kitchener Road | E7 8JH E7 8JJ E7 8JL E7 8JN |
| Lancaster Road | E7 9PW E7 9PX |
| Lucas Avenue | E13 0QP E13 0RL |
| Neville Road | E7 9QL E7 9QN E7 9QS E7 9QT E7 9QU E7 9QX |
| Oakdale Road | E7 8JU |
| Palmerston Road | E7 8BH E7 8FA |
| Penge Road | E13 0SL E13 0SN |
| Plashet Road | E13 0PZ E13 0QA E13 0QS E13 0QT E13 0QU E13 0QZ E13 0RA E13 0RQ |
| Raymond Road | E13 0SP E13 0SW |
| Romford Road | E7 8BE E7 8BS E7 8BD |
| Skelton Road | E7 9NJ E7 9NL |
| St Antonys Road | E7 9QA E7 9QB E7 9QW |
| St Georges Avenue | E7 8JP E7 8HP E7 8HR |
| St Georges Road | E7 8HS E7 8HT E7 8HU E7 8HY |
| St Georges Square | E7 8HN E7 8HW |
| St Johns Terrace | E7 8BX |
| Studley Road | E7 9LU E7 9LX E7 9LY E7 9NX |
| Stukeley Road | E7 9QQ E7 9GX E7 9QR E7 9QZ |
| Thorngrove Road | E13 0SB E13 0SH E13 0SJ |
| Upton Avenue | E7 9PN |
| Upton Lane | E7 9LW E7 9NN E7 9NW E7 9PB E7 9PJ E7 9PR E7 9PT E7 9PS E7 9PU |
| Upton Park Road | E7 8JY E7 8LA E7 8LB E7 8LD |
| Vale Road | E7 8BJ |
| Verona Road | E7 9FJ |
| Westbury Road | E7 8BT E7 8BU |
| Westbury Terrace | E7 8BY |
| Whyteville Road | E7 9LP E7 9LR E7 9LS E7 9LT |
| Wolseley Road | E7 9PE |
Transport near Green Street West
-
Upton Park Station
-
Forest Gate Station
-
Plaistow Station
-
Wanstead Park Station
-
Woodgrange Park Station
-
East Ham Station
-
Maryland Station
-
Manor Park Station
-
Abbey Road Station
-
Stratford High Street Station
- FAQ
- Price Paid By Year
- Property Type Price
Frequently asked questions about Green Street West
What is the average price for a property for sale in Green Street West?
The average price for a property for sale in Green Street West is £449,836. This amount is 4% higher than the average price in London. There are 3,115 property listings for sale in Green Street West.
What streets have the most expensive properties for sale in Green Street West?
The streets with the most expensive properties for sale in Green Street West are Westbury Terrace at an average of £592,166, Vale Road at an average of £587,831 and St Georges Square at an average of £562,000.
What streets have the most affordable properties for sale in Green Street West?
The streets with the most affordable properties for sale in Green Street West are Ham Park Road at an average of £237,500, Romford Road at an average of £245,000 and St Georges Road at an average of £355,125.
Which train stations are available in or near Green Street West?
Some of the train stations available in or near Green Street West are Forest Gate, Wanstead Park and Woodgrange Park.
Which tube stations are available in or near Green Street West?
Some of the tube stations available in or near Green Street West are Upton Park, Plaistow and East Ham.
Property Price Paid in Green Street West by Year
The average sold property price by year was:
| Year | Average Sold Price | Price Change |
Sold Properties
|
|---|---|---|---|
| 2025 | £453,880 | 3% |
21 Properties |
| 2024 | £438,005 | -3% |
63 Properties |
| 2023 | £451,906 | -2% |
50 Properties |
| 2022 | £459,607 | 5% |
57 Properties |
| 2021 | £437,841 | 12% |
88 Properties |
| 2020 | £384,591 | 0,3% |
60 Properties |
| 2019 | £383,541 | -6% |
48 Properties |
| 2018 | £404,676 | -0,5% |
47 Properties |
| 2017 | £406,522 | 6% |
60 Properties |
| 2016 | £381,540 | 19% |
72 Properties |
| 2015 | £310,025 | 18% |
83 Properties |
| 2014 | £254,590 | 12% |
77 Properties |
| 2013 | £223,219 | 11% |
60 Properties |
| 2012 | £197,918 | -15% |
37 Properties |
| 2011 | £227,330 | 1% |
56 Properties |
| 2010 | £224,934 | 5% |
38 Properties |
| 2009 | £213,205 | -6% |
40 Properties |
| 2008 | £225,137 | -1% |
76 Properties |
| 2007 | £226,271 | 8% |
133 Properties |
| 2006 | £209,161 | 2% |
116 Properties |
| 2005 | £204,414 | 6% |
121 Properties |
| 2004 | £191,308 | 9% |
137 Properties |
| 2003 | £173,169 | 18% |
179 Properties |
| 2002 | £141,916 | 22% |
186 Properties |
| 2001 | £111,374 | 19% |
184 Properties |
| 2000 | £89,704 | 15% |
161 Properties |
| 1999 | £76,522 | 12% |
170 Properties |
| 1998 | £67,303 | 8% |
168 Properties |
| 1997 | £62,010 | 17% |
150 Properties |
| 1996 | £51,756 | 1% |
172 Properties |
| 1995 | £51,032 | - |
139 Properties |
Property Price per Property Type in Green Street West
Here you can find historic sold price data in order to help with your property search.
The average Property Paid Price for specific property types in the last three years are:
| Property Type | Average Sold Price | Sold Properties |
|---|---|---|
| Semi Detached House | £631,250.00 | 4 Semi Detached Houses |
| Terraced House | £503,374.00 | 132 Terraced Houses |
| Flat | £304,970.00 | 54 Flats |
| Detached House | £480,000.00 | 1 Detached House |

