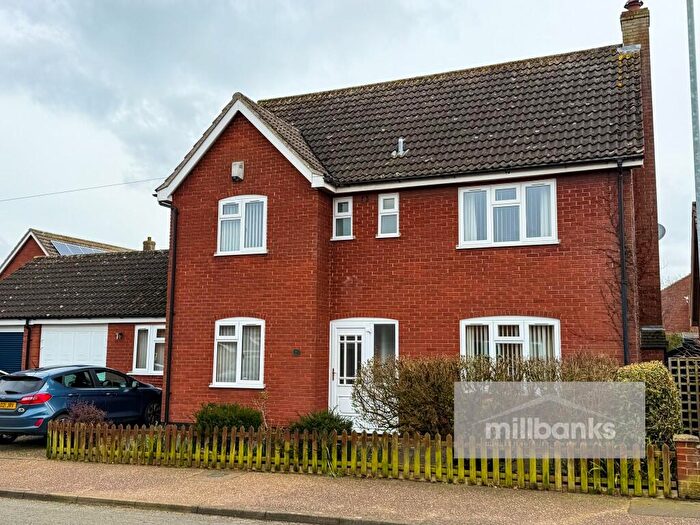
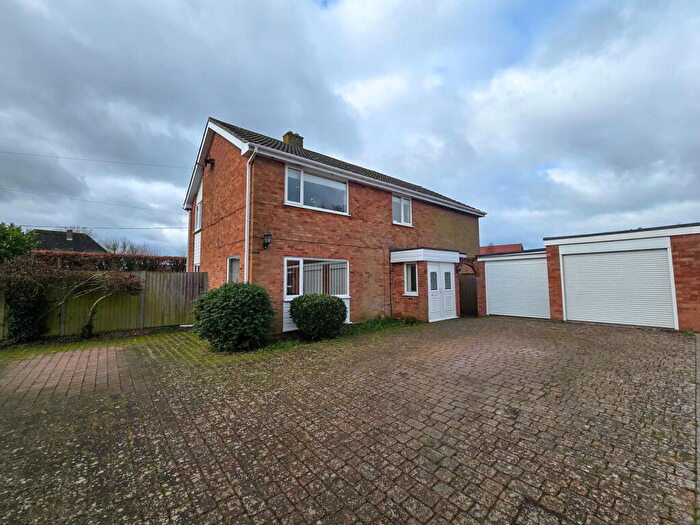
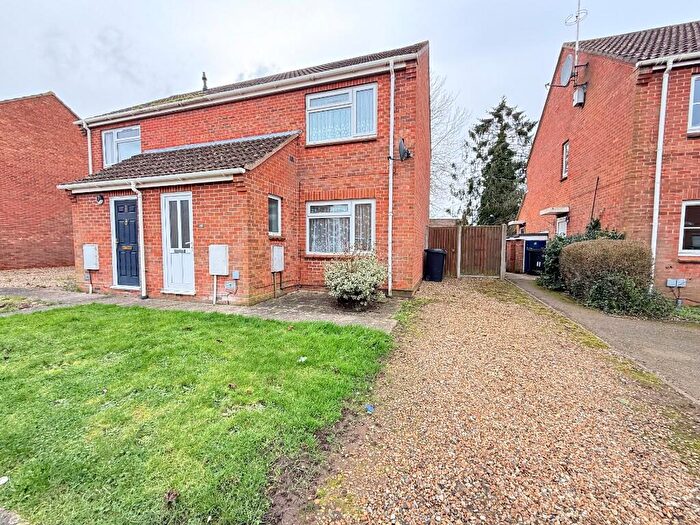
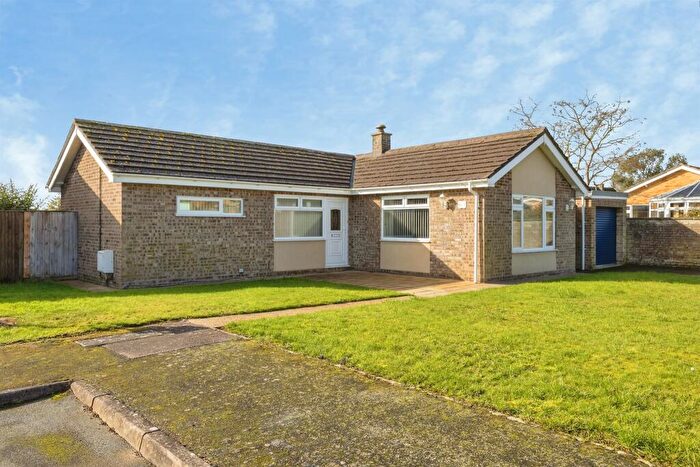
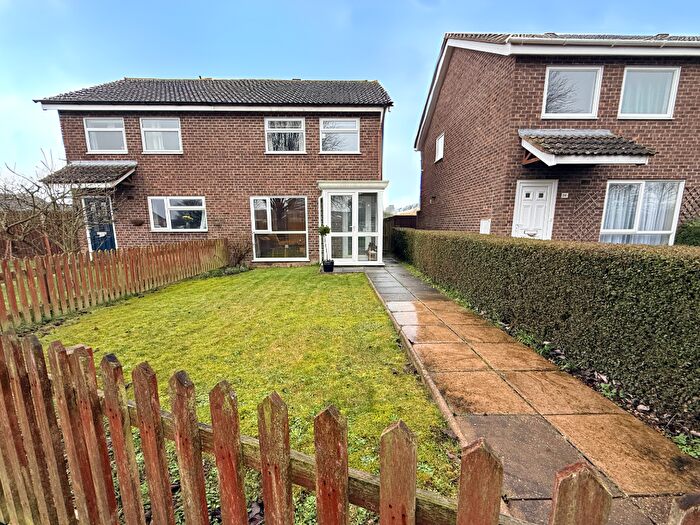
Houses for sale & to rent in Burgh And Haverscroft, Attleborough
House Prices in Burgh And Haverscroft
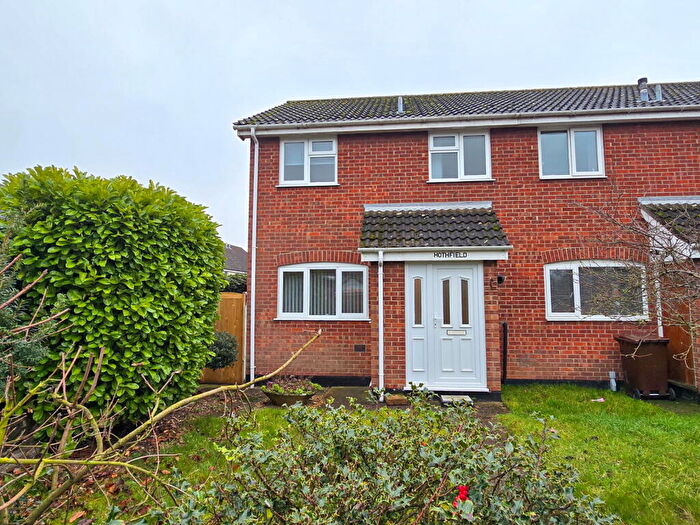
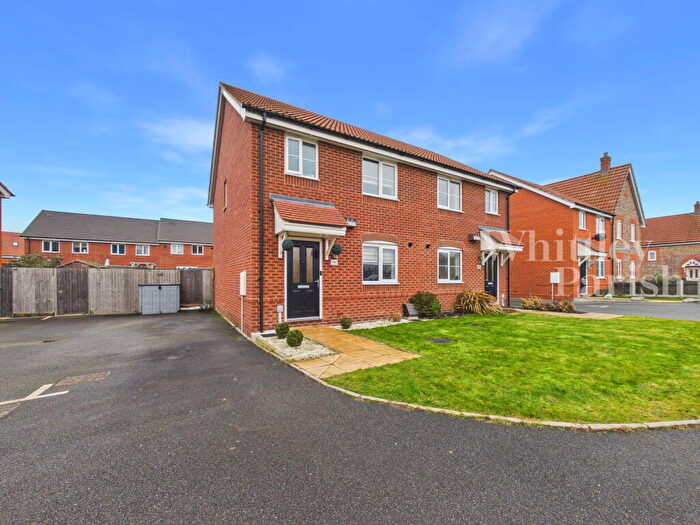
Properties in Burgh And Haverscroft have an average house price of £275,549.00 and had 210 Property Transactions within the last 3 years¹.
Burgh And Haverscroft is an area in Attleborough, Norfolk with 1,638 households², where the most expensive property was sold for £729,000.00.
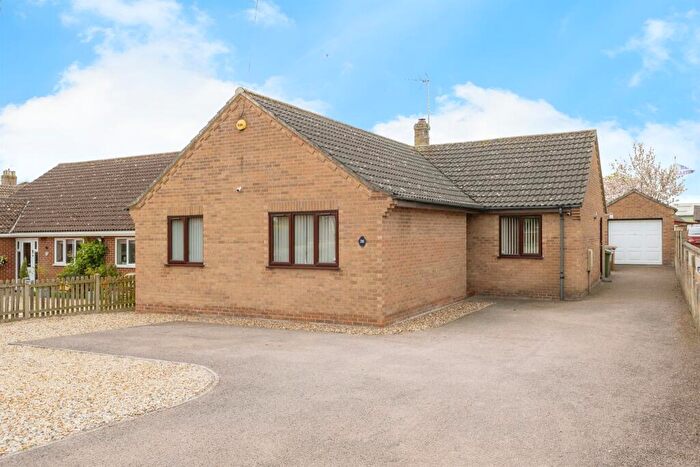
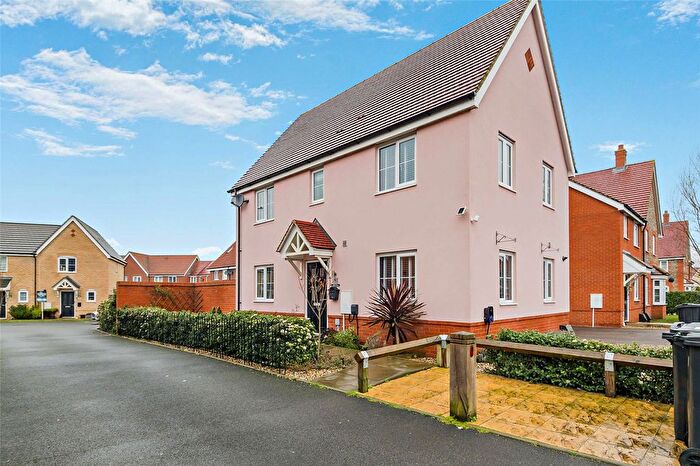
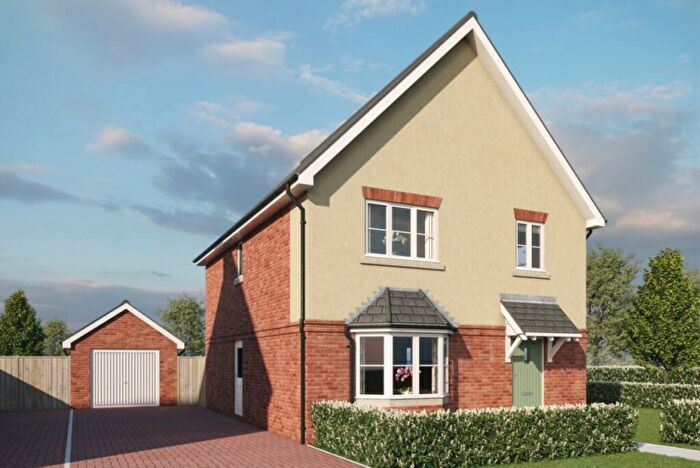
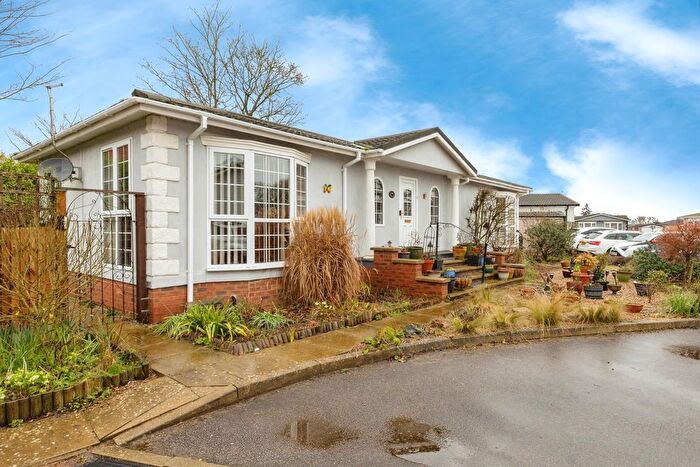
Properties for sale in Burgh And Haverscroft
Roads and Postcodes in Burgh And Haverscroft
Navigate through our locations to find the location of your next house in Burgh And Haverscroft, Attleborough for sale or to rent.
| Streets | Postcodes |
|---|---|
| Barley Way | NR17 1YD |
| Beech Avenue | NR17 2ET |
| Birch Drive | NR17 2HF |
| Blenheim Drive | NR17 1QZ |
| Buckenham Road | NR17 1NA NR17 1NB NR17 1NG |
| Burgh Common | NR17 1QF |
| Cedar Drive | NR17 2EX NR17 2EY NR17 2HN |
| Cider Close | NR17 2QD |
| Clover Road | NR17 2JQ |
| Croft Green | NR17 2JS |
| Dodds Close | NR17 2HJ |
| Dodds Lane | NR17 2RH |
| Dodds Road | NR17 2HH |
| Dorset Close | NR17 2HW |
| Eden Close | NR17 2EP |
| Edenside Drive | NR17 2EL |
| Ellison Close | NR17 1QT |
| Fairfield Drive | NR17 2HD NR17 2HE |
| Firwood Villas | NR17 2BE |
| Flowers Lane | NR17 1BB |
| Foundry Corner | NR17 1NQ |
| Foundry Corner Borough Lane | NR17 1NH |
| Fowlers Lane | NR17 1BH |
| Granary Road | NR17 2JE |
| Halford Close | NR17 2HY |
| Halford Place | NR17 2PE |
| Halford Road | NR17 2HZ NR17 2JF |
| Hargham Road | NR17 1AZ NR17 1BA NR17 2ER NR17 2ES NR17 2HG NR17 2HQ NR17 2JP |
| Hillsend Lane | NR17 1BG |
| Holly Road | NR17 2HA |
| Keeling Way | NR17 1YF |
| Kent Close | NR17 2HP |
| Larch Close | NR17 2HB |
| Lark Drive | NR17 1NZ |
| Laxton Close | NR17 1QY |
| Leys Lane | NR17 1NE NR17 1NF NR17 2HX NR17 2JA NR17 2JB |
| London Road | NR17 1BE NR17 1BQ |
| Mansfield Villas | NR17 2BD |
| Meadow Way | NR17 2HL |
| New North Road | NR17 2BG NR17 2BH NR17 2BJ NR17 2BQ |
| New Road | NR17 1YA NR17 1YB |
| Oaklands Close | NR17 2LT |
| Ollands Road | NR17 2JD NR17 2JG NR17 2JJ |
| Pine Court | NR17 2HU |
| Plantation Close | NR17 2LY |
| Poplar Road | NR17 1BD |
| Poplar Way | NR17 2JR |
| Russet Close | NR17 1QX |
| Rye Lane | NR17 2JH |
| Saddler Close | NR17 2GB |
| Shannons Close | NR17 2RX |
| Slough Lane | NR17 1ND |
| Station Road | NR17 2AS NR17 2AT |
| Swangey Road | NR17 1XL |
| Sycamore Close | NR17 2EU |
| The Oaks | NR17 2BB |
| Thieves Lane | NR17 2AP |
| Thorpe Drive | NR17 2HS |
| Woodside Close | NR17 2LX |
| Woodside Court | NR17 2JT |
| Woodside Park | NR17 2JL |
| Worcester Way | NR17 1QU |
| Wymbur Drive | NR17 1QH |
Transport near Burgh And Haverscroft
- FAQ
- Price Paid By Year
- Property Type Price
Frequently asked questions about Burgh And Haverscroft
What is the average price for a property for sale in Burgh And Haverscroft?
The average price for a property for sale in Burgh And Haverscroft is £275,549. This amount is 14% lower than the average price in Attleborough. There are 1,538 property listings for sale in Burgh And Haverscroft.
What streets have the most expensive properties for sale in Burgh And Haverscroft?
The streets with the most expensive properties for sale in Burgh And Haverscroft are Dodds Road at an average of £640,000, Hillsend Lane at an average of £530,000 and Foundry Corner Borough Lane at an average of £515,000.
What streets have the most affordable properties for sale in Burgh And Haverscroft?
The streets with the most affordable properties for sale in Burgh And Haverscroft are Station Road at an average of £120,166, Woodside Court at an average of £146,500 and Ellison Close at an average of £172,625.
Which train stations are available in or near Burgh And Haverscroft?
Some of the train stations available in or near Burgh And Haverscroft are Attleborough, Eccles Road and Spooner Row.
Property Price Paid in Burgh And Haverscroft by Year
The average sold property price by year was:
| Year | Average Sold Price | Price Change |
Sold Properties
|
|---|---|---|---|
| 2025 | £259,700 | -14% |
76 Properties |
| 2024 | £295,830 | 7% |
65 Properties |
| 2023 | £273,901 | 3% |
69 Properties |
| 2022 | £267,052 | 2% |
82 Properties |
| 2021 | £260,466 | 7% |
115 Properties |
| 2020 | £241,646 | 1% |
61 Properties |
| 2019 | £239,108 | -1% |
74 Properties |
| 2018 | £240,737 | 3% |
62 Properties |
| 2017 | £233,988 | 8% |
80 Properties |
| 2016 | £215,272 | 1% |
109 Properties |
| 2015 | £213,982 | 10% |
95 Properties |
| 2014 | £191,897 | 3% |
112 Properties |
| 2013 | £186,863 | 9% |
110 Properties |
| 2012 | £170,706 | 6% |
70 Properties |
| 2011 | £160,103 | -15% |
77 Properties |
| 2010 | £183,621 | 10% |
59 Properties |
| 2009 | £164,989 | 1% |
67 Properties |
| 2008 | £162,730 | -16% |
36 Properties |
| 2007 | £189,383 | 12% |
103 Properties |
| 2006 | £167,122 | 11% |
121 Properties |
| 2005 | £148,199 | 3% |
82 Properties |
| 2004 | £143,400 | 13% |
89 Properties |
| 2003 | £124,120 | -2% |
92 Properties |
| 2002 | £127,112 | 33% |
110 Properties |
| 2001 | £85,439 | 8% |
124 Properties |
| 2000 | £78,267 | 24% |
107 Properties |
| 1999 | £59,254 | 6% |
144 Properties |
| 1998 | £55,409 | 3% |
112 Properties |
| 1997 | £53,683 | 11% |
103 Properties |
| 1996 | £47,675 | -4% |
91 Properties |
| 1995 | £49,599 | - |
68 Properties |
Property Price per Property Type in Burgh And Haverscroft
Here you can find historic sold price data in order to help with your property search.
The average Property Paid Price for specific property types in the last three years are:
| Property Type | Average Sold Price | Sold Properties |
|---|---|---|
| Semi Detached House | £245,285.00 | 49 Semi Detached Houses |
| Detached House | £336,235.00 | 109 Detached Houses |
| Terraced House | £188,551.00 | 43 Terraced Houses |
| Flat | £121,000.00 | 9 Flats |

