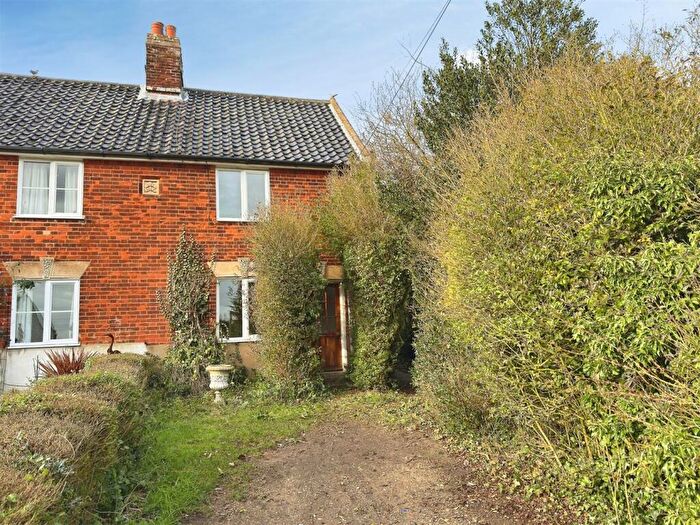
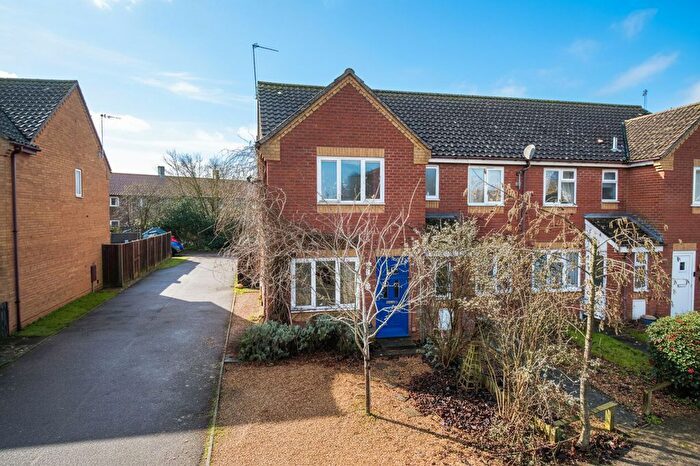
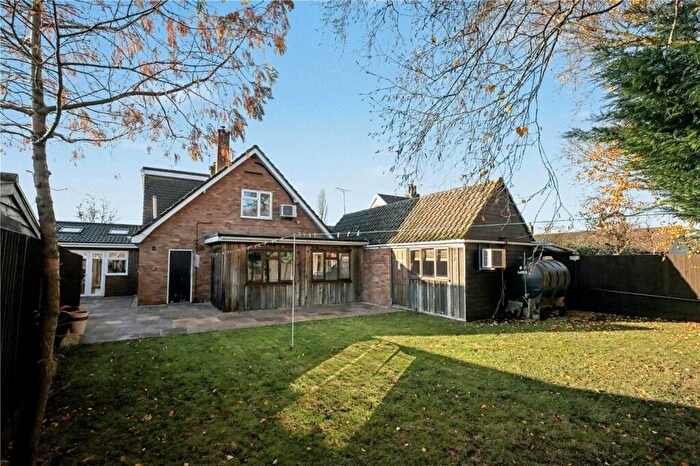
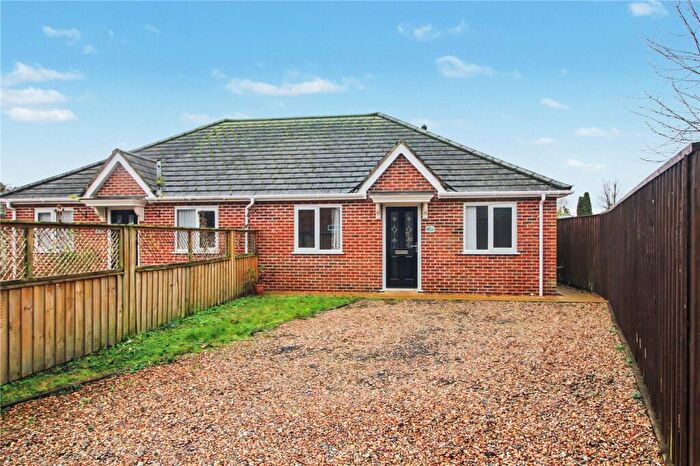
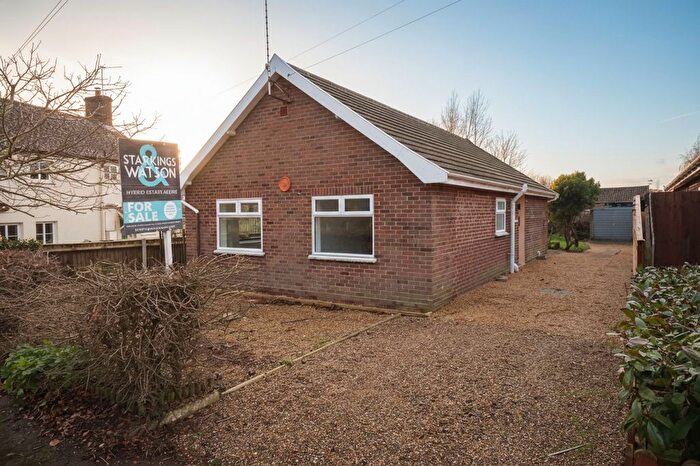
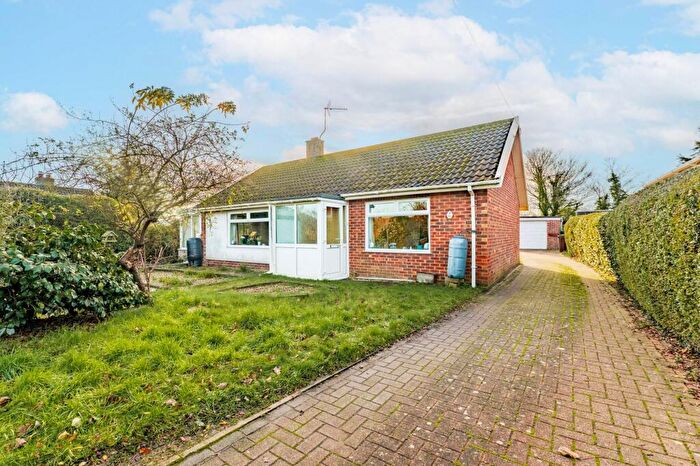
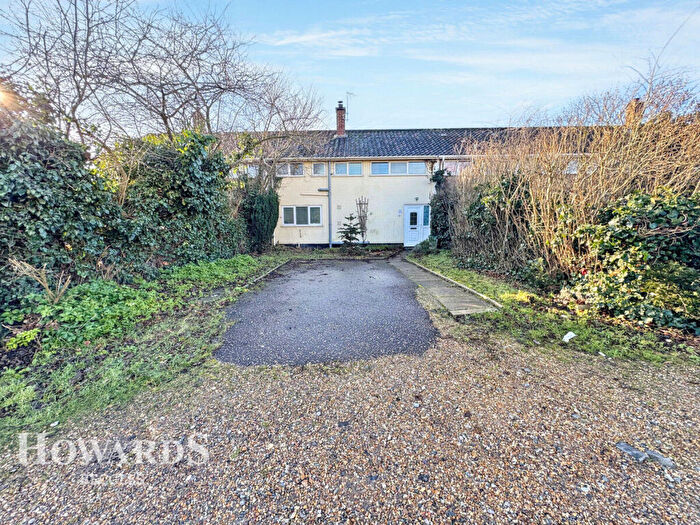
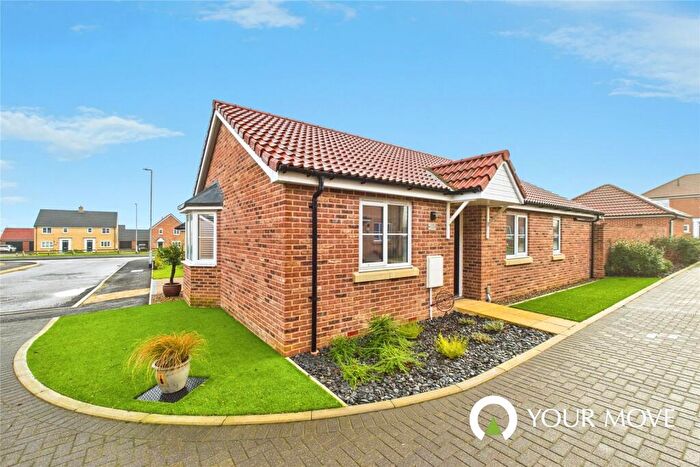
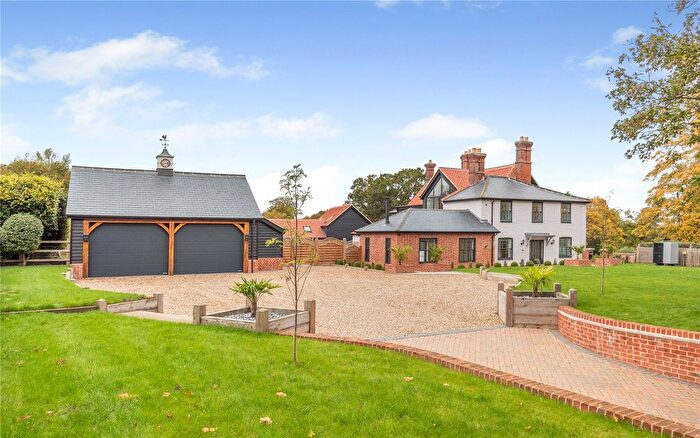
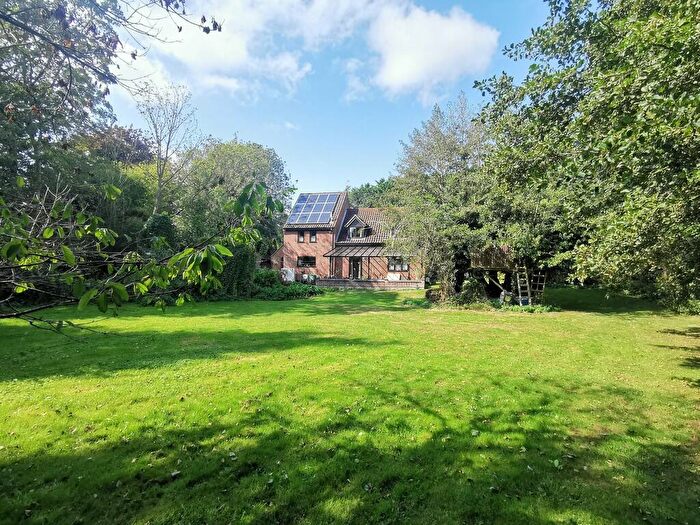
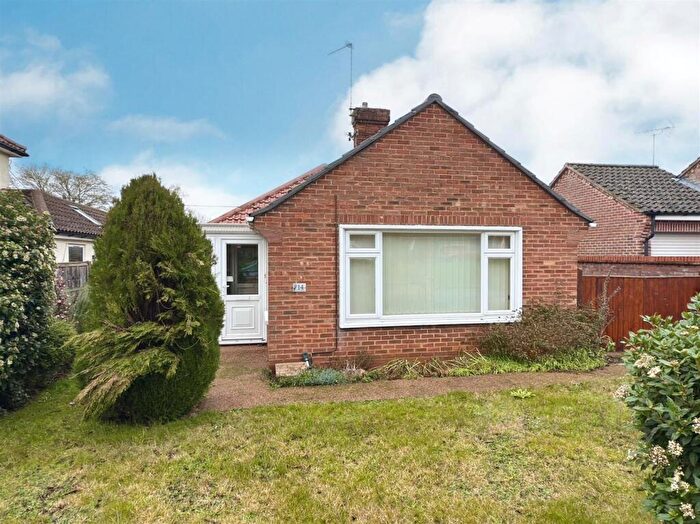
Houses for sale & to rent in Ditchingham And Broome, Bungay
House Prices in Ditchingham And Broome
Properties in Ditchingham And Broome have an average house price of £330,454.00 and had 94 Property Transactions within the last 3 years¹.
Ditchingham And Broome is an area in Bungay, Norfolk with 949 households², where the most expensive property was sold for £870,000.00.
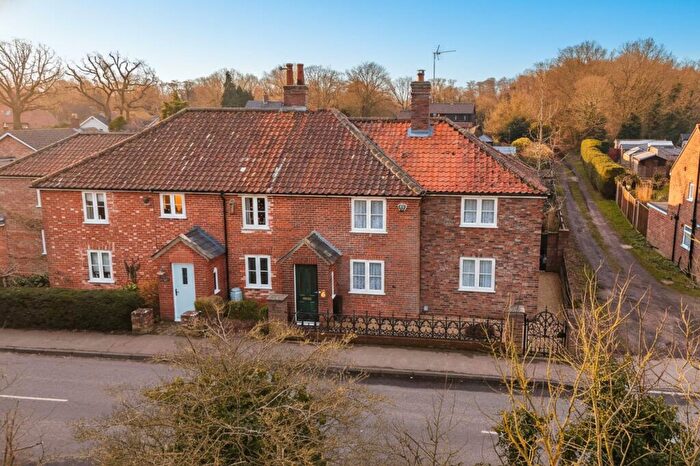
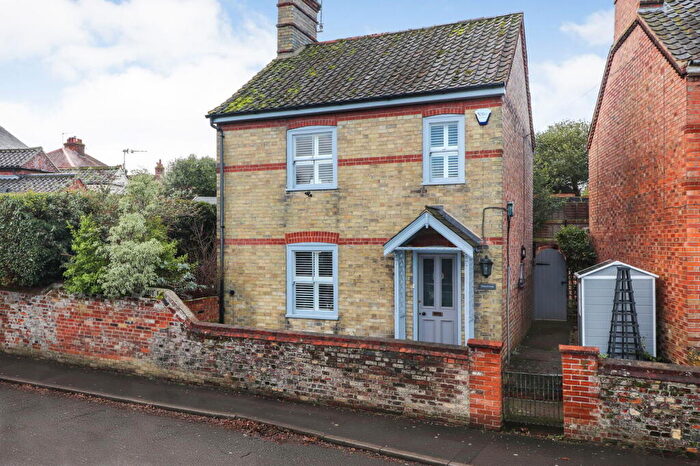
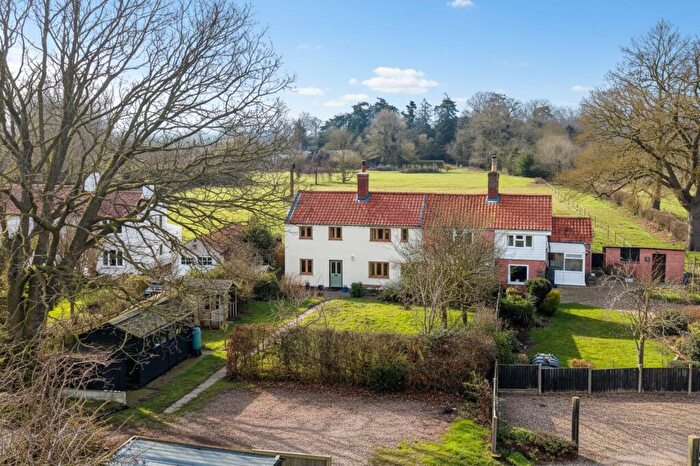
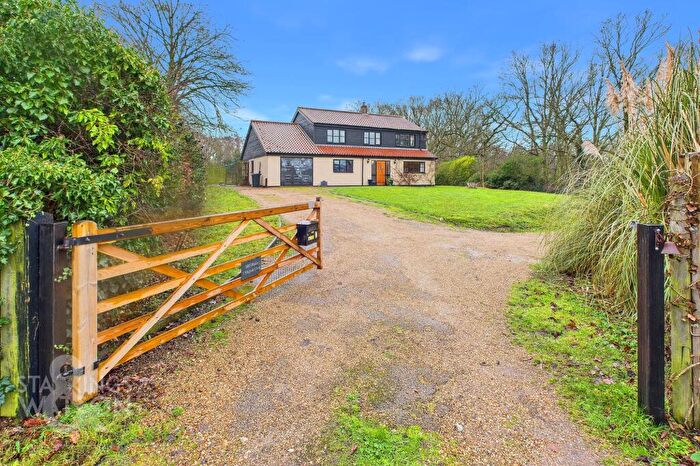
Properties for sale in Ditchingham And Broome
Roads and Postcodes in Ditchingham And Broome
Navigate through our locations to find the location of your next house in Ditchingham And Broome, Bungay for sale or to rent.
| Streets | Postcodes |
|---|---|
| Alma Cottages | NR35 2RT |
| Bakers Lane | NR35 2DY |
| Baldrys Walk | NR35 2RZ |
| Beevors Garden | NR35 2QX |
| Belsey Bridge Road | NR35 2JS |
| Black Horse Lane | NR35 2RB |
| Bungay Road | NR35 2EE NR35 2EF |
| Church Lane | NR35 2EG |
| Church Road | NR35 2LF NR35 2LG |
| Clark Road | NR35 2QQ |
| Ditchingham Dam | NR35 2JH NR35 2JQ |
| Drapers Lane | NR35 2JW |
| Earsham Road | NR35 2DF |
| Falcon Lane | NR35 2JG |
| Fen Lane | NR35 2DL |
| Free Lane | NR35 2DW |
| Green Lane | NR35 2RD |
| Hamilton Way | NR35 2JD |
| Hollow Hill | NR35 2DX |
| Hollow Hill Road | NR35 2QU NR35 2QZ |
| Lamberts Way | NR35 2QB |
| Lewis Close | NR35 2RG |
| Loddon Road | NR35 2HX NR35 2QN NR35 2QY NR35 2RA NR35 2RJ NR35 2RL |
| Longrigg Road | NR35 2QG |
| Low Road | NR35 2LH |
| Lugs Lane | NR35 2HT |
| Millfield Close | NR35 2QJ |
| Norwich Road | NR35 2DE NR35 2JJ NR35 2JL NR35 2JP NR35 2JU NR35 2JZ NR35 2LB |
| Pirnhow Street | NR35 2RS NR35 2RU NR35 2SA |
| Poppy Close | NR35 2SG |
| Pound Lane | NR35 2DJ NR35 2DN |
| Rider Haggard Way | NR35 2JF NR35 2RE |
| Sexton Road | NR35 2DG NR35 2DQ |
| Smiths Knoll | NR35 2LQ |
| Station Road | NR35 2QW |
| Sun Road | NR35 2RW |
| Sunley Close | NR35 2RR |
| The Loke | NR35 2QS |
| Thwaite Road | NR35 2QH NR35 2QR NR35 2RX NR35 2SQ |
| Toad Lane | NR35 2EQ |
| Tunneys Lane | NR35 2RQ |
| Turner Close | NR35 2JE |
| Walpole Close | NR35 2RP |
| Waveney Road | NR35 2RF |
| Wild Flower Way | NR35 2SF |
| Willow Lane | NR35 2RN |
| Windmill Green | NR35 2QP |
| Woods Close | NR35 2RY |
| Yarmouth Road | NR35 2NZ NR35 2PA NR35 2PB NR35 2PD NR35 2PE |
Transport near Ditchingham And Broome
-
Beccles Station
-
Brampton (Suffolk) Station
-
Cantley Station
-
Reedham (Norfolk) Station
-
Buckenham Station
-
Haddiscoe Station
-
Halesworth Station
-
Somerleyton Station
- FAQ
- Price Paid By Year
- Property Type Price
Frequently asked questions about Ditchingham And Broome
What is the average price for a property for sale in Ditchingham And Broome?
The average price for a property for sale in Ditchingham And Broome is £330,454. This amount is 3% lower than the average price in Bungay. There are 1,327 property listings for sale in Ditchingham And Broome.
What streets have the most expensive properties for sale in Ditchingham And Broome?
The streets with the most expensive properties for sale in Ditchingham And Broome are Willow Lane at an average of £770,000, Tunneys Lane at an average of £490,000 and Yarmouth Road at an average of £436,428.
What streets have the most affordable properties for sale in Ditchingham And Broome?
The streets with the most affordable properties for sale in Ditchingham And Broome are Millfield Close at an average of £116,250, Wild Flower Way at an average of £167,500 and Windmill Green at an average of £190,500.
Which train stations are available in or near Ditchingham And Broome?
Some of the train stations available in or near Ditchingham And Broome are Beccles, Brampton (Suffolk) and Cantley.
Property Price Paid in Ditchingham And Broome by Year
The average sold property price by year was:
| Year | Average Sold Price | Price Change |
Sold Properties
|
|---|---|---|---|
| 2025 | £292,375 | -5% |
24 Properties |
| 2024 | £306,680 | -25% |
36 Properties |
| 2023 | £382,507 | -2% |
34 Properties |
| 2022 | £390,250 | 18% |
42 Properties |
| 2021 | £318,119 | 11% |
71 Properties |
| 2020 | £284,317 | 0,4% |
28 Properties |
| 2019 | £283,160 | -5% |
28 Properties |
| 2018 | £298,628 | 11% |
38 Properties |
| 2017 | £266,986 | 10% |
40 Properties |
| 2016 | £240,552 | 7% |
47 Properties |
| 2015 | £223,642 | -2% |
34 Properties |
| 2014 | £227,875 | 4% |
64 Properties |
| 2013 | £217,750 | -4% |
36 Properties |
| 2012 | £227,451 | 3% |
29 Properties |
| 2011 | £220,296 | -13% |
31 Properties |
| 2010 | £247,923 | 26% |
44 Properties |
| 2009 | £184,358 | -20% |
34 Properties |
| 2008 | £221,985 | 5% |
27 Properties |
| 2007 | £211,053 | -8% |
40 Properties |
| 2006 | £227,441 | 18% |
44 Properties |
| 2005 | £186,379 | 4% |
27 Properties |
| 2004 | £179,007 | -4% |
45 Properties |
| 2003 | £185,458 | 25% |
54 Properties |
| 2002 | £138,255 | 24% |
61 Properties |
| 2001 | £104,476 | 18% |
49 Properties |
| 2000 | £85,883 | 11% |
41 Properties |
| 1999 | £76,786 | 10% |
49 Properties |
| 1998 | £69,141 | 0,1% |
50 Properties |
| 1997 | £69,086 | 6% |
42 Properties |
| 1996 | £64,951 | 13% |
35 Properties |
| 1995 | £56,359 | - |
33 Properties |
Property Price per Property Type in Ditchingham And Broome
Here you can find historic sold price data in order to help with your property search.
The average Property Paid Price for specific property types in the last three years are:
| Property Type | Average Sold Price | Sold Properties |
|---|---|---|
| Semi Detached House | £276,354.00 | 24 Semi Detached Houses |
| Detached House | £400,995.00 | 52 Detached Houses |
| Terraced House | £200,500.00 | 17 Terraced Houses |
| Flat | £170,000.00 | 1 Flat |

