
Houses for sale in Gillingham, Bungay
House Prices in Gillingham
Properties in Gillingham have an average house price of £412k and had 29 Property Transactions within the last 3 years¹.
Gillingham is an area in Bungay, Norfolk with 381 households², where the most expensive property was sold for £1.35M.
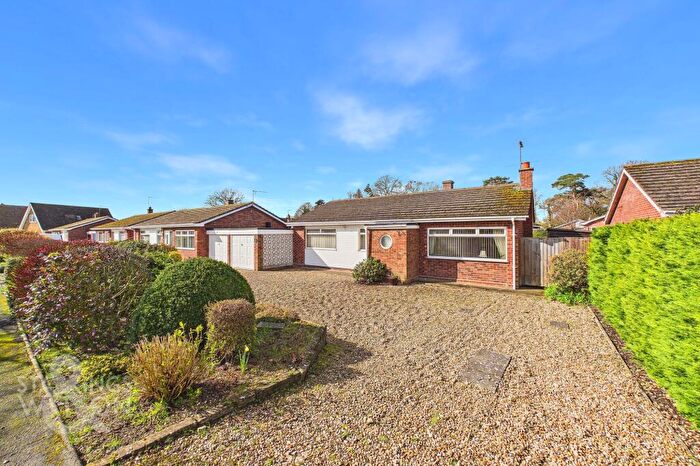
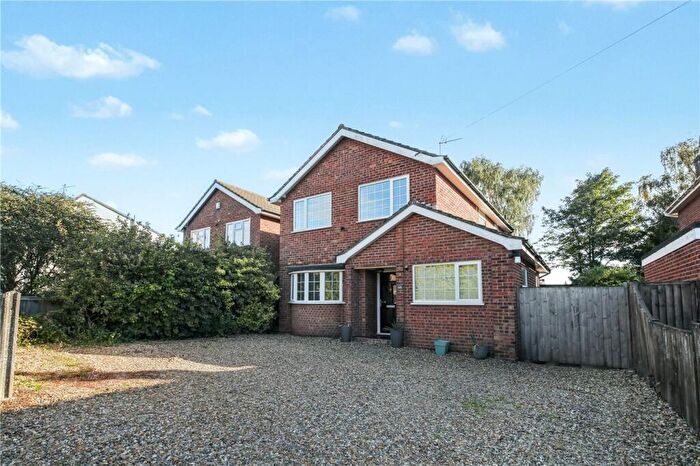
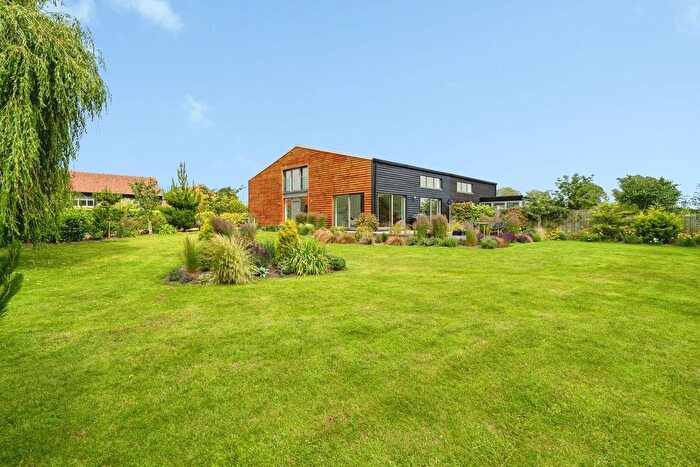
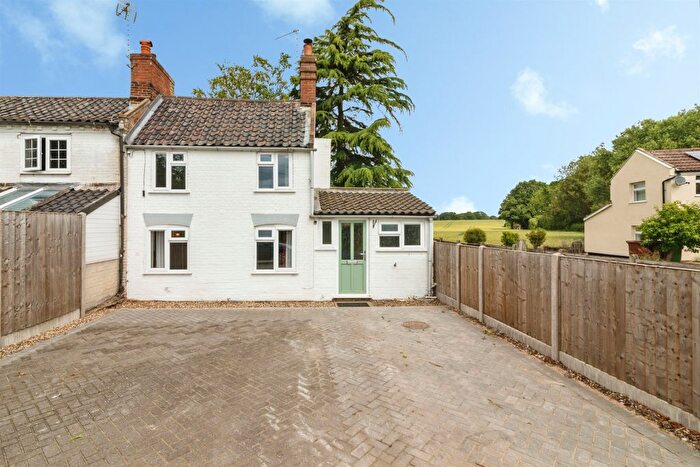
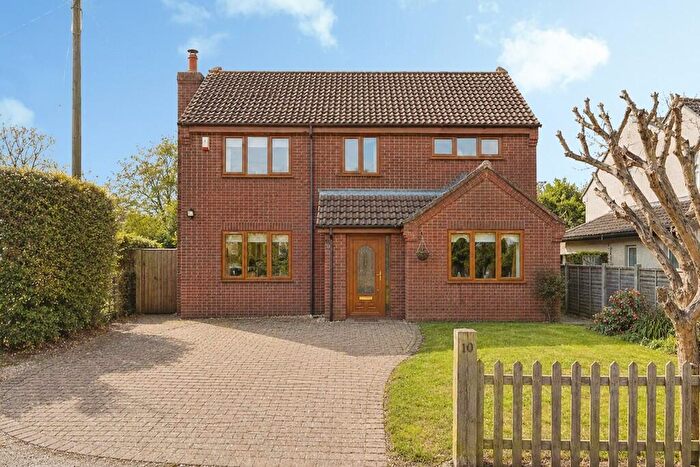
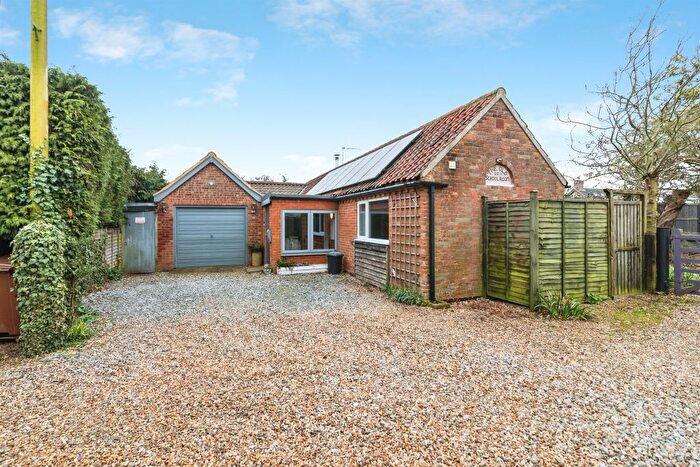
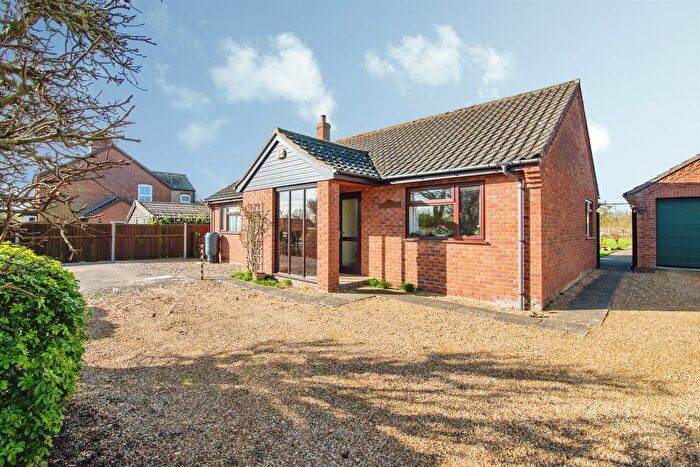
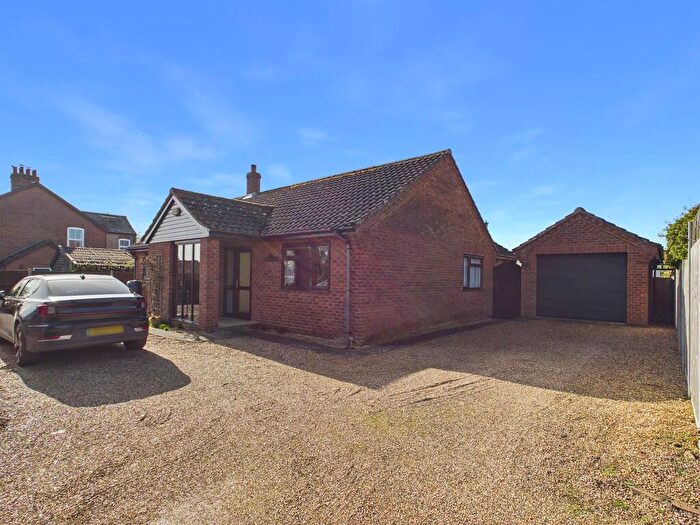
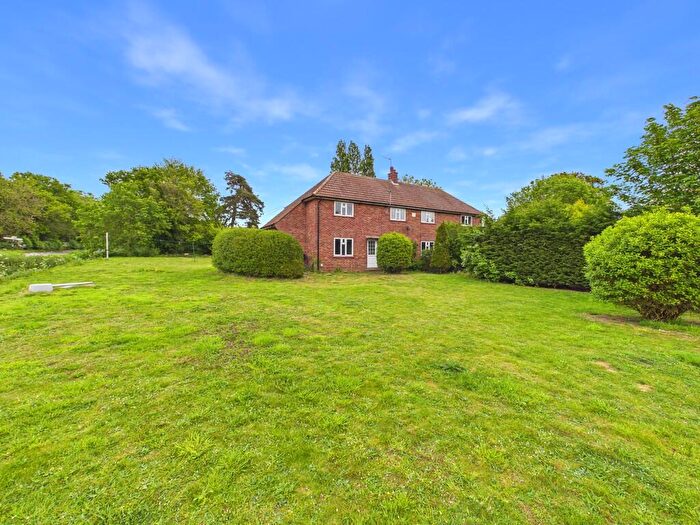
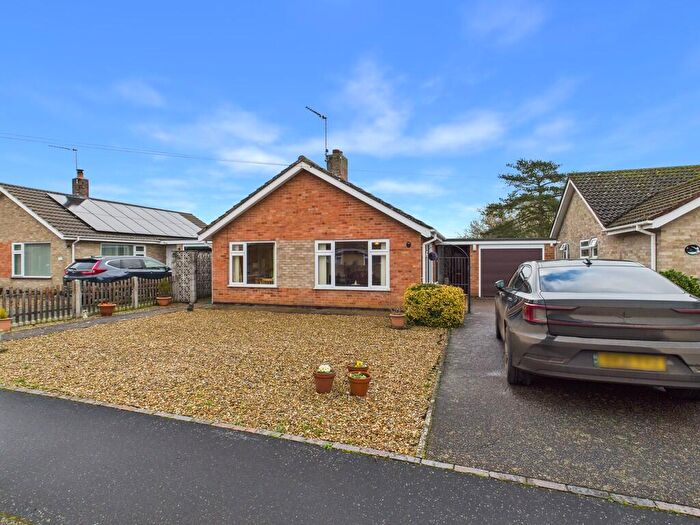
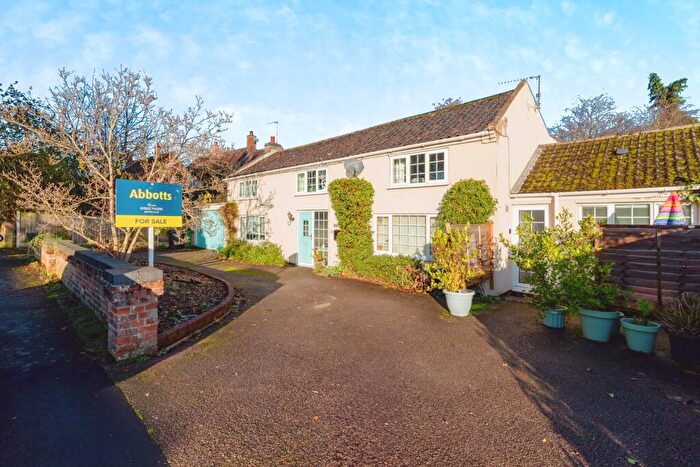
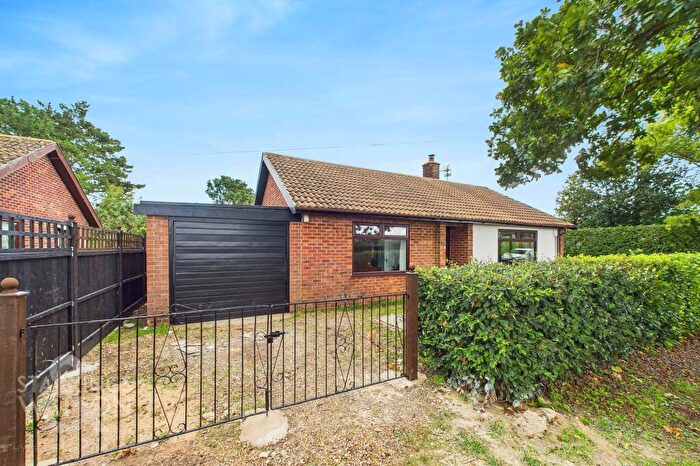
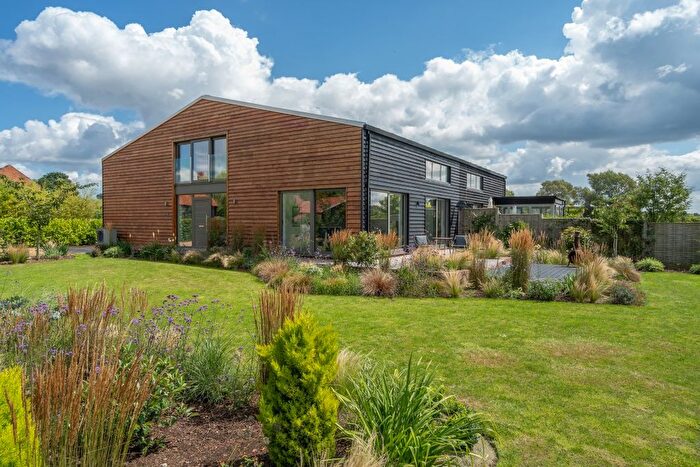
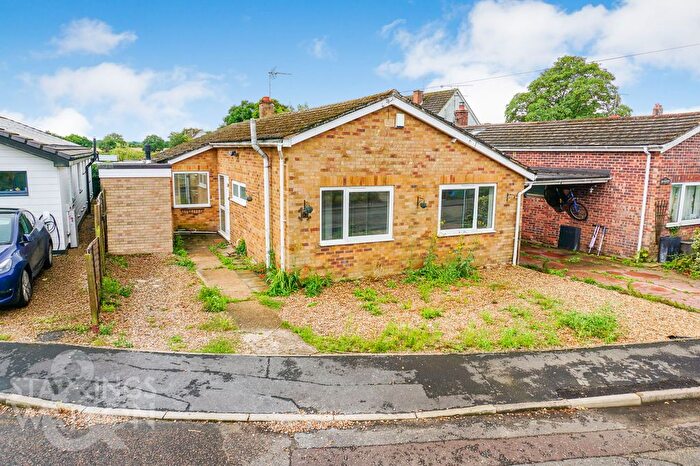
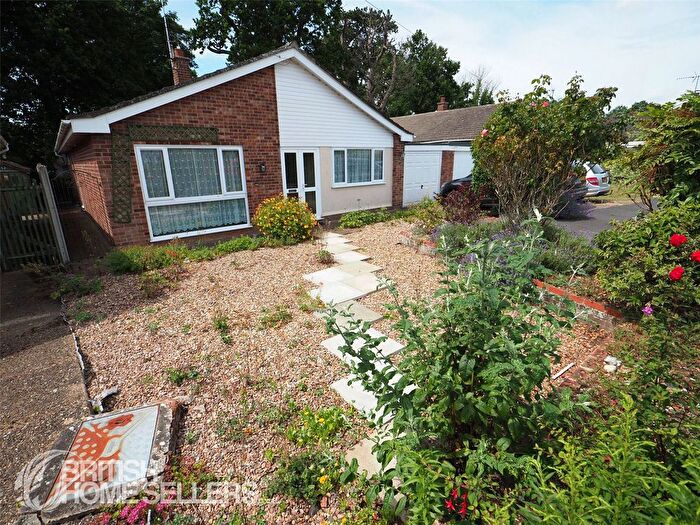
Properties for sale in Gillingham
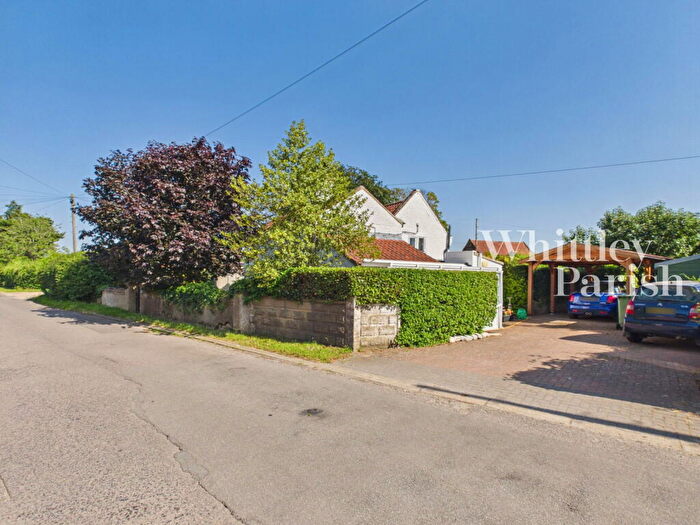
Previously listed properties in Gillingham
![]()
If you are looking to sell your house, let it out, or receive a property valuation, an expert can help you.
Click the button below to get started.

Roads and Postcodes in Gillingham
Navigate through our locations to find the location of your next house in Gillingham, Bungay for sale or to rent.
| Streets | Postcodes |
|---|---|
| Braces Lane | NR35 2ES |
| Chapel Meadow | NR35 2PR |
| Church Road | NR35 2HH |
| Crisp Road | NR35 2HA |
| Geldeston Road | NR35 2ER |
| Hall Road | NR35 2EN |
| Honeypot Lane | NR35 2HW |
| Lockhart Road | NR35 2HB |
| Mill Close | NR35 2PU |
| Mill Cottages | NR35 2EP |
| Mill Lane | NR35 2ET NR35 2PX |
| Mill Road | NR35 2EU NR35 2PS NR35 2PW NR35 2PY |
| Newgate | NR35 2PP |
| Nursey Close | NR35 2HD |
| Old Bungay Road | NR35 2HP |
| Old Post Office Lane | NR35 2HF |
| Old Station Lane | NR35 2EX |
| Old Yarmouth Road | NR35 2PG |
| School Road | NR35 2HL |
| Station Road | NR35 2EW |
| Woodland Drive | NR35 2PT |
| Yarmouth Road | NR35 2HE NR35 2HG NR35 2HJ NR35 2HQ NR35 2PH NR35 2PL NR35 2PN |
| NR35 2PZ |
Property price trends in Gillingham
According to the latest Land Registry data, the average home in Gillingham sold for £318,000 in 2026. That figure comes from 444 sales logged over the past 31 years.
Prices have fallen back over the last three years. Compared with 2023, when the typical sale came in around £551,666, that's a fall of roughly 42.4%.
Looking back five years, average prices are up about 8.3% since 2021, a gain of around £24,410 in cash terms.
Zoom out to the past decade for the fuller picture. Back in 2016, homes here averaged £220,210, so the typical sold price has climbed about 44.4% since then, roughly 3.7% a year. Stretch the view to fifteen years and that annual pace eases back to about 1.8%.
Frequently asked questions about Gillingham
What is the average price for a property for sale in Gillingham?
The average price for a property for sale in Gillingham is £411,722. This amount is 21% higher than the average price in Bungay. There are 84 property listings for sale in Gillingham.
What streets have the most expensive properties for sale in Gillingham?
The streets with the most expensive properties for sale in Gillingham are Mill Cottages at an average of £660,000, Yarmouth Road at an average of £595,707 and Newgate at an average of £463,750.
What streets have the most affordable properties for sale in Gillingham?
The streets with the most affordable properties for sale in Gillingham are Mill Close at an average of £220,000, Chapel Meadow at an average of £225,000 and Woodland Drive at an average of £227,000.
Which train stations are available in or near Gillingham?
Some of the train stations available in or near Gillingham are Beccles, Brampton (Suffolk) and Reedham (Norfolk).
Property Price Paid in Gillingham by Year
The average sold property price by year was:
| Year | Average Sold Price | Price Change |
Sold Properties
|
|---|---|---|---|
| 2026 | £318,000 | -9% |
1 Property |
| 2025 | £347,625 | -19% |
12 Properties |
| 2024 | £414,045 | -33% |
10 Properties |
| 2023 | £551,666 | 22% |
6 Properties |
| 2022 | £430,000 | 32% |
3 Properties |
| 2021 | £293,590 | 5% |
22 Properties |
| 2020 | £278,812 | -10% |
8 Properties |
| 2019 | £306,535 | 18% |
14 Properties |
| 2018 | £250,458 | -30% |
12 Properties |
| 2017 | £326,444 | 33% |
9 Properties |
Property Price per Property Type in Gillingham
Here you can find historic sold price data in order to help with your property search.
The average Property Paid Price for specific property types in the last three years are:
| Property Type | Average Sold Price | Sold Properties |
|---|---|---|
| Semi Detached House | £300,500.00 | 5 Semi Detached Houses |
| Detached House | £434,893.00 | 24 Detached Houses |
