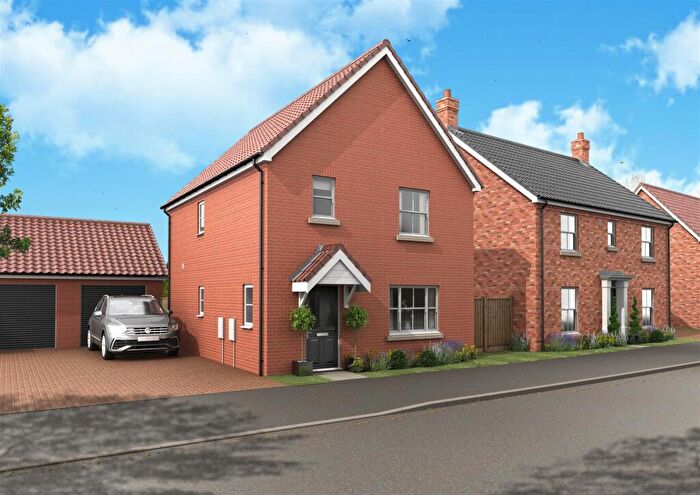
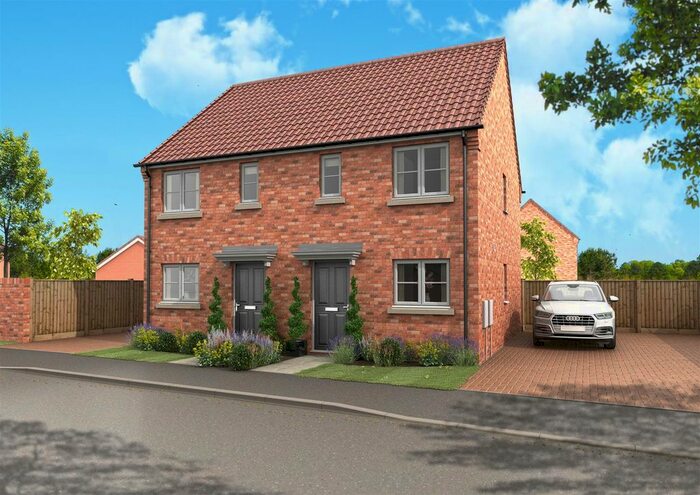
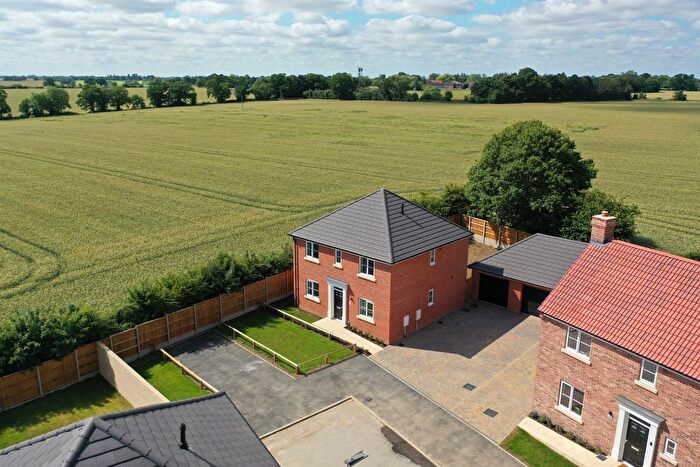
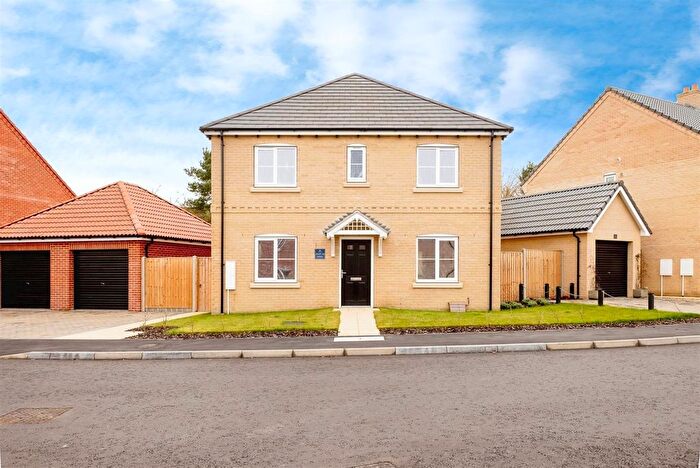
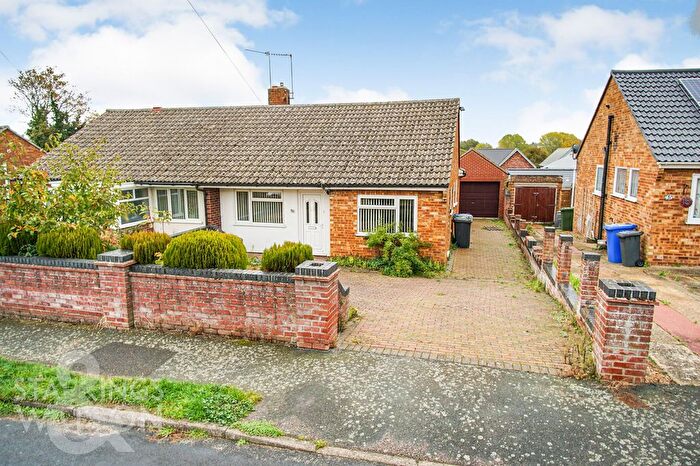
Houses for sale & to rent in Bungay, Bungay
House Prices in Bungay
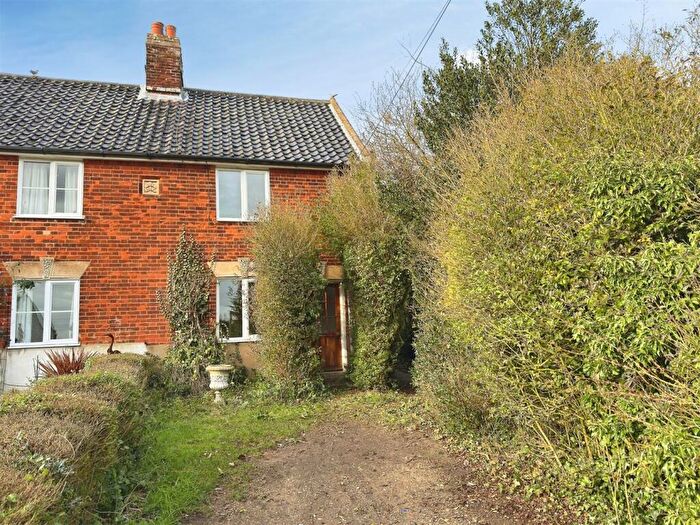
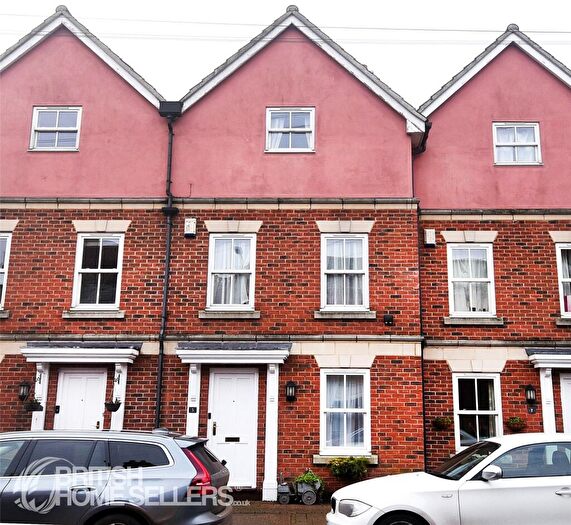
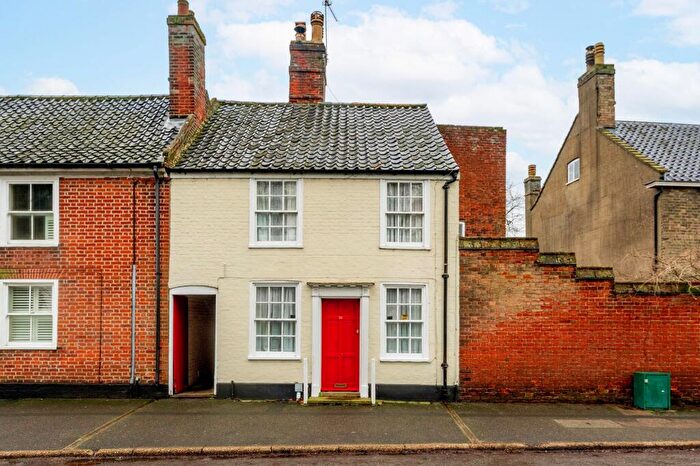
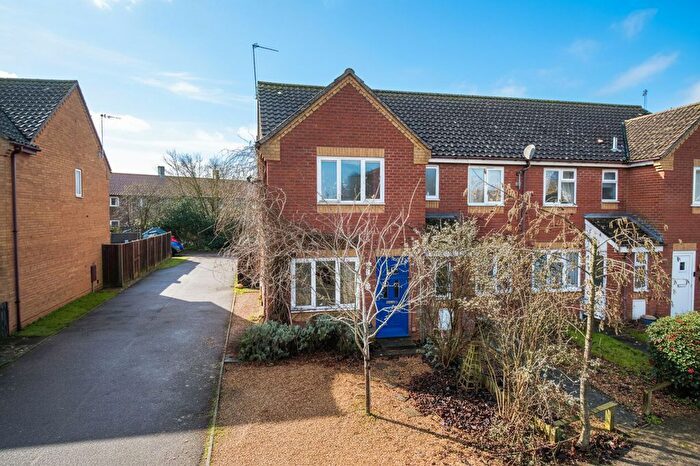
Properties in Bungay have an average house price of £261,641.00 and had 185 Property Transactions within the last 3 years¹.
Bungay is an area in Bungay, Suffolk with 2,172 households², where the most expensive property was sold for £700,000.00.
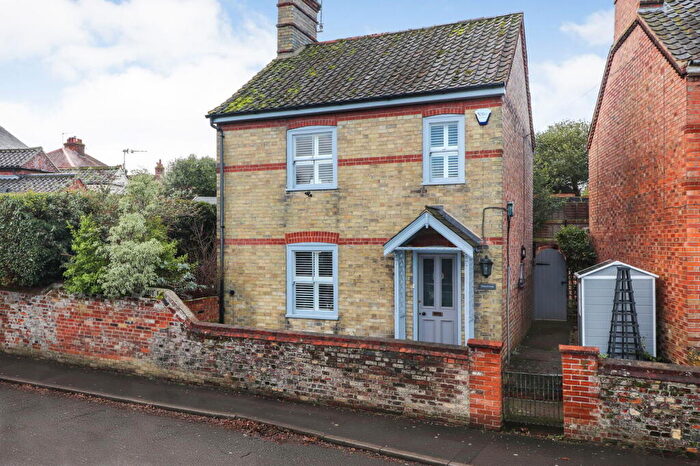
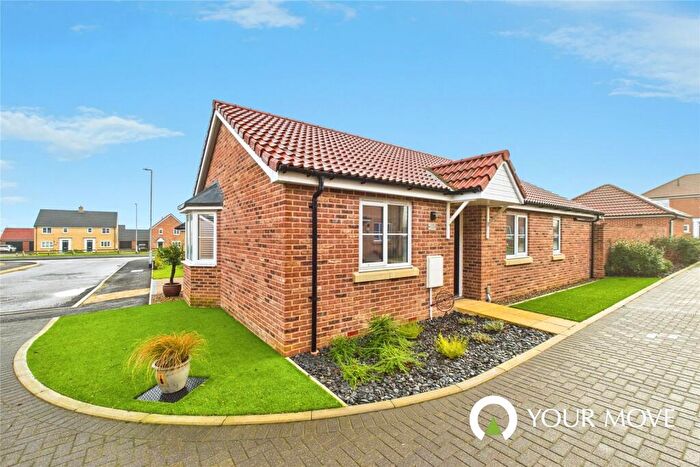
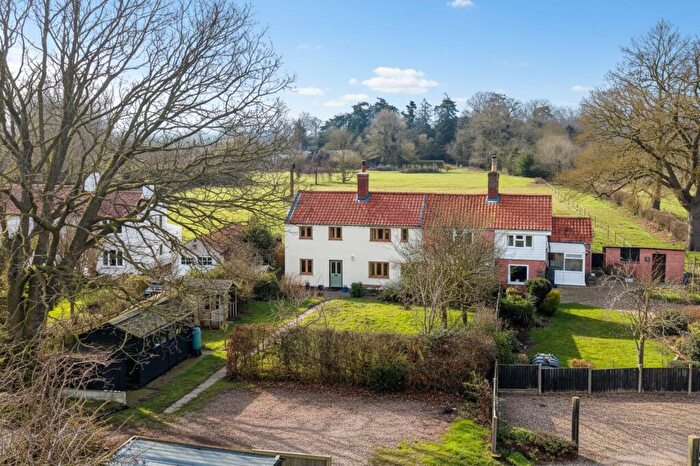
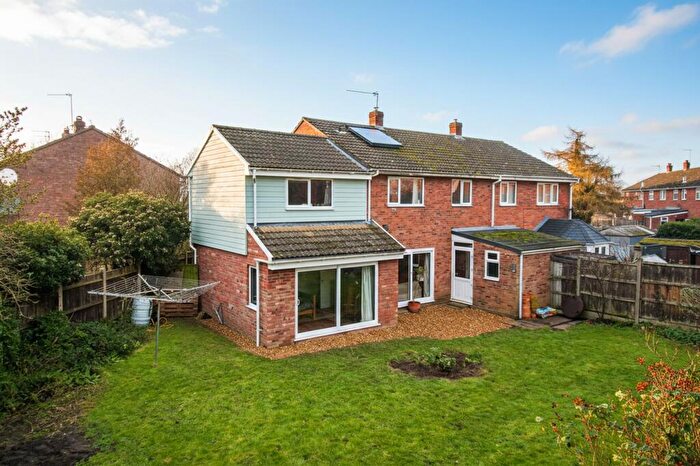
Properties for sale in Bungay
Roads and Postcodes in Bungay
Navigate through our locations to find the location of your next house in Bungay, Bungay for sale or to rent.
| Streets | Postcodes |
|---|---|
| Albion Road | NR35 1LQ |
| Annis Hill | NR35 1TG |
| Annis Hill Lane | NR35 1JQ |
| Annis Hill Road | NR35 1JJ |
| Bardolph Road | NR35 1BN |
| Beccles Road | NR35 1HS NR35 1HT NR35 1HU NR35 1HX NR35 1HY NR35 1HZ NR35 1JA NR35 1JB |
| Bigod Road | NR35 1JP NR35 1JR |
| Boyscott Lane | NR35 1DG |
| Bridge Street | NR35 1HB NR35 1HD |
| Broad Street | NR35 1EE NR35 1EF |
| Castle Lane | NR35 1DE |
| Castle Orchard | NR35 1DD |
| Chaucer Street | NR35 1DT |
| Cross Street | NR35 1AU |
| Davey Close | NR35 1LN |
| Dukes Road | NR35 1RP |
| Earsham Street | NR35 1AE NR35 1AF NR35 1AG NR35 1AQ |
| Elizabeth Bonhote Close | NR35 1SF |
| Ethel Mann Road | NR35 1SG |
| Fairfield Road | NR35 1RY |
| Farm Close | NR35 1JG |
| Festival Flats | NR35 1LD |
| Flixton Road | NR35 1HQ NR35 1PD NR35 1RB |
| Garden Close | NR35 1JD NR35 1JE |
| George Baldry Way | NR35 1SD |
| Hillside Court | NR35 1JY |
| Hillside Road East | NR35 1JT NR35 1JU NR35 1JZ NR35 1RX |
| Hillside Road West | NR35 1PJ NR35 1RF NR35 1RG NR35 1RH NR35 1RQ |
| Howard Road | NR35 1JW |
| Jenner Close | NR35 1QR |
| John Childs Way | NR35 1SE |
| Joyce Road | NR35 1LA NR35 1LB |
| Jubilee Road | NR35 1RE |
| Kents Lane | NR35 1JF |
| Kerrison Road | NR35 1RZ |
| Kings Road | NR35 1RR NR35 1SB |
| Laburnum Road | NR35 1BL |
| Lower Olland Street | NR35 1BX NR35 1BY |
| Manor Road | NR35 1RT NR35 1RU |
| Market Place | NR35 1AP NR35 1AW NR35 1EG |
| Mayfair Road | NR35 1SA |
| Meadow Road | NR35 1LE |
| Meadow View | NR35 1HP |
| Messenger Close | NR35 1PW |
| Millers Close | NR35 1HJ |
| Mountbatten Road | NR35 1PN NR35 1PP |
| Nethergate Street | NR35 1HE |
| Nursey Close | NR35 1DU |
| Oak Mews | NR35 1BA |
| Old Grammar Lane | NR35 1PU |
| Orchids Close | NR35 1LL |
| Outney Road | NR35 1DY NR35 1DZ |
| Pennyfields | NR35 1RD |
| Pilgrims Way | NR35 1HL |
| Princes Road | NR35 1RS |
| Priory Lane | NR35 1DB |
| Queens Road | NR35 1RL NR35 1RN |
| Reeves Close | NR35 1HN |
| Rose Hall Gardens | NR35 1BJ |
| Rose Lane | NR35 1DQ |
| Saxon Place | NR35 1FD |
| Scales Street | NR35 1EA |
| Southend Road | NR35 1DN |
| St Johns Hill | NR35 1PH |
| St Johns Road | NR35 1DH NR35 1DJ NR35 1DL |
| St Margarets Road | NR35 1PL |
| St Marys Street | NR35 1AB NR35 1AX |
| St Marys Terrace | NR35 1DW |
| Staithe Road | NR35 1ET NR35 1EU |
| The Grove | NR35 1JH |
| The Maltings | NR35 1EJ |
| Thomas Bardwell Drive | NR35 1SQ |
| Throckmorton Road | NR35 1JN |
| Tower Mill Road | NR35 1RJ |
| Trinity Gardens | NR35 1HH |
| Trinity Street | NR35 1EH NR35 1EQ |
| Turnstile Lane | NR35 1DA |
| Upper Olland Street | NR35 1BD NR35 1BE NR35 1BG NR35 1BH |
| Victoria Terrace | NR35 1DF |
| Wainford Road | NR35 1TA |
| Waveney Road | NR35 1LH NR35 1LJ |
| Webster Street | NR35 1DX |
| Wharton Street | NR35 1EL |
| Wherry Road | NR35 1LG |
| Willow Gardens | NR35 1DR |
| Wingfield Street | NR35 1EZ |
| Woodland Drive | NR35 1PE |
| Yeomans Close | NR35 1HW |
Transport near Bungay
-
Beccles Station
-
Brampton (Suffolk) Station
-
Halesworth Station
-
Reedham (Norfolk) Station
-
Haddiscoe Station
-
Cantley Station
-
Somerleyton Station
- FAQ
- Price Paid By Year
- Property Type Price
Frequently asked questions about Bungay
What is the average price for a property for sale in Bungay?
The average price for a property for sale in Bungay is £261,641. This amount is 11% lower than the average price in Bungay. There are 1,270 property listings for sale in Bungay.
What streets have the most expensive properties for sale in Bungay?
The streets with the most expensive properties for sale in Bungay are Flixton Road at an average of £432,500, Nethergate Street at an average of £420,000 and Beccles Road at an average of £376,652.
What streets have the most affordable properties for sale in Bungay?
The streets with the most affordable properties for sale in Bungay are Queens Road at an average of £100,000, Market Place at an average of £135,500 and Priory Lane at an average of £150,000.
Which train stations are available in or near Bungay?
Some of the train stations available in or near Bungay are Beccles, Brampton (Suffolk) and Halesworth.
Property Price Paid in Bungay by Year
The average sold property price by year was:
| Year | Average Sold Price | Price Change |
Sold Properties
|
|---|---|---|---|
| 2025 | £270,785 | 15% |
64 Properties |
| 2024 | £231,090 | -20% |
52 Properties |
| 2023 | £276,184 | 4% |
69 Properties |
| 2022 | £264,142 | 5% |
70 Properties |
| 2021 | £250,661 | 3% |
132 Properties |
| 2020 | £244,164 | 10% |
74 Properties |
| 2019 | £218,878 | 4% |
77 Properties |
| 2018 | £210,181 | 7% |
87 Properties |
| 2017 | £195,565 | -5% |
91 Properties |
| 2016 | £206,164 | 13% |
84 Properties |
| 2015 | £180,186 | 5% |
93 Properties |
| 2014 | £171,990 | 3% |
89 Properties |
| 2013 | £167,055 | 3% |
85 Properties |
| 2012 | £161,763 | 3% |
61 Properties |
| 2011 | £156,400 | -13% |
75 Properties |
| 2010 | £176,225 | 7% |
85 Properties |
| 2009 | £163,817 | -4% |
67 Properties |
| 2008 | £170,967 | -4% |
63 Properties |
| 2007 | £177,283 | 10% |
128 Properties |
| 2006 | £159,610 | 6% |
109 Properties |
| 2005 | £149,721 | -2% |
79 Properties |
| 2004 | £152,526 | 14% |
131 Properties |
| 2003 | £131,535 | 28% |
119 Properties |
| 2002 | £94,745 | 11% |
133 Properties |
| 2001 | £84,529 | 8% |
135 Properties |
| 2000 | £77,677 | 22% |
114 Properties |
| 1999 | £60,533 | 9% |
132 Properties |
| 1998 | £54,802 | -5% |
117 Properties |
| 1997 | £57,694 | 17% |
108 Properties |
| 1996 | £48,057 | -1% |
77 Properties |
| 1995 | £48,767 | - |
81 Properties |
Property Price per Property Type in Bungay
Here you can find historic sold price data in order to help with your property search.
The average Property Paid Price for specific property types in the last three years are:
| Property Type | Average Sold Price | Sold Properties |
|---|---|---|
| Semi Detached House | £242,174.00 | 59 Semi Detached Houses |
| Detached House | £331,052.00 | 61 Detached Houses |
| Terraced House | £221,891.00 | 58 Terraced Houses |
| Flat | £150,214.00 | 7 Flats |

