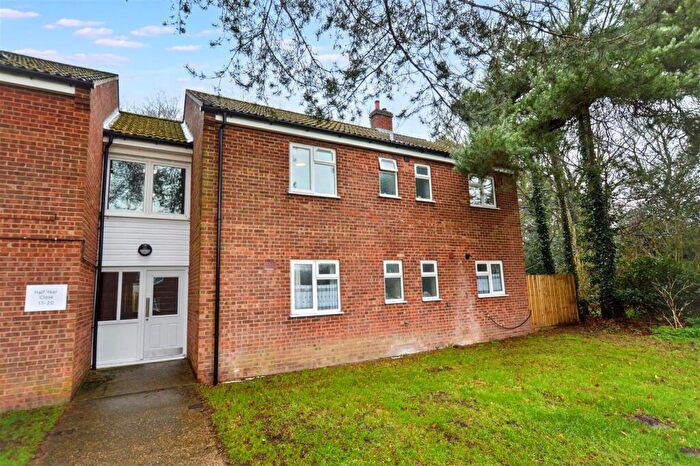
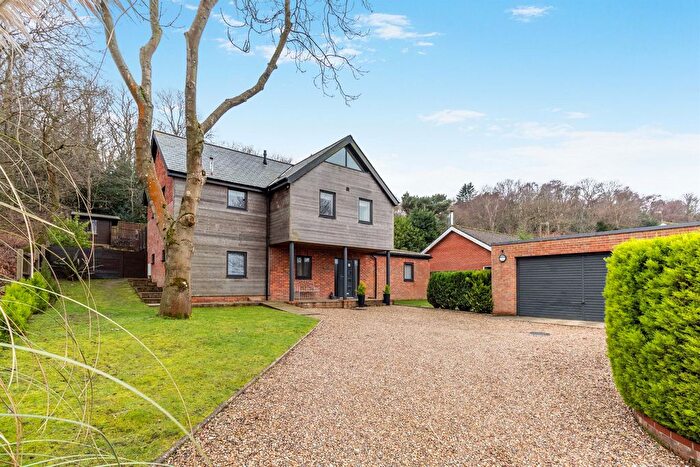
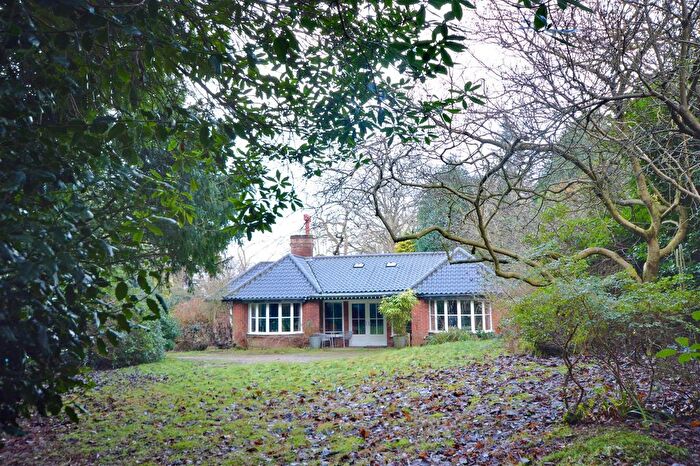
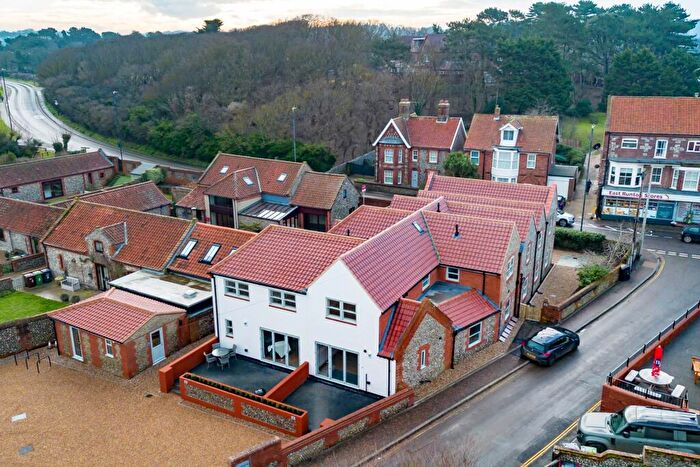
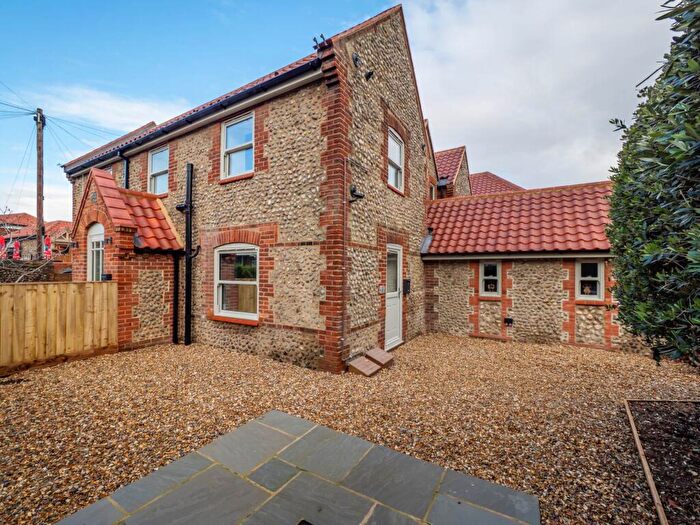
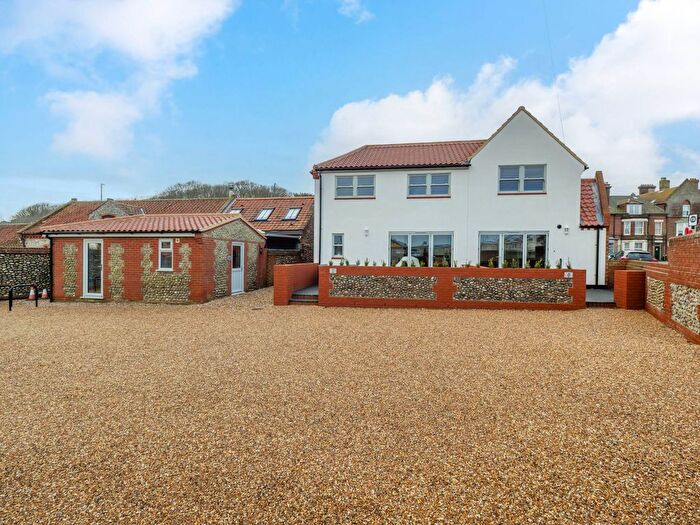
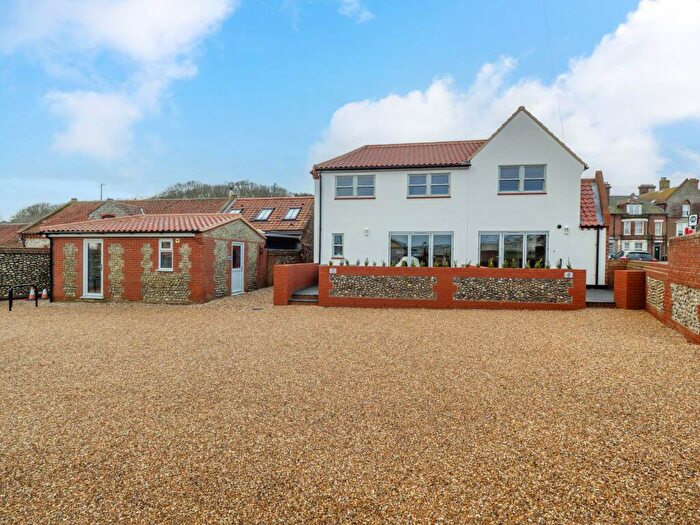
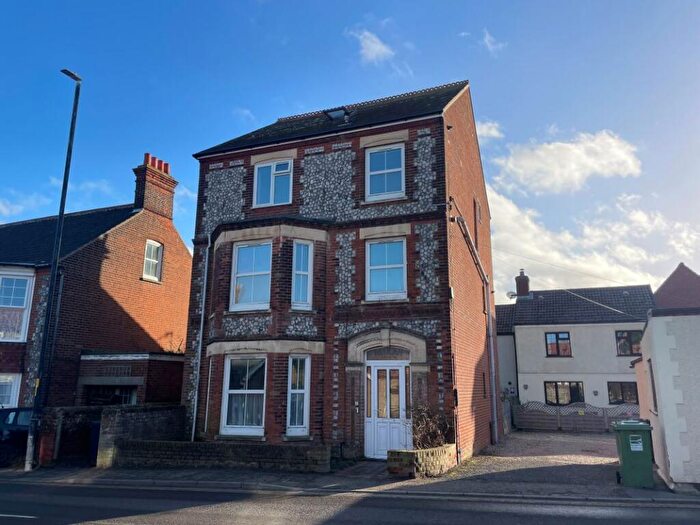
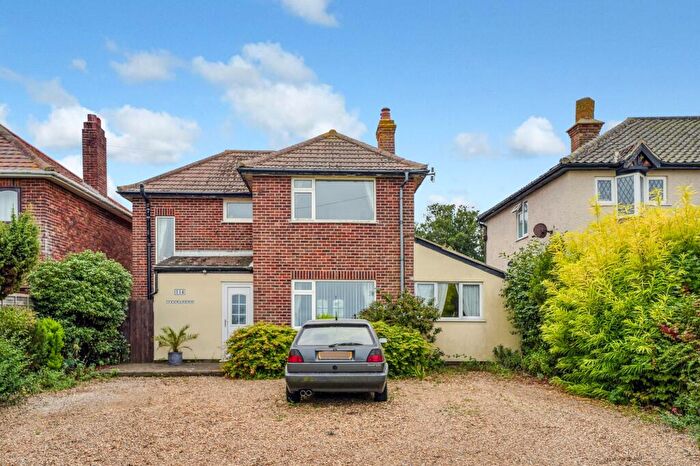
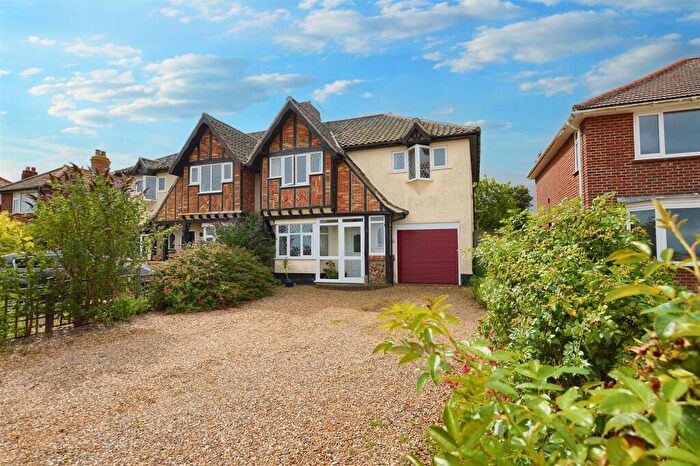
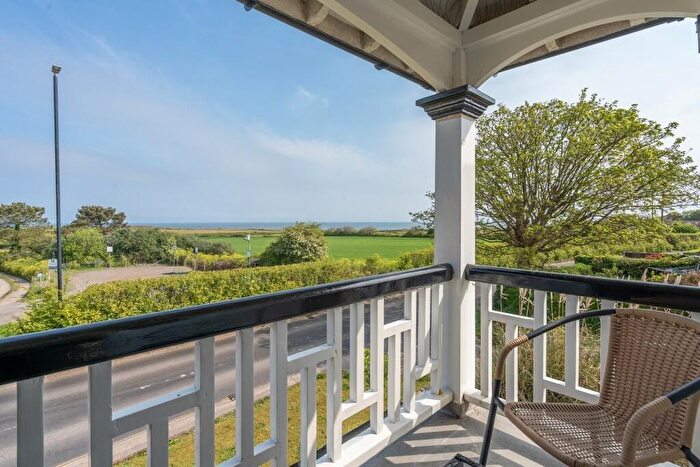
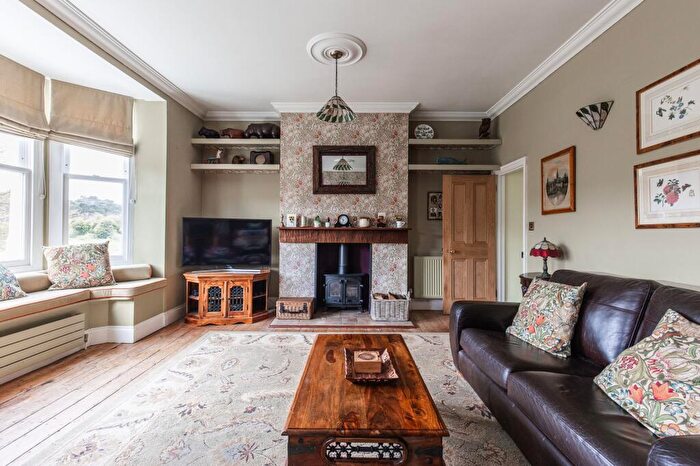
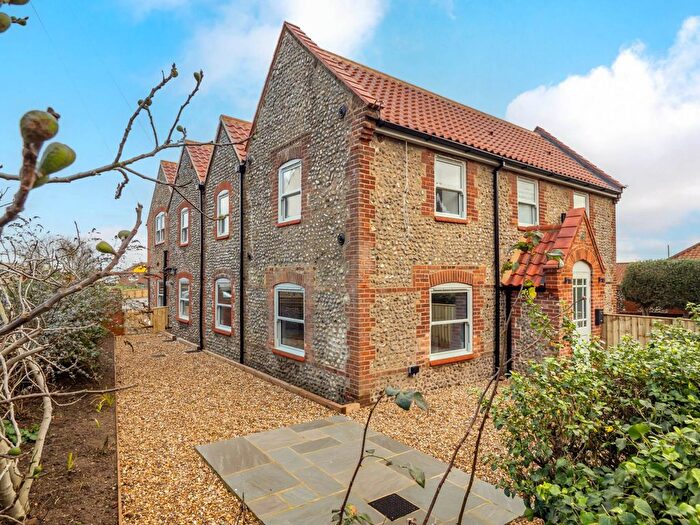
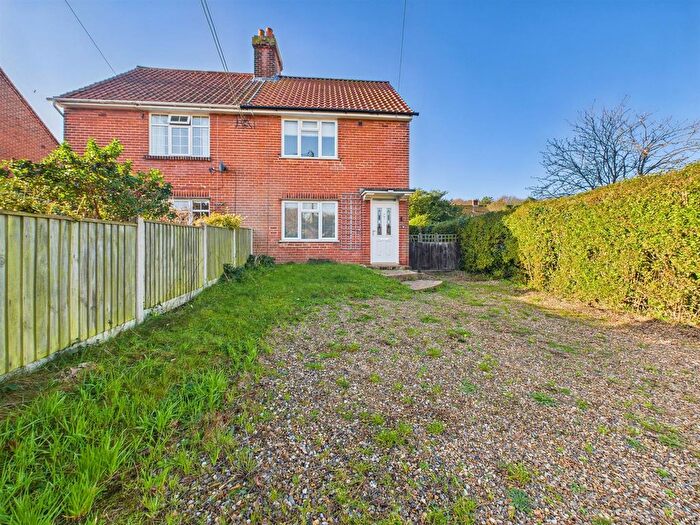
Houses for sale & to rent in The Runtons, Cromer
House Prices in The Runtons
Properties in The Runtons have an average house price of £398,617.00 and had 93 Property Transactions within the last 3 years¹.
The Runtons is an area in Cromer, Norfolk with 789 households², where the most expensive property was sold for £1,100,000.00.
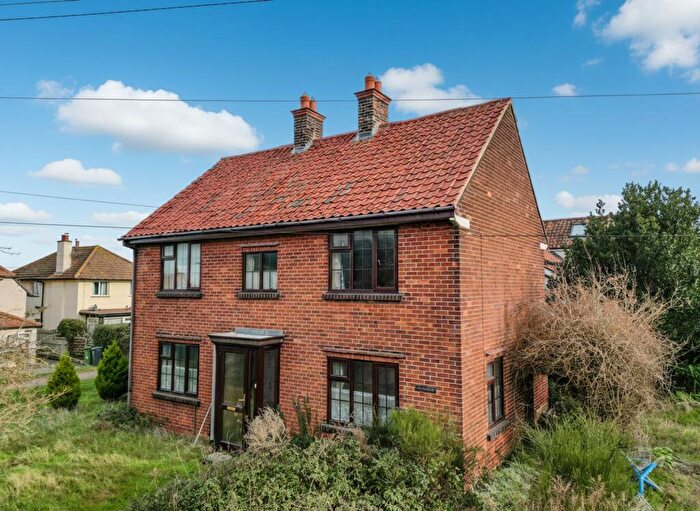
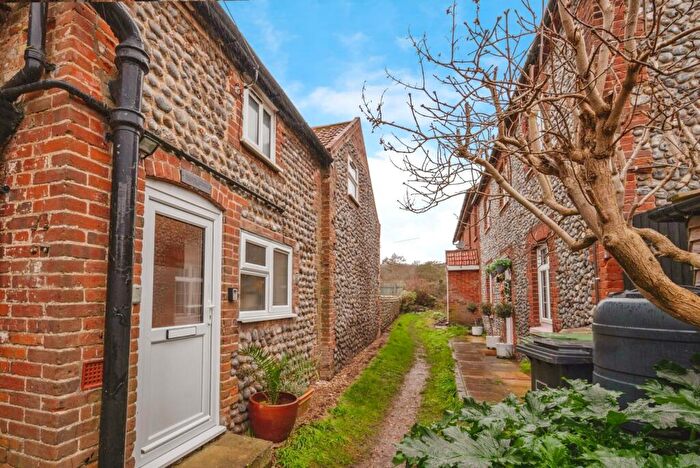
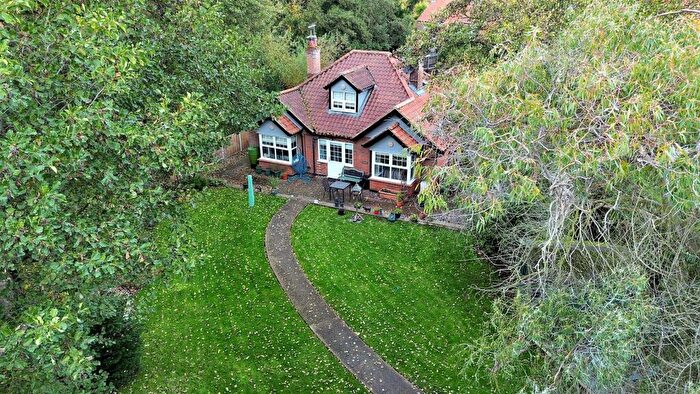
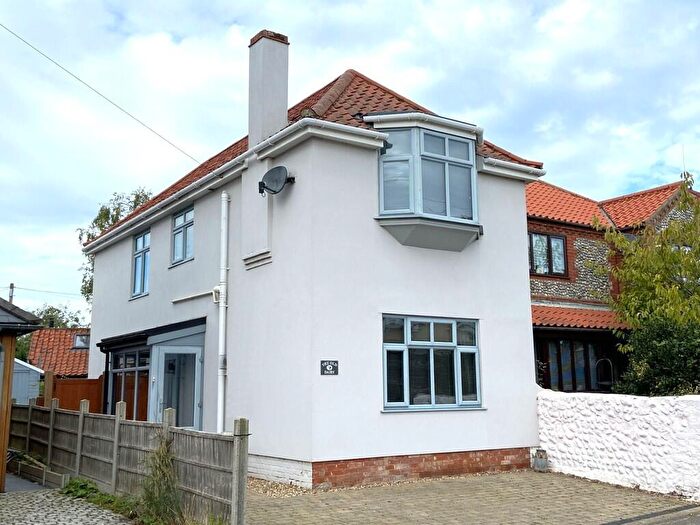
Properties for sale in The Runtons
Previously listed properties in The Runtons
Roads and Postcodes in The Runtons
Navigate through our locations to find the location of your next house in The Runtons, Cromer for sale or to rent.
| Streets | Postcodes |
|---|---|
| Balfour Road | NR27 9QJ |
| Banville Lane | NR27 9RN |
| Beach Road | NR27 9PA |
| Boulevard Road | NR27 9QL |
| Broomhill | NR27 9PF |
| Buxton Close | NR27 9PJ |
| Calves Well Lane | NR27 9LU |
| Camp Lane | NR27 9ND |
| Church Cottages | NR27 9QU |
| Church Lane | NR27 9QX |
| Cromer Road | NR27 9AD NR27 9NH NR27 9QA NR27 9QT |
| Felbrigg Road | NR27 9PE |
| Golf Close | NR27 9QB |
| Half Year Close | NR27 9PT |
| High Street | NR27 9AB NR27 9NS NR27 9NU NR27 9NX NR27 9PB |
| Home Close | NR27 9QF |
| Incleborough Close | NR27 9PU |
| Links Way | NR27 9QQ |
| Long Acre | NR27 9NN |
| Lower Common | NR27 9PG |
| Mill Lane | NR27 9PH |
| Newell Crescent | NR27 9QR |
| Olley Road | NR27 9QN |
| Renwick Park East | NR27 9LY |
| Renwick Park West | NR27 9LX |
| Rosebery Road | NR27 9QW |
| Runton House Close | NR27 9RA |
| Sandy Lane | NR27 9LT NR27 9NB NR27 9NE NR27 9QH |
| Shawcross Road | NR27 9NA |
| Shepherds Close | NR27 9PQ |
| Station Close | NR27 9QG |
| Station Road | NR27 9QD |
| Thains Lane | NR27 9PD |
| The Common | NR27 9QE |
| The Hurn | NR27 9QS |
| The Springles | NR27 9PS |
| Top Common | NR27 9PN NR27 9PP NR27 9PR NR27 9PW |
| Victoria Terrace | NR27 9NY |
| Water Lane | NR27 9QP |
| Wells Yard | NR27 9NT |
| Wyndham Park | NR27 9NJ |
Transport near The Runtons
- FAQ
- Price Paid By Year
- Property Type Price
Frequently asked questions about The Runtons
What is the average price for a property for sale in The Runtons?
The average price for a property for sale in The Runtons is £398,617. This amount is 24% higher than the average price in Cromer. There are 80 property listings for sale in The Runtons.
What streets have the most expensive properties for sale in The Runtons?
The streets with the most expensive properties for sale in The Runtons are Home Close at an average of £657,500, Water Lane at an average of £522,500 and Top Common at an average of £496,848.
What streets have the most affordable properties for sale in The Runtons?
The streets with the most affordable properties for sale in The Runtons are Runton House Close at an average of £197,000, High Street at an average of £238,195 and Wyndham Park at an average of £280,900.
Which train stations are available in or near The Runtons?
Some of the train stations available in or near The Runtons are West Runton, Cromer and Sheringham.
Property Price Paid in The Runtons by Year
The average sold property price by year was:
| Year | Average Sold Price | Price Change |
Sold Properties
|
|---|---|---|---|
| 2025 | £337,895 | -9% |
31 Properties |
| 2024 | £369,033 | -29% |
27 Properties |
| 2023 | £475,221 | 10% |
35 Properties |
| 2022 | £427,306 | 10% |
43 Properties |
| 2021 | £385,076 | 5% |
36 Properties |
| 2020 | £365,138 | 14% |
36 Properties |
| 2019 | £314,548 | 13% |
39 Properties |
| 2018 | £273,341 | -24% |
32 Properties |
| 2017 | £339,499 | 1% |
33 Properties |
| 2016 | £337,166 | 19% |
25 Properties |
| 2015 | £272,386 | 7% |
40 Properties |
| 2014 | £253,684 | 13% |
35 Properties |
| 2013 | £221,268 | 2% |
37 Properties |
| 2012 | £216,147 | -0,2% |
17 Properties |
| 2011 | £216,530 | -9% |
33 Properties |
| 2010 | £236,703 | -7% |
32 Properties |
| 2009 | £254,106 | -1% |
22 Properties |
| 2008 | £256,268 | 5% |
26 Properties |
| 2007 | £244,176 | 12% |
55 Properties |
| 2006 | £214,442 | -7% |
45 Properties |
| 2005 | £229,070 | 11% |
32 Properties |
| 2004 | £204,762 | 27% |
43 Properties |
| 2003 | £150,475 | 9% |
31 Properties |
| 2002 | £136,569 | 18% |
39 Properties |
| 2001 | £111,943 | 22% |
44 Properties |
| 2000 | £86,941 | 14% |
29 Properties |
| 1999 | £75,026 | 2% |
54 Properties |
| 1998 | £73,300 | 9% |
55 Properties |
| 1997 | £66,846 | 1% |
56 Properties |
| 1996 | £66,193 | 5% |
44 Properties |
| 1995 | £63,202 | - |
31 Properties |
Property Price per Property Type in The Runtons
Here you can find historic sold price data in order to help with your property search.
The average Property Paid Price for specific property types in the last three years are:
| Property Type | Average Sold Price | Sold Properties |
|---|---|---|
| Semi Detached House | £348,833.00 | 9 Semi Detached Houses |
| Detached House | £480,397.00 | 56 Detached Houses |
| Terraced House | £280,620.00 | 20 Terraced Houses |
| Flat | £177,156.00 | 8 Flats |

