
Houses for sale & to rent in The Runtons, Norwich
House Prices in The Runtons
Properties in The Runtons have an average house price of £469k and had 28 Property Transactions within the last 3 years¹.
The Runtons is an area in Norwich, Norfolk with 183 households², where the most expensive property was sold for £1.05M.
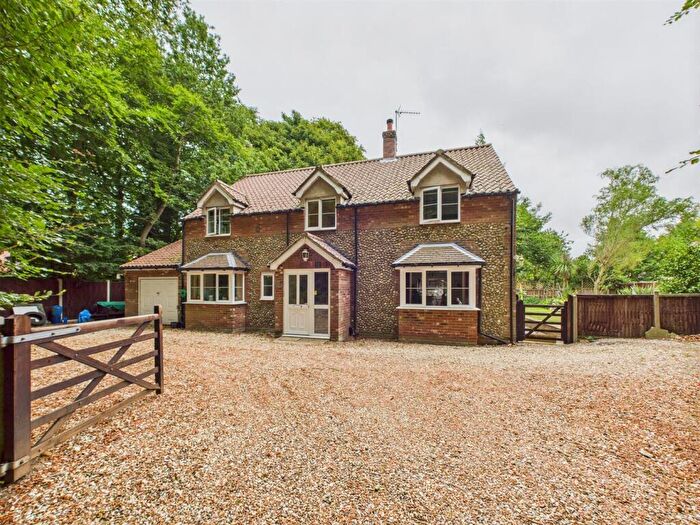
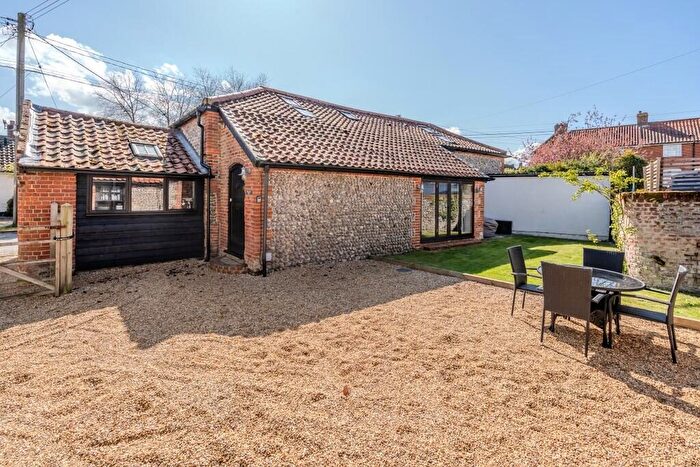
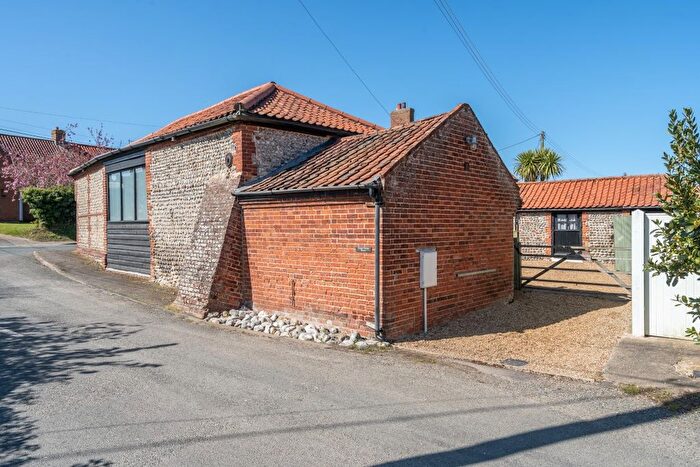
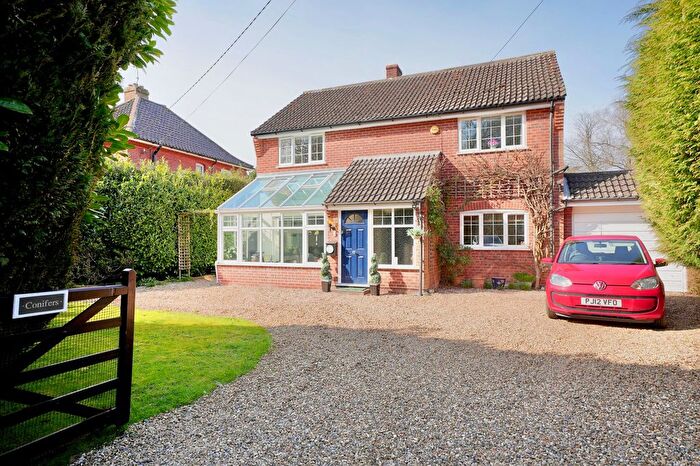
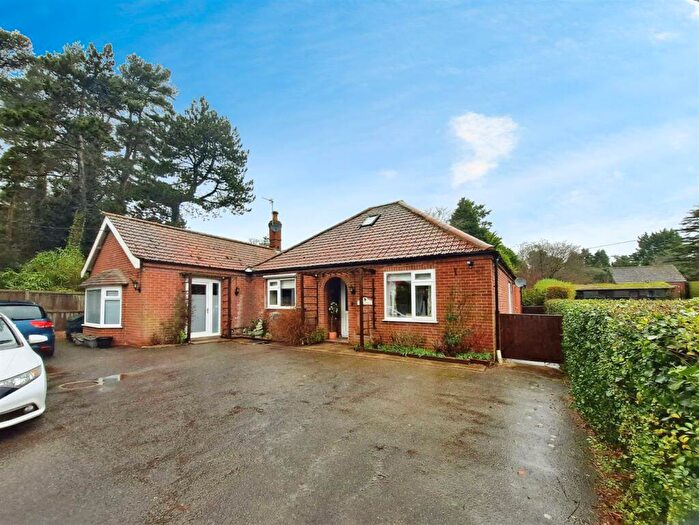
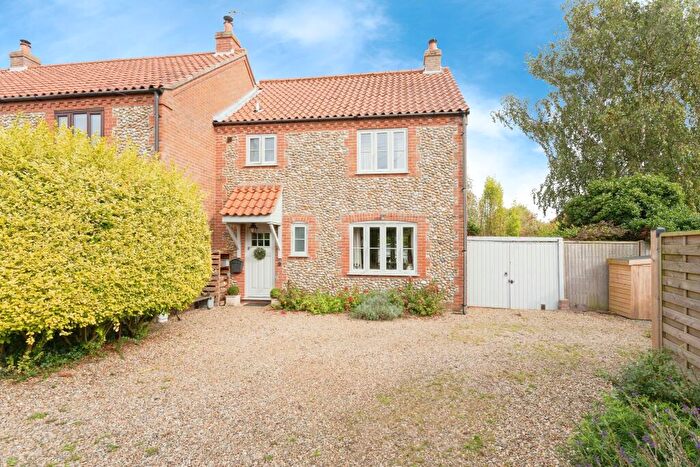
Properties for sale in The Runtons
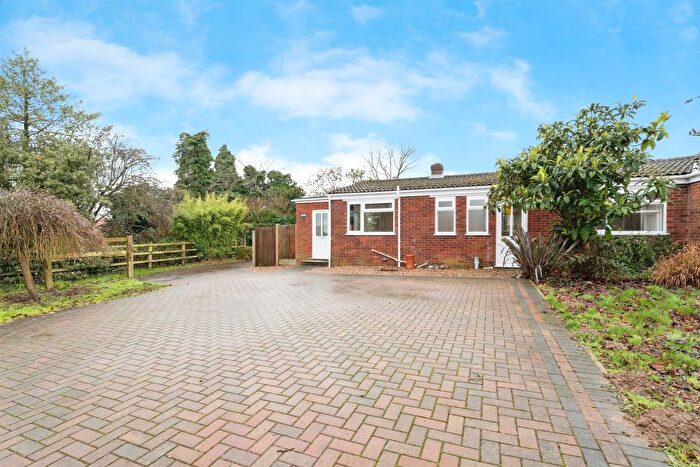
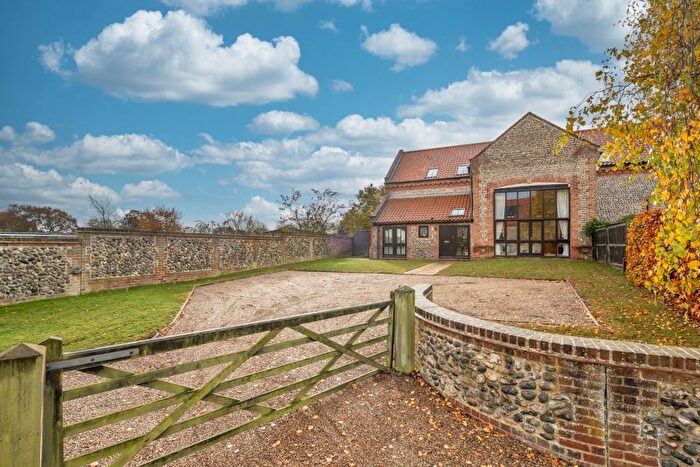

![]()
If you are looking to sell your house, let it out, or receive a property valuation, an expert can help you.
Click the button below to get started.
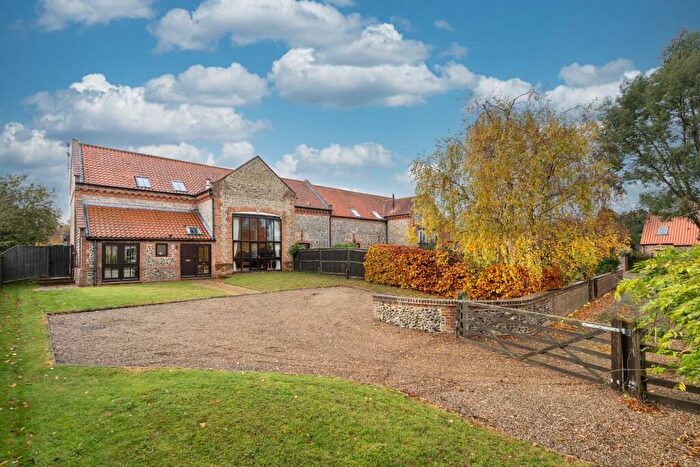
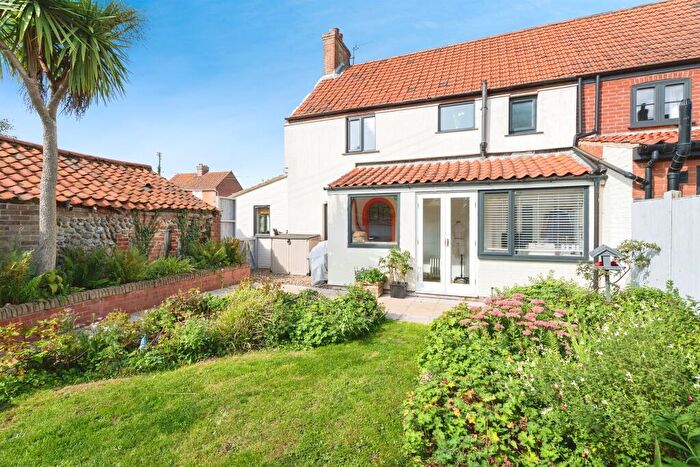
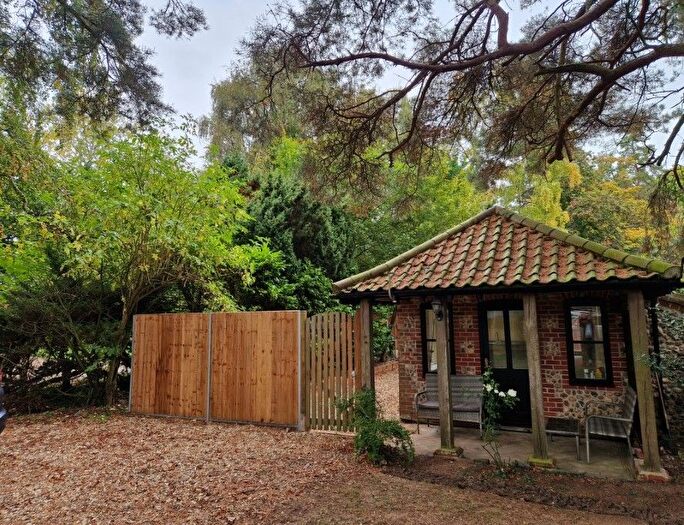
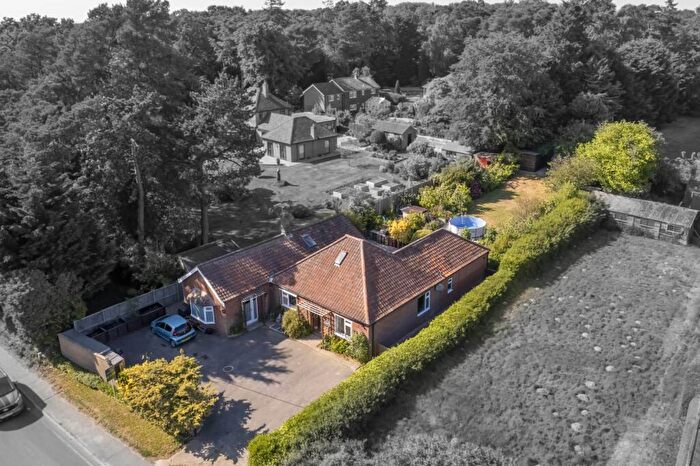
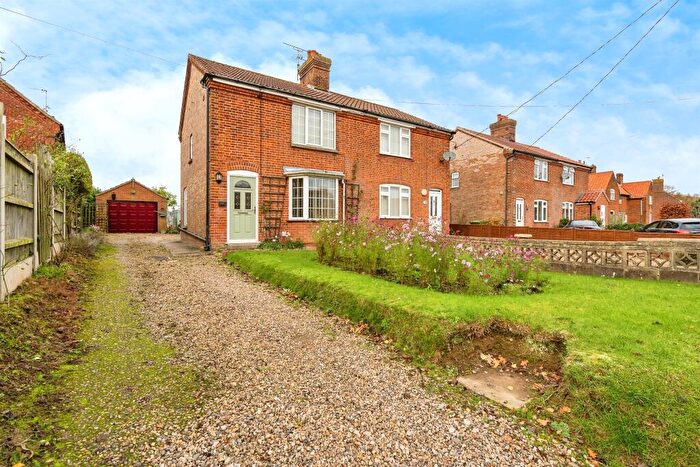
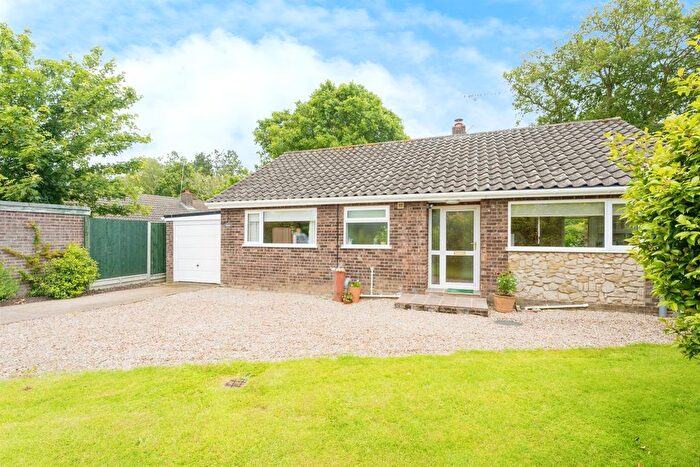
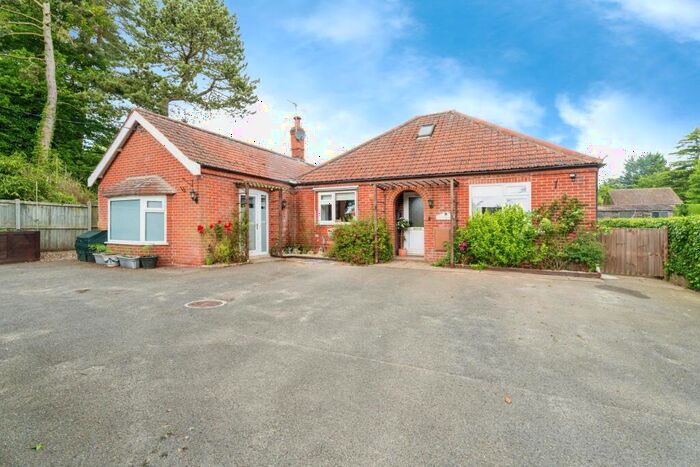
Previously listed properties in The Runtons

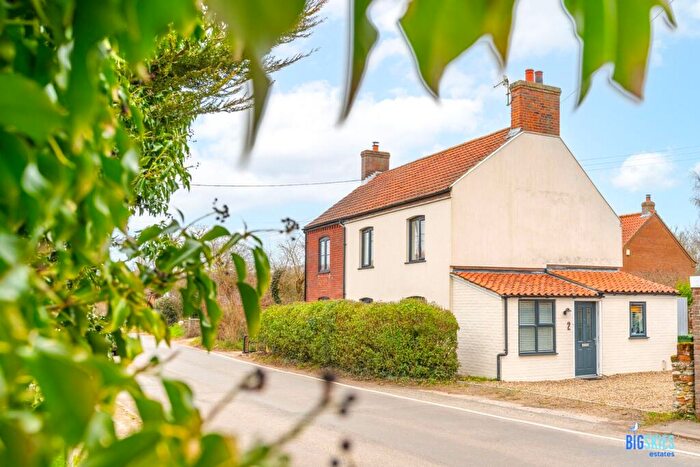
![]()
If you are looking to sell your house, let it out, or receive a property valuation, an expert can help you.
Click the button below to get started.


Roads and Postcodes in The Runtons
Navigate through our locations to find the location of your next house in The Runtons, Norwich for sale or to rent.
| Streets | Postcodes |
|---|---|
| Beechwood Avenue | NR11 8QQ |
| Church Road | NR11 8PZ |
| Holt Road | NR11 8QA NR11 8QD |
| Sandy Lane | NR11 8QE |
| School Road | NR11 8RA |
| The Close | NR11 8PX |
| The Street | NR11 8AA |
| Tower Road | NR11 8QG |
| NR11 8PT NR11 8PU |
Transport near The Runtons

- FAQ
- Price Paid By Year
- Property Type Price
Frequently asked questions about The Runtons
What is the average price for a property for sale in The Runtons?
The average price for a property for sale in The Runtons is £469,401. This amount is 52% higher than the average price in Norwich. There are 37 property listings for sale in The Runtons.
What streets have the most expensive properties for sale in The Runtons?
The streets with the most expensive properties for sale in The Runtons are Holt Road at an average of £548,375, Sandy Lane at an average of £540,000 and The Street at an average of £504,400.
What streets have the most affordable properties for sale in The Runtons?
The streets with the most affordable properties for sale in The Runtons are The Close at an average of £247,997, Church Road at an average of £350,625 and Beechwood Avenue at an average of £468,458.
Which train stations are available in or near The Runtons?
Some of the train stations available in or near The Runtons are West Runton, Roughton Road and Cromer.
Property Price Paid in The Runtons by Year
The average sold property price by year was:
| Year | Average Sold Price | Price Change |
Sold Properties
|
|---|---|---|---|
| 2025 | £550,000 | 18% |
9 Properties |
| 2024 | £448,354 | 10% |
12 Properties |
| 2023 | £401,856 | -29% |
7 Properties |
| 2022 | £517,662 | 22% |
12 Properties |
| 2021 | £404,197 | 19% |
17 Properties |
| 2020 | £326,571 | -15% |
7 Properties |
| 2019 | £376,672 | 3% |
10 Properties |
| 2018 | £364,761 | 13% |
9 Properties |
| 2017 | £317,428 | 4% |
7 Properties |
| 2016 | £304,950 | 13% |
10 Properties |
| 2015 | £265,487 | -1% |
4 Properties |
| 2014 | £267,000 | 25% |
6 Properties |
| 2013 | £201,261 | -21% |
13 Properties |
| 2012 | £243,265 | 10% |
7 Properties |
| 2011 | £218,000 | -43% |
4 Properties |
| 2010 | £311,875 | 19% |
4 Properties |
| 2009 | £253,333 | -32% |
6 Properties |
| 2008 | £334,000 | 30% |
5 Properties |
| 2007 | £233,362 | 18% |
8 Properties |
| 2006 | £191,990 | -9% |
10 Properties |
| 2005 | £209,450 | 20% |
10 Properties |
| 2004 | £167,500 | -25% |
5 Properties |
| 2003 | £208,812 | 6% |
4 Properties |
| 2002 | £196,645 | 31% |
20 Properties |
| 2001 | £136,353 | 23% |
14 Properties |
| 2000 | £105,160 | -16% |
8 Properties |
| 1999 | £122,388 | 29% |
9 Properties |
| 1998 | £87,440 | 1% |
10 Properties |
| 1997 | £86,316 | -17% |
3 Properties |
| 1996 | £101,416 | 32% |
6 Properties |
| 1995 | £68,495 | - |
11 Properties |
Property Price per Property Type in The Runtons
Here you can find historic sold price data in order to help with your property search.
The average Property Paid Price for specific property types in the last three years are:
| Property Type | Average Sold Price | Sold Properties |
|---|---|---|
| Semi Detached House | £389,499.00 | 8 Semi Detached Houses |
| Terraced House | £392,500.00 | 2 Terraced Houses |
| Detached House | £513,458.00 | 18 Detached Houses |