
Houses for sale in Burnham, Fakenham
House Prices in Burnham
Properties in Burnham have an average house price of £485k and had 18 Property Transactions within the last 3 years¹.
Burnham is an area in Fakenham, Norfolk with 144 households², where the most expensive property was sold for £1.85M.
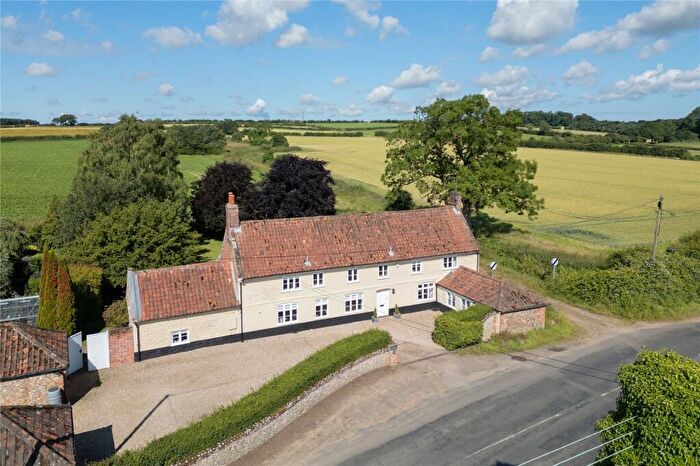
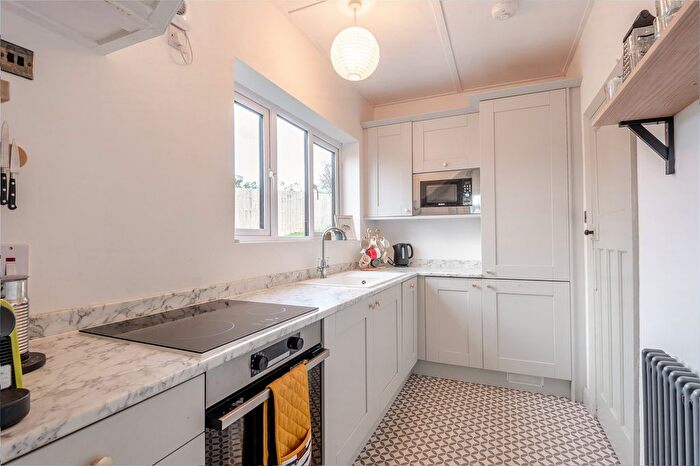
Properties for sale in Burnham
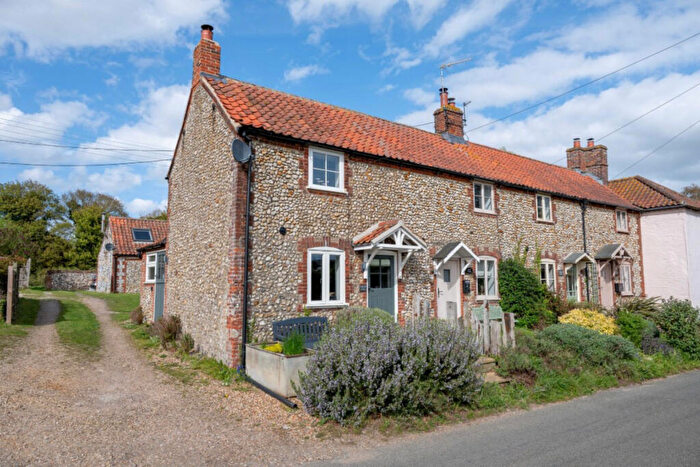
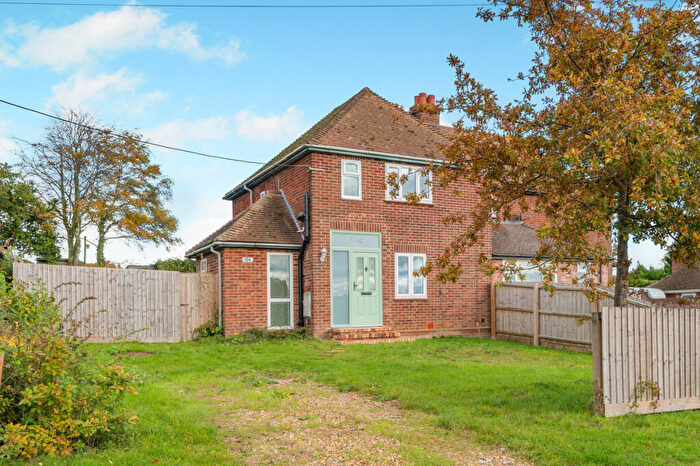
![]()
If you are looking to sell your house, let it out, or receive a property valuation, an expert can help you.
Click the button below to get started.


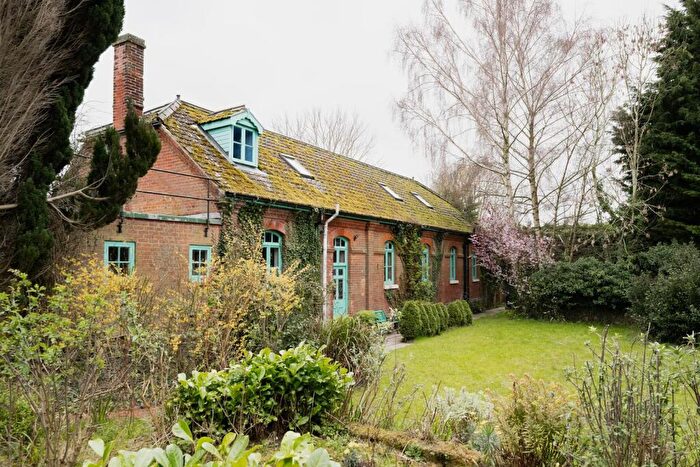
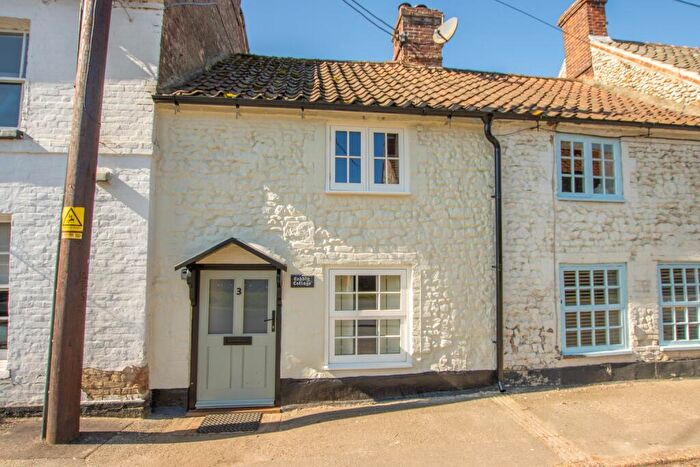
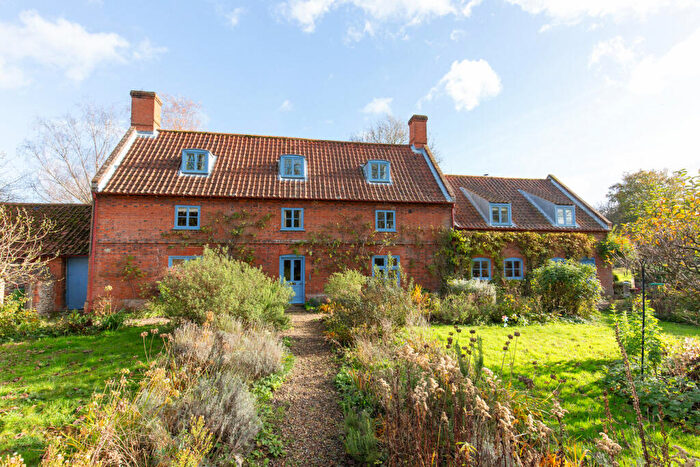
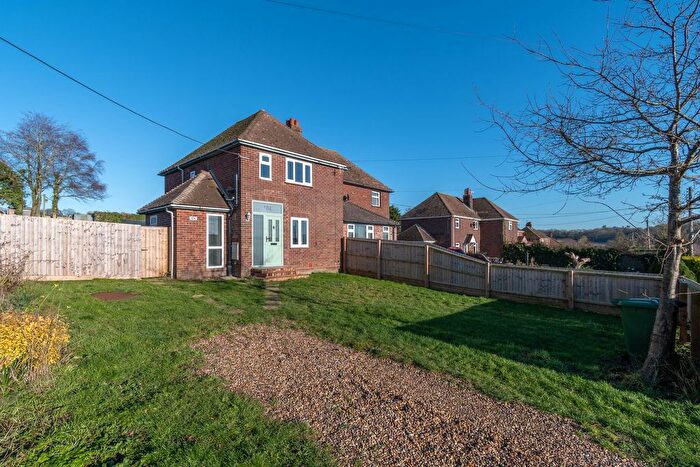
Previously listed properties in Burnham


![]()
If you are looking to sell your house, let it out, or receive a property valuation, an expert can help you.
Click the button below to get started.


Roads and Postcodes in Burnham
Navigate through our locations to find the location of your next house in Burnham, Fakenham for sale or to rent.
| Streets | Postcodes |
|---|---|
| Burnham Road | NR21 9JP NR21 9JR NR21 9JS NR21 9JW NR21 9JZ NR21 9LA NR21 9LB |
| Church Street | NR21 9AD NR21 9JJ NR21 9JN |
| Dunns Lane | NR21 9JT NR21 9JU NR21 9JX |
| Normans Lane | NR21 9LD |
| The Paddock | NR21 9JY |
| Wells Road | NR21 9LG |
| West Street | NR21 9LH NR21 9LQ |
| Whin Hill | NR21 9JL |
| NR21 9LF |
Property price trends in Burnham
According to the latest Land Registry data, the average home in Burnham sold for £312,000 in 2026. That figure comes from 249 sales logged over the past 31 years.
Prices have fallen back over the last three years. Compared with 2023, when the typical sale came in around £469,000, that's a fall of roughly 33.5%.
Looking back five years, average prices are down about 25.7% since 2021, a drop of around £107,965 in cash terms.
Zoom out to the past decade for the fuller picture. Back in 2016, homes here averaged £275,964, so the typical sold price has climbed about 13.1% since then, roughly 1.2% a year. Stretch the view to fifteen years and that annual pace edges up closer to 1.6%.
Frequently asked questions about Burnham
What is the average price for a property for sale in Burnham?
The average price for a property for sale in Burnham is £485,138. This amount is 50% higher than the average price in Fakenham. There are 41 property listings for sale in Burnham.
What streets have the most expensive properties for sale in Burnham?
The streets with the most expensive properties for sale in Burnham are West Street at an average of £647,900 and Burnham Road at an average of £447,750.
What streets have the most affordable properties for sale in Burnham?
The streets with the most affordable properties for sale in Burnham are The Paddock at an average of £353,500 and Church Street at an average of £384,000.
Which train stations are available in or near Burnham?
Some of the train stations available in or near Burnham are King's Lynn, Sheringham and West Runton.
Property Price Paid in Burnham by Year
The average sold property price by year was:
| Year | Average Sold Price | Price Change |
Sold Properties
|
|---|---|---|---|
| 2026 | £312,000 | -51% |
1 Property |
| 2025 | £470,000 | -19% |
4 Properties |
| 2024 | £557,700 | 16% |
5 Properties |
| 2023 | £469,000 | 17% |
8 Properties |
| 2022 | £389,114 | -8% |
5 Properties |
| 2021 | £419,965 | -6% |
14 Properties |
| 2020 | £445,000 | 33% |
7 Properties |
| 2019 | £300,166 | -58% |
7 Properties |
| 2018 | £472,850 | 8% |
10 Properties |
| 2017 | £435,186 | 37% |
8 Properties |
Property Price per Property Type in Burnham
Here you can find historic sold price data in order to help with your property search.
The average Property Paid Price for specific property types in the last three years are:
| Property Type | Average Sold Price | Sold Properties |
|---|---|---|
| Semi Detached House | £295,857.00 | 7 Semi Detached Houses |
| Terraced House | £583,785.00 | 7 Terraced Houses |
| Detached House | £643,750.00 | 4 Detached Houses |
