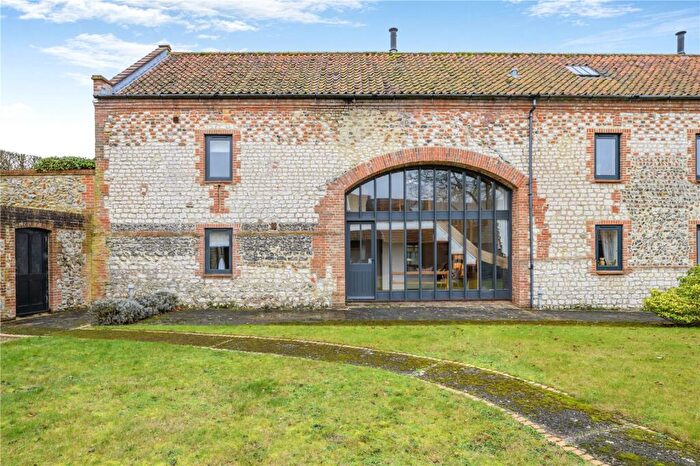
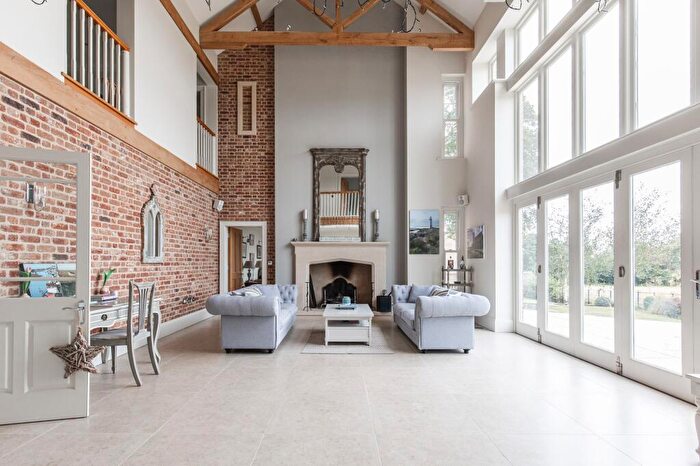
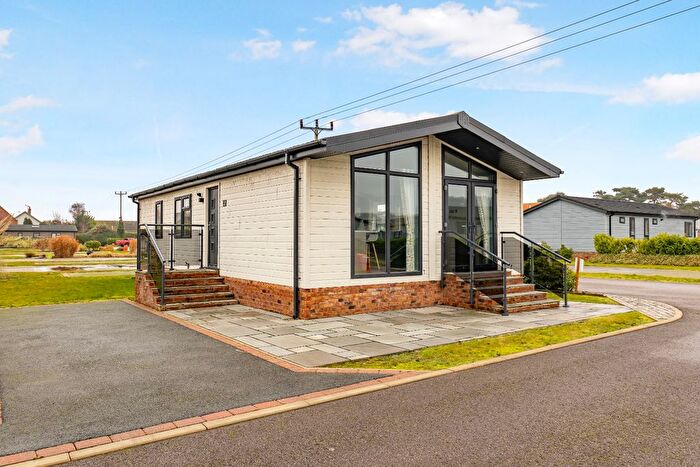
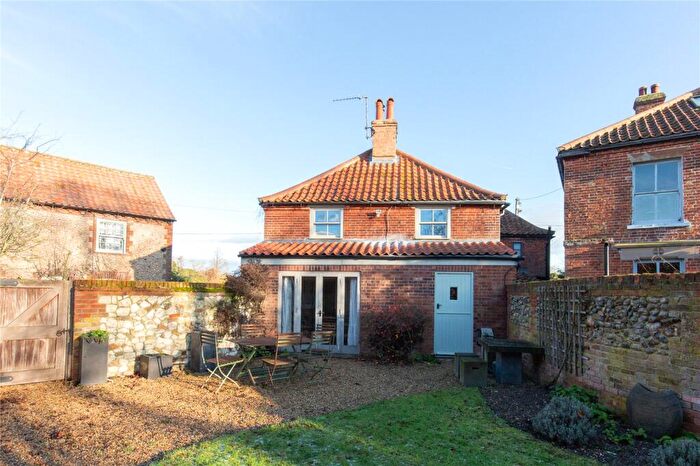
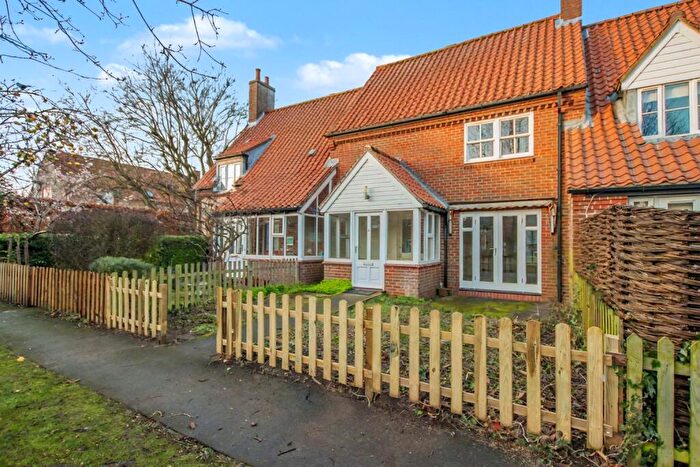
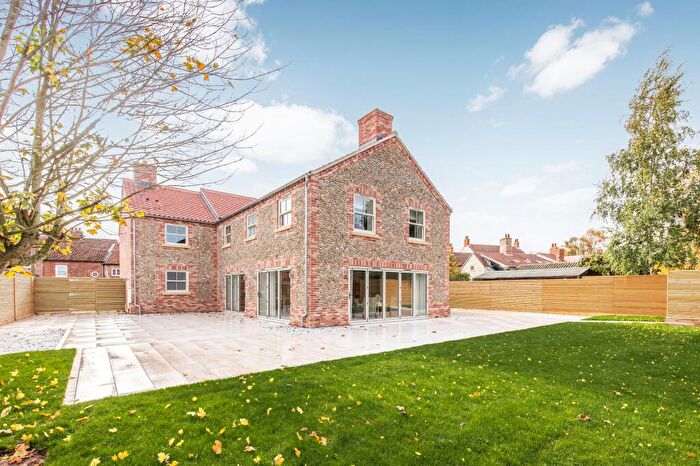
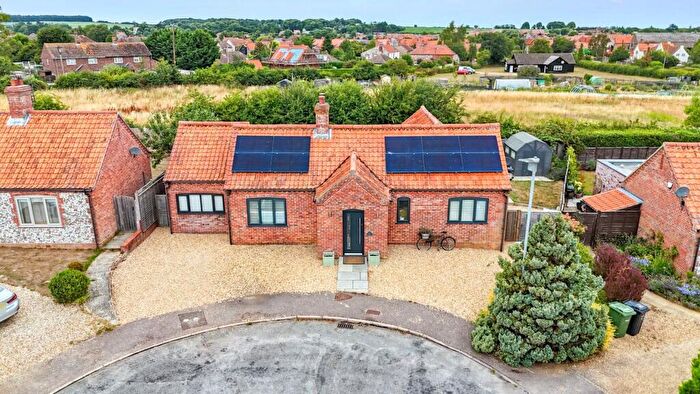
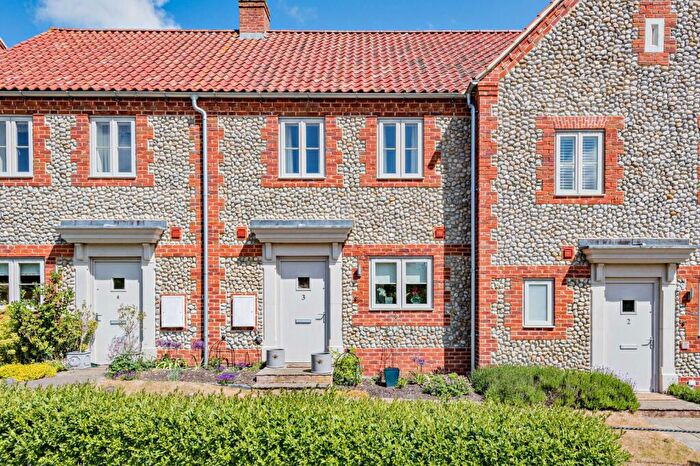
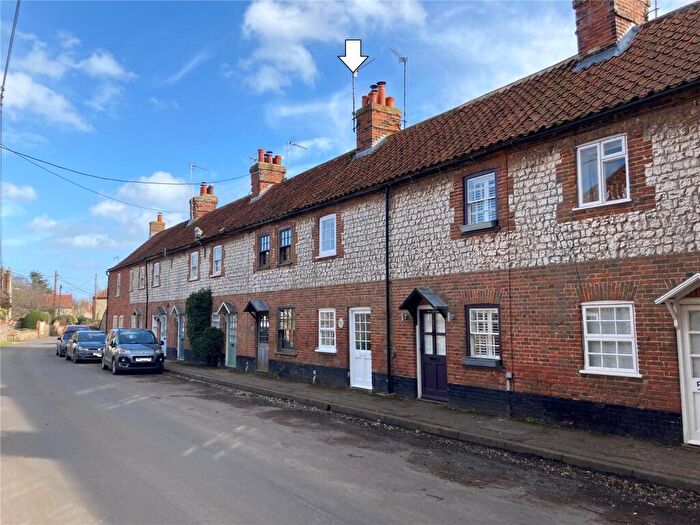
Houses for sale & to rent in Burnham, Kings Lynn
House Prices in Burnham
Properties in Burnham have an average house price of £804,651.00 and had 67 Property Transactions within the last 3 years¹.
Burnham is an area in Kings Lynn, Norfolk with 614 households², where the most expensive property was sold for £3,600,000.00.
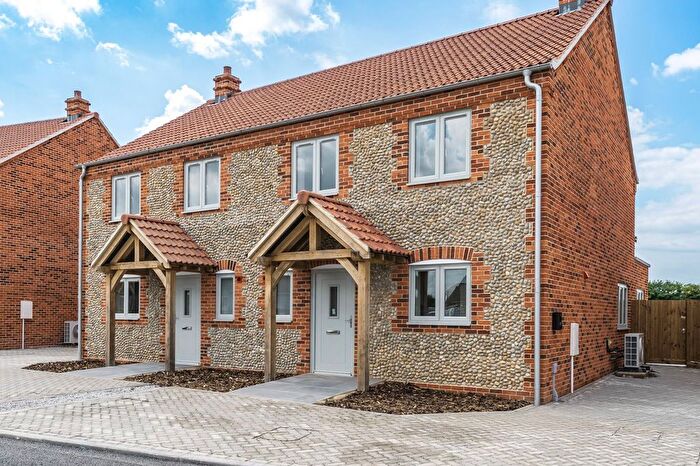
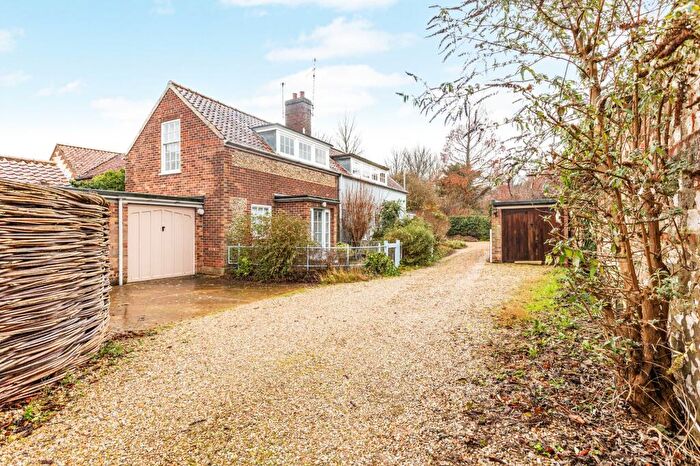
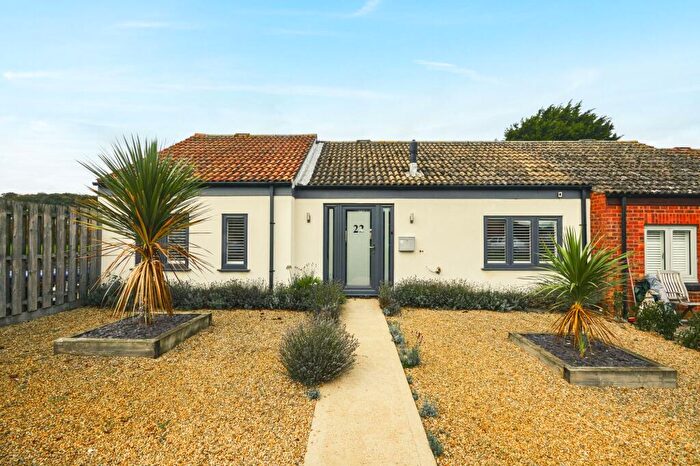
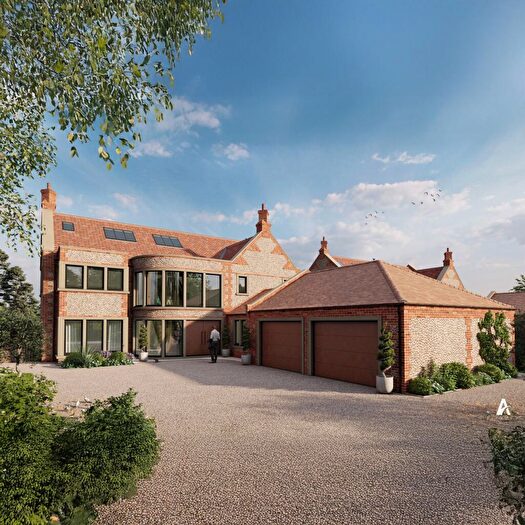
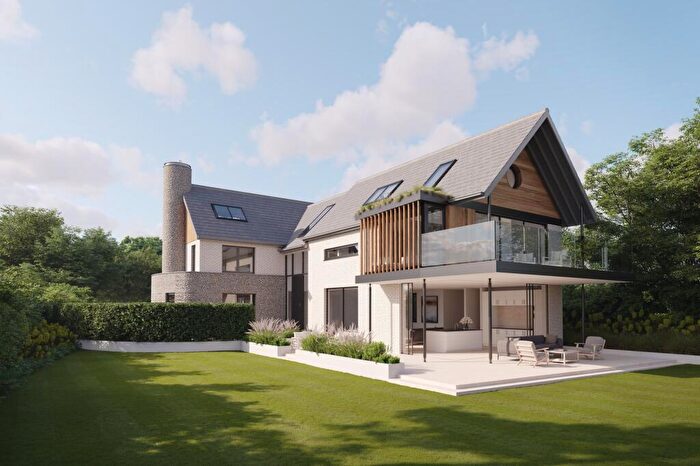
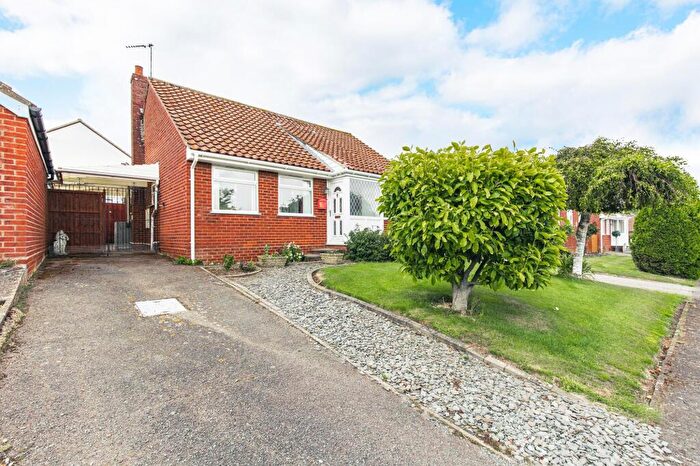
Properties for sale in Burnham
Roads and Postcodes in Burnham
Navigate through our locations to find the location of your next house in Burnham, Kings Lynn for sale or to rent.
| Streets | Postcodes |
|---|---|
| Back Lane | PE31 8EY |
| Beacon Hill | PE31 8JP |
| Beacon Hill Road | PE31 8ER |
| Bellamys Lane | PE31 8ES |
| Cambers Lane | PE31 8UN |
| Chapel Lane | PE31 8JN |
| Church Walk | PE31 8DH |
| Council Houses | PE31 8DT |
| Creake Road | PE31 8EN PE31 8EW PE31 8HW |
| Crofts Close | PE31 8JZ |
| Docking Road | PE31 8DN PE31 8JU PE31 8JX |
| East Harbour Way | PE31 8JF |
| Friars Lane | PE31 8JA |
| Front Street | PE31 8EJ PE31 8EL |
| Garners Row | PE31 8HR |
| Glebe Lane | PE31 8JQ |
| Gong Lane | PE31 8JG |
| Goodricks | PE31 8HP |
| Gravel Hill | PE31 8HX |
| Herrings Lane | PE31 8DW |
| Joan Shorts Lane | PE31 8HJ |
| Kestrel Close | PE31 8EF |
| Main Road | PE31 8DU |
| Market Place | PE31 8HD PE31 8HE PE31 8HF |
| Marsh Lane | PE31 8DS |
| Mill Green | PE31 8DY |
| Mill Road | PE31 8DX |
| Nelsons Close | PE31 8HS |
| New Road | PE31 8JD |
| North Street | PE31 8HG |
| Norton Street | PE31 8DR |
| Old Railway Yard | PE31 8UP |
| Overy Road | PE31 8HH |
| Polstede Place | PE31 8UR |
| Ringstead Road | PE31 8DL PE31 8JR |
| Rogers Row | PE31 8HB |
| St Ethelberts Close | PE31 8UT |
| St Ethelberts Terrace | PE31 8UU |
| Stanhoe Road | PE31 8JS PE31 8JT |
| Station Road | PE31 8HA |
| Stonegate Yard Beacon Hill Road | PE31 8ET |
| Sussex Farm | PE31 8JY |
| Sutton Estate | PE31 8EX |
| The Pightle | PE31 8HT |
| The Pound | PE31 8UL |
| Tower Road | PE31 8JB |
| Ulph Place | PE31 8HQ |
| Walkers Close | PE31 8EP |
| Walsingham Road | PE31 8HL PE31 8HN |
| Wells Road | PE31 8FA PE31 8HU PE31 8JE PE31 8JH PE31 8JJ PE31 8JW |
| Whiteway Road | PE31 8DJ |
Transport near Burnham
-
King's Lynn Station
-
Sheringham Station
-
Skegness Station
-
West Runton Station
-
Havenhouse Station
-
Wainfleet Station
-
Cromer Station
-
Roughton Road Station
-
Watlington Station
-
Thorpe Culvert Station
- FAQ
- Price Paid By Year
- Property Type Price
Frequently asked questions about Burnham
What is the average price for a property for sale in Burnham?
The average price for a property for sale in Burnham is £804,651. This amount is 169% higher than the average price in Kings Lynn. There are 164 property listings for sale in Burnham.
What streets have the most expensive properties for sale in Burnham?
The streets with the most expensive properties for sale in Burnham are Overy Road at an average of £2,200,000, Herrings Lane at an average of £1,958,678 and Ulph Place at an average of £1,200,000.
What streets have the most affordable properties for sale in Burnham?
The streets with the most affordable properties for sale in Burnham are Ringstead Road at an average of £180,000, Goodricks at an average of £206,000 and Crofts Close at an average of £217,500.
Which train stations are available in or near Burnham?
Some of the train stations available in or near Burnham are King's Lynn, Sheringham and Skegness.
Property Price Paid in Burnham by Year
The average sold property price by year was:
| Year | Average Sold Price | Price Change |
Sold Properties
|
|---|---|---|---|
| 2025 | £563,750 | -92% |
16 Properties |
| 2024 | £1,084,355 | 37% |
25 Properties |
| 2023 | £683,952 | -32% |
26 Properties |
| 2022 | £900,624 | 11% |
29 Properties |
| 2021 | £801,493 | 2% |
43 Properties |
| 2020 | £786,230 | 18% |
36 Properties |
| 2019 | £642,188 | 8% |
36 Properties |
| 2018 | £590,794 | 7% |
34 Properties |
| 2017 | £551,055 | 1% |
36 Properties |
| 2016 | £543,127 | -3% |
61 Properties |
| 2015 | £558,342 | 8% |
40 Properties |
| 2014 | £515,354 | -26% |
46 Properties |
| 2013 | £651,240 | 44% |
36 Properties |
| 2012 | £367,050 | -35% |
19 Properties |
| 2011 | £494,484 | 9% |
33 Properties |
| 2010 | £450,544 | 8% |
26 Properties |
| 2009 | £416,483 | 14% |
37 Properties |
| 2008 | £358,588 | -22% |
26 Properties |
| 2007 | £437,142 | 21% |
59 Properties |
| 2006 | £346,682 | 9% |
46 Properties |
| 2005 | £314,214 | -10% |
42 Properties |
| 2004 | £344,939 | 5% |
42 Properties |
| 2003 | £326,618 | 33% |
30 Properties |
| 2002 | £218,009 | 13% |
46 Properties |
| 2001 | £188,795 | 16% |
47 Properties |
| 2000 | £157,892 | -2% |
38 Properties |
| 1999 | £161,528 | 29% |
44 Properties |
| 1998 | £115,411 | 10% |
43 Properties |
| 1997 | £103,862 | 4% |
42 Properties |
| 1996 | £99,521 | 3% |
33 Properties |
| 1995 | £96,470 | - |
27 Properties |
Property Price per Property Type in Burnham
Here you can find historic sold price data in order to help with your property search.
The average Property Paid Price for specific property types in the last three years are:
| Property Type | Average Sold Price | Sold Properties |
|---|---|---|
| Semi Detached House | £694,571.00 | 14 Semi Detached Houses |
| Detached House | £954,663.00 | 36 Detached Houses |
| Terraced House | £594,650.00 | 15 Terraced Houses |
| Flat | £450,000.00 | 2 Flats |

