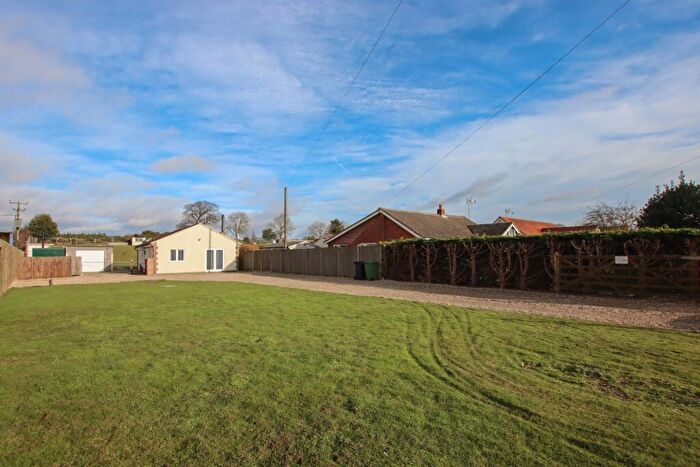
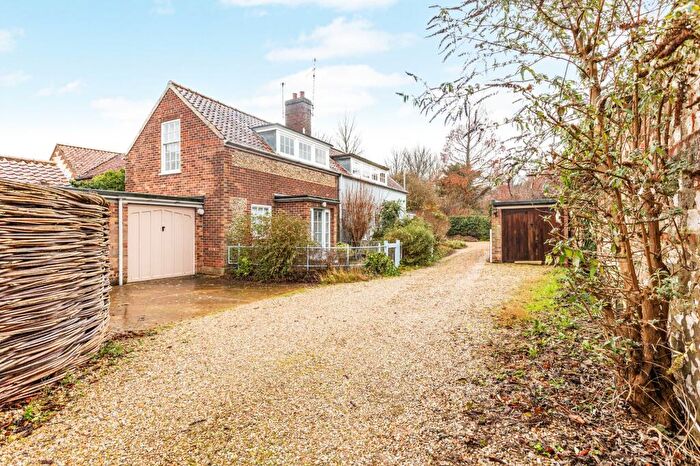
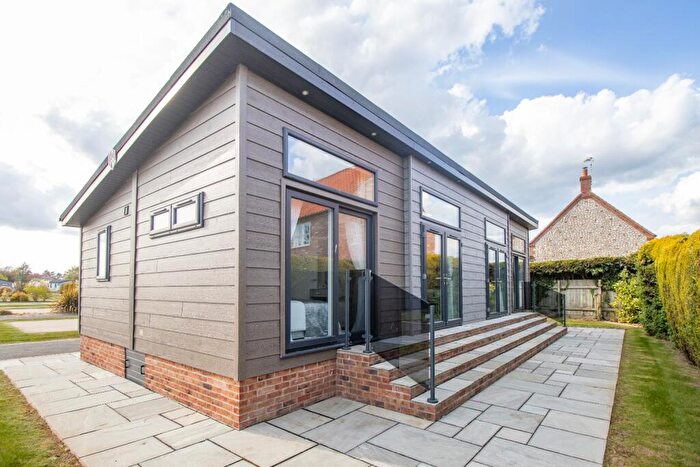
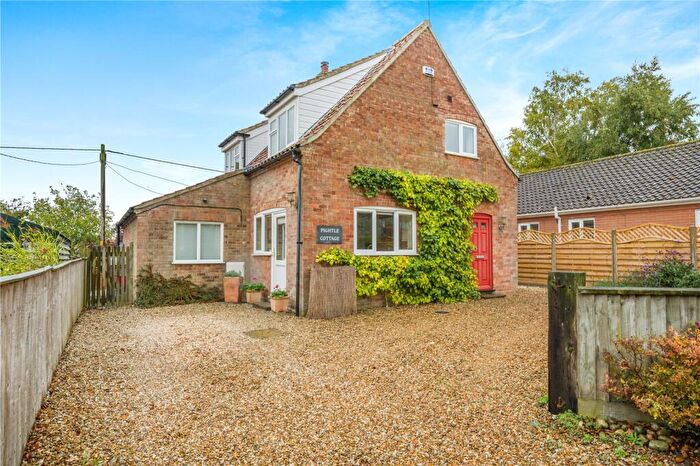
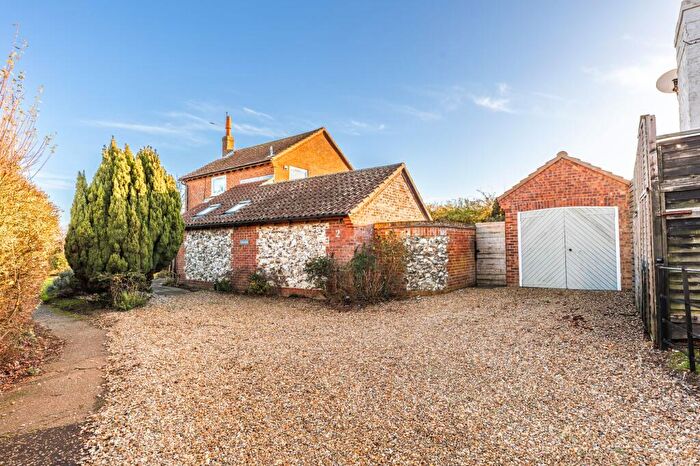
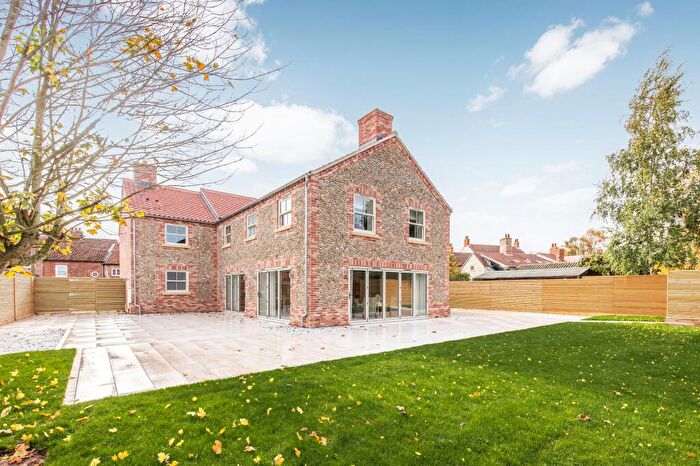
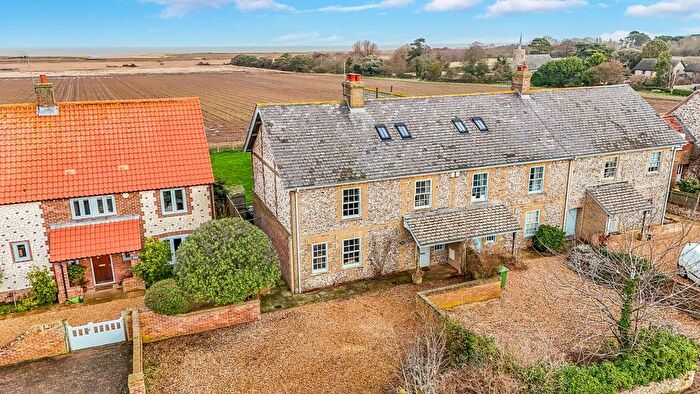
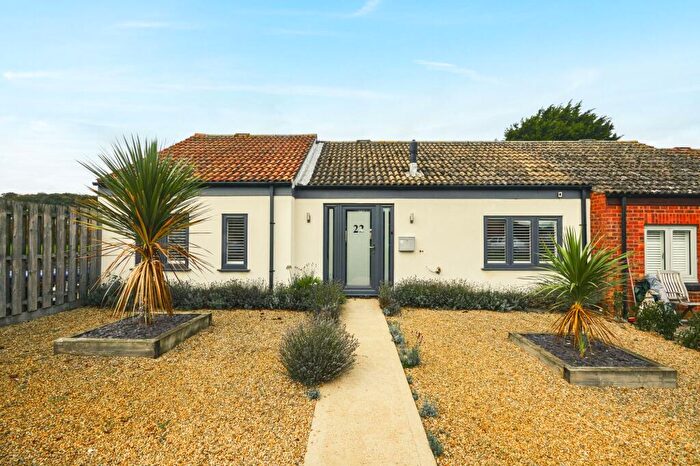
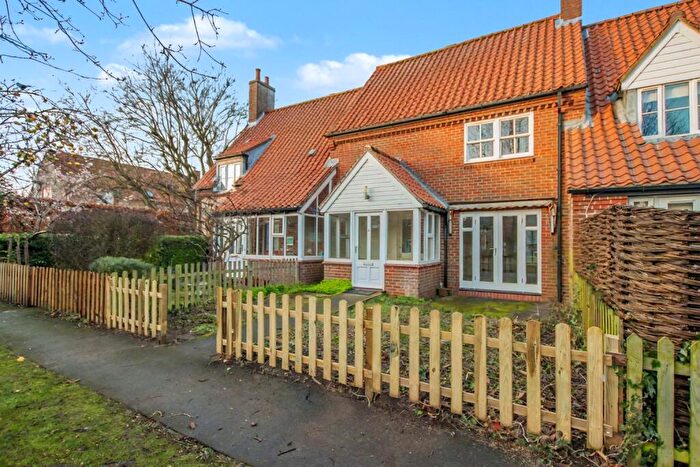
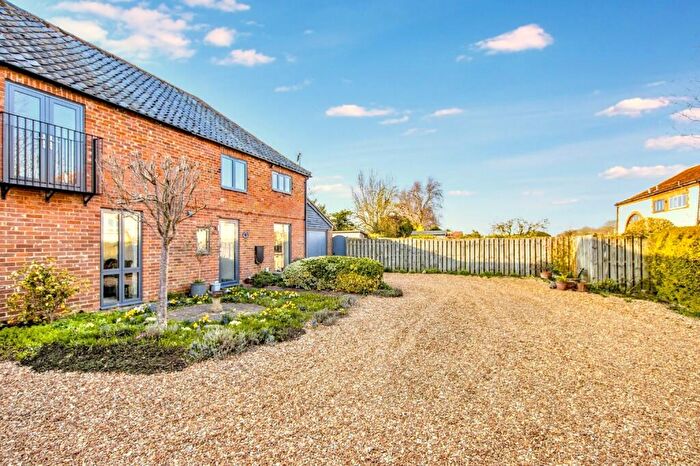
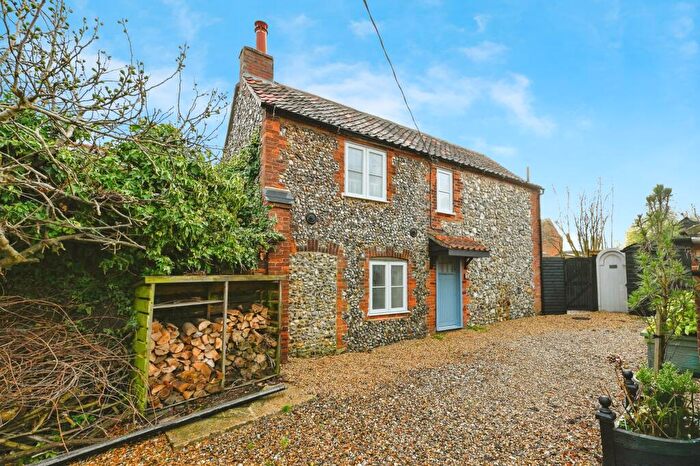
Houses for sale & to rent in Burnham Market & Docking, Kings Lynn
House Prices in Burnham Market & Docking
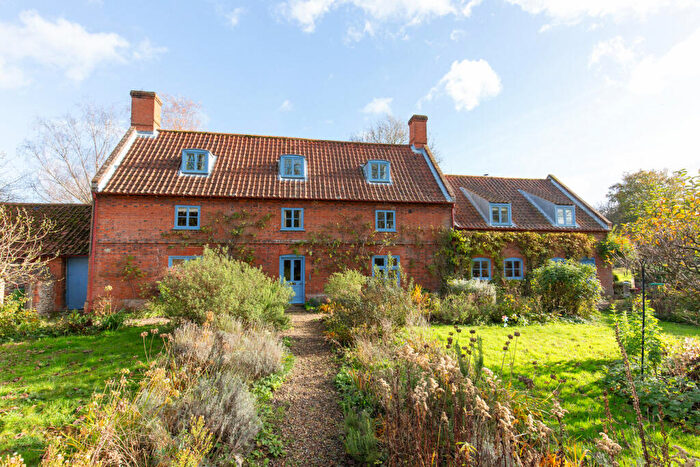
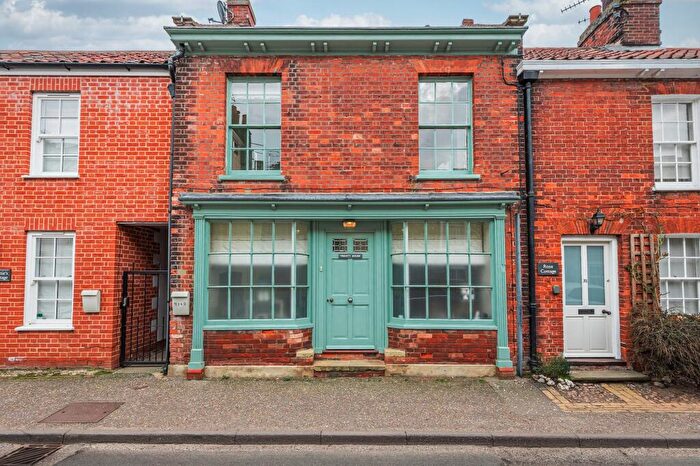
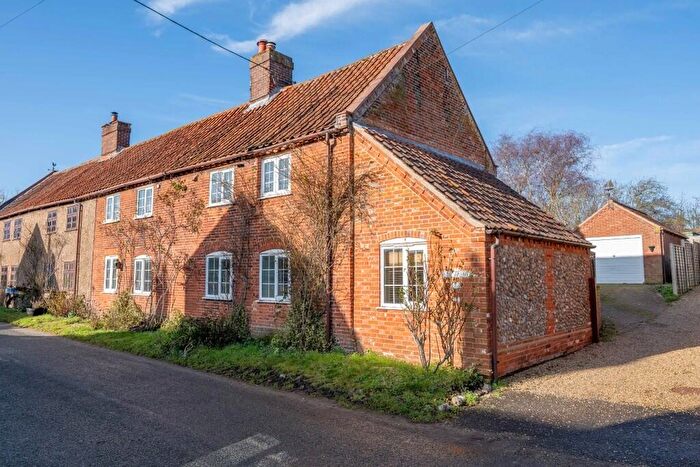
Properties in Burnham Market & Docking have an average house price of £678,550.00 and had 10 Property Transactions within the last 3 years¹.
Burnham Market & Docking is an area in Kings Lynn, Norfolk with 88 households², where the most expensive property was sold for £1,412,500.00.
Properties for sale in Burnham Market & Docking
Roads and Postcodes in Burnham Market & Docking
Navigate through our locations to find the location of your next house in Burnham Market & Docking, Kings Lynn for sale or to rent.
| Streets | Postcodes |
|---|---|
| Back Lane | PE31 8HY |
| Bakers Yard | PE31 8QG |
| Barwick Road | PE31 8NE PE31 8TU |
| Beacon Hill Road | PE31 8EZ |
| Bennett Mews | PE31 8FS |
| Bircham Road | PE31 8PU |
| Blacksmiths Lane | PE31 8EG |
| Burnham Road | PE31 8QP |
| Church Lane | PE31 8FL |
| Creake Road | PE31 8EA |
| Docking Grange | PE31 8QB |
| East Harbour Way | PE31 8FE |
| Fakenham Road | PE31 8FP |
| Field Barn Lane | PE31 8GD |
| Foundry Place | PE31 8LG |
| Gong Lane | PE31 8TG |
| Jewels Close | PE31 8BF |
| Lugden Hill | PE31 8PG |
| Market Place | PE31 8EQ |
| Millwood | PE31 8DP |
| Patternmakers Close | PE31 8LF |
| Ramp Row | PE31 8PR |
| Rectory Lane | PE31 8GE |
| Sandells Walk | PE31 8LB |
| Shammer Close | PE31 8QR |
| St Edmunds Lane | PE31 8LE |
| Stanhoe Road | PE31 6EG |
| Station Road | PE31 8LU PE31 8NZ |
| Sunderland Farm | PE31 8PF |
| Sutton Lea | PE31 8EU |
| Wagg Courtyard | PE31 8FT |
| Wells Road | PE31 8GZ |
| West Harbour Way | PE31 8FF |
| Whiteway Road | PE31 8FQ |
| PE31 6RQ PE31 8EB PE31 8JL PE31 8PD PE31 8PY PE31 8WA |
Transport near Burnham Market & Docking
-
King's Lynn Station
-
Skegness Station
-
Sheringham Station
-
Watlington Station
-
Havenhouse Station
-
Wainfleet Station
-
West Runton Station
-
Thorpe Culvert Station
-
Cromer Station
-
Roughton Road Station
- FAQ
- Price Paid By Year
- Property Type Price
Frequently asked questions about Burnham Market & Docking
What is the average price for a property for sale in Burnham Market & Docking?
The average price for a property for sale in Burnham Market & Docking is £678,550. This amount is 127% higher than the average price in Kings Lynn. There are 598 property listings for sale in Burnham Market & Docking.
What streets have the most expensive properties for sale in Burnham Market & Docking?
The streets with the most expensive properties for sale in Burnham Market & Docking are Patternmakers Close at an average of £1,412,500, St Edmunds Lane at an average of £1,250,000 and Station Road at an average of £733,000.
What streets have the most affordable properties for sale in Burnham Market & Docking?
The streets with the most affordable properties for sale in Burnham Market & Docking are Shammer Close at an average of £102,000, Bennett Mews at an average of £285,000 and Wagg Courtyard at an average of £440,000.
Which train stations are available in or near Burnham Market & Docking?
Some of the train stations available in or near Burnham Market & Docking are King's Lynn, Skegness and Sheringham.
Property Price Paid in Burnham Market & Docking by Year
The average sold property price by year was:
| Year | Average Sold Price | Price Change |
Sold Properties
|
|---|---|---|---|
| 2025 | £102,000 | -641% |
1 Property |
| 2024 | £756,214 | 8% |
7 Properties |
| 2023 | £695,000 | -83% |
2 Properties |
| 2022 | £1,271,377 | 27% |
5 Properties |
| 2021 | £923,333 | 12% |
3 Properties |
| 2020 | £808,333 | 34% |
3 Properties |
| 2019 | £533,801 | -98% |
4 Properties |
| 2018 | £1,059,000 | 31% |
5 Properties |
| 2017 | £733,967 | -1% |
17 Properties |
| 2016 | £739,250 | 73% |
24 Properties |
| 2015 | £196,000 | 63% |
1 Property |
| 2014 | £73,250 | -2220,8% |
1 Property |
| 2011 | £1,700,000 | 78% |
1 Property |
| 2010 | £375,000 | 8% |
1 Property |
| 2009 | £343,150 | -16% |
5 Properties |
| 2008 | £399,000 | - |
1 Property |
Property Price per Property Type in Burnham Market & Docking
Here you can find historic sold price data in order to help with your property search.
The average Property Paid Price for specific property types in the last three years are:
| Property Type | Average Sold Price | Sold Properties |
|---|---|---|
| Semi Detached House | £678,000.00 | 4 Semi Detached Houses |
| Detached House | £1,412,500.00 | 1 Detached House |
| Terraced House | £532,200.00 | 5 Terraced Houses |

