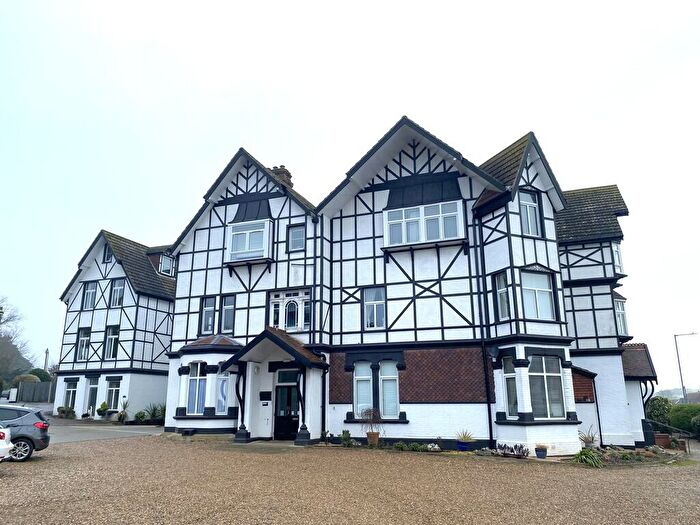
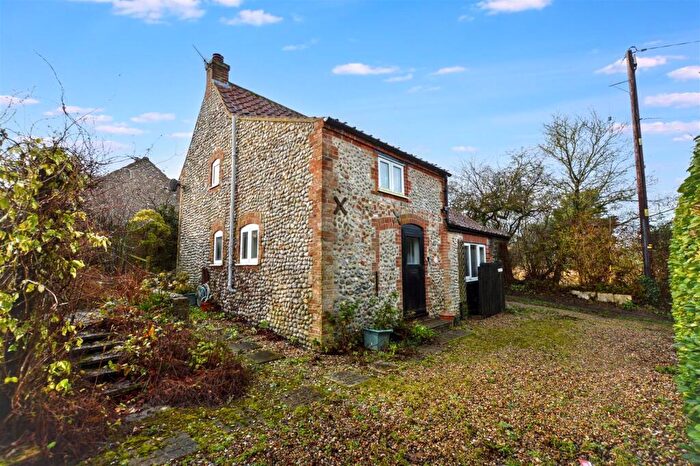
Houses for sale & to rent in Gresham, Holt
House Prices in Gresham
Properties in Gresham have an average house price of £461,000.00 and had 2 Property Transactions within the last 3 years¹.
Gresham is an area in Holt, Norfolk with 103 households², where the most expensive property was sold for £500,000.00.
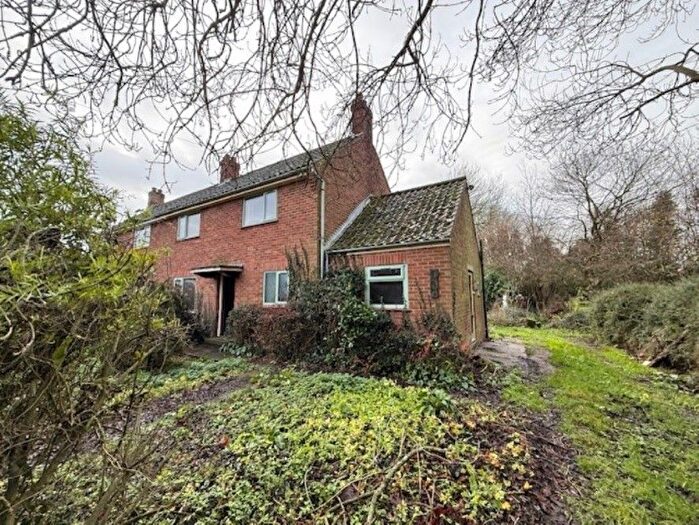
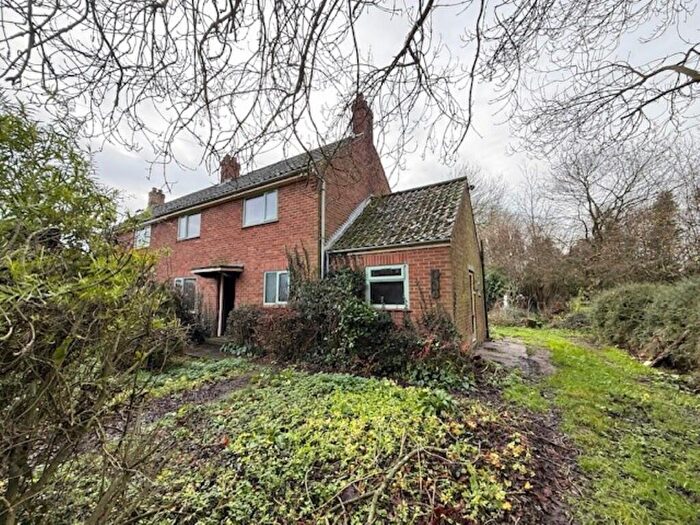
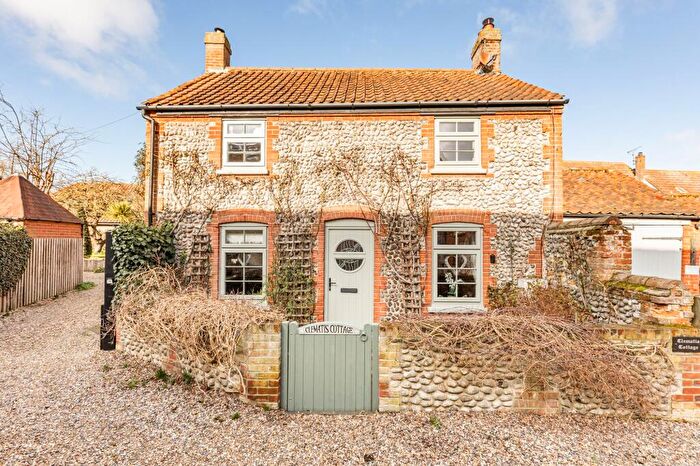
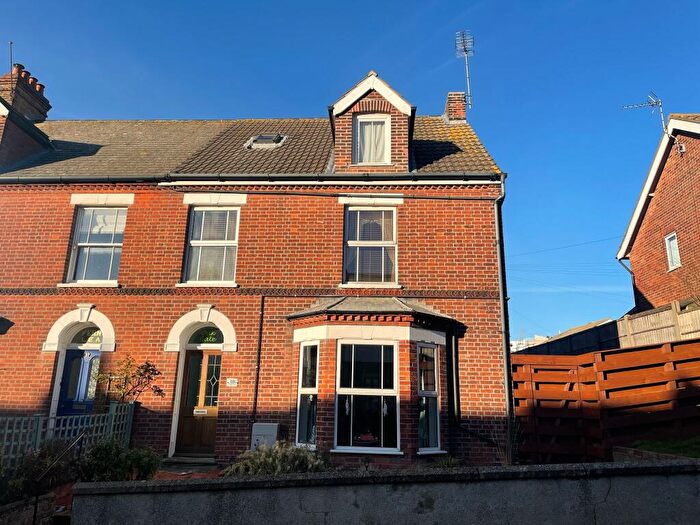
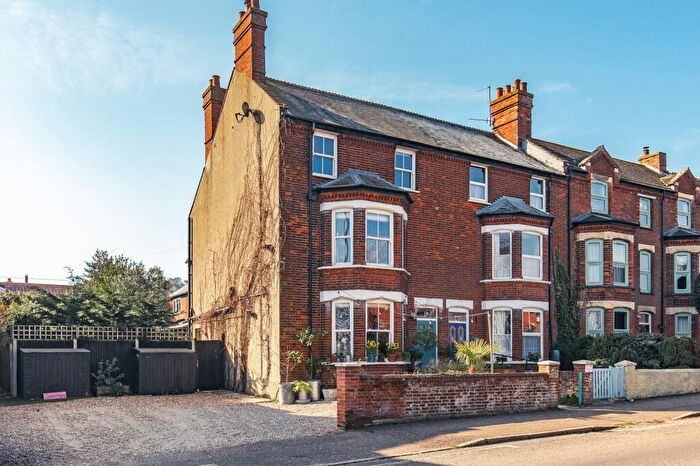
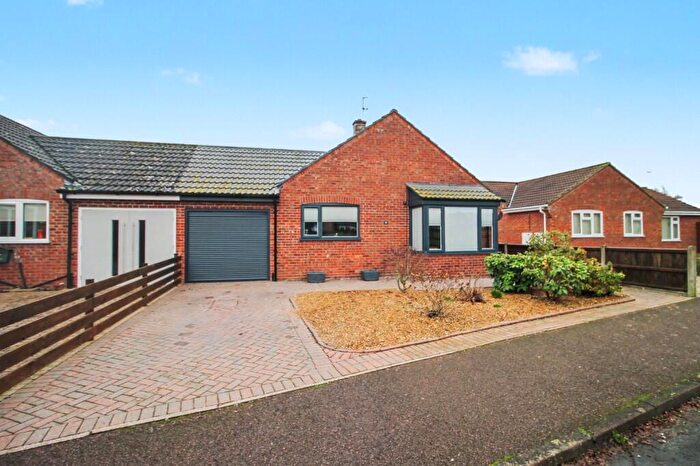
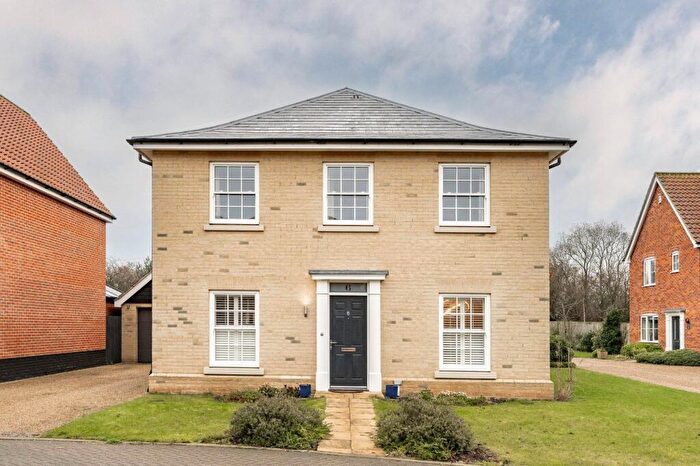
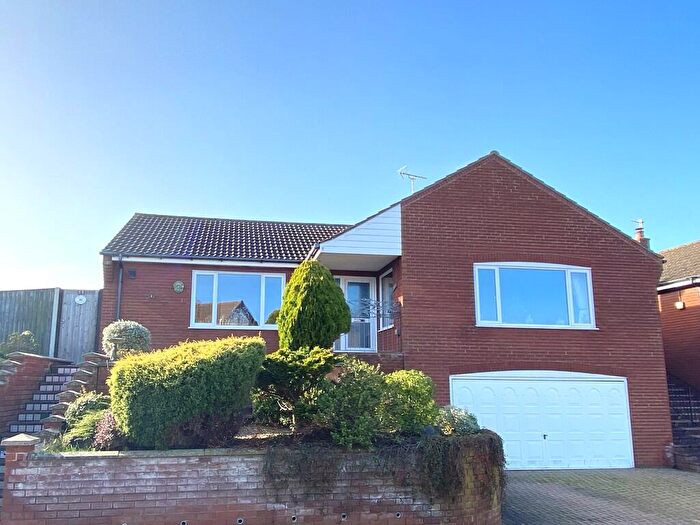
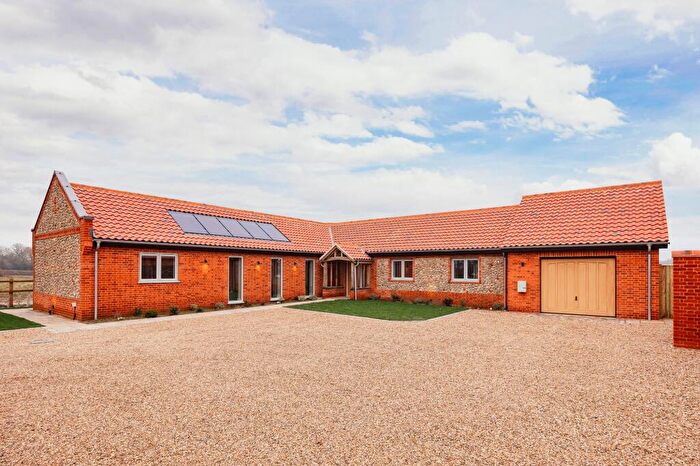
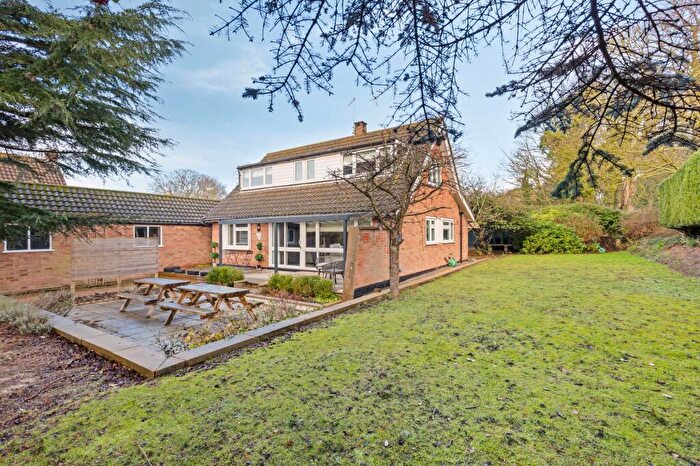
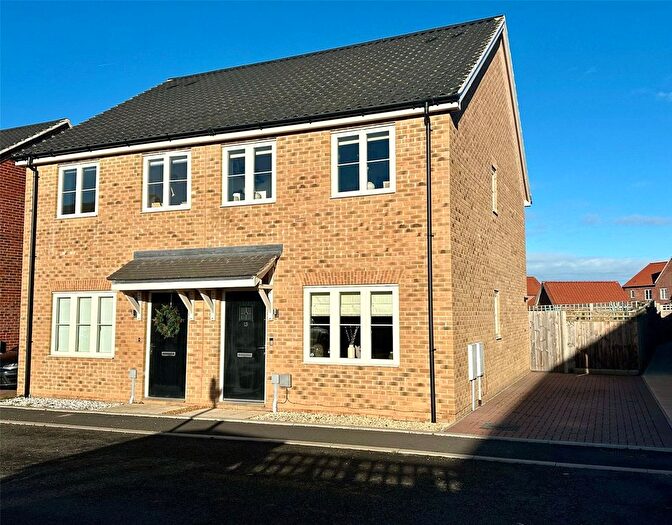
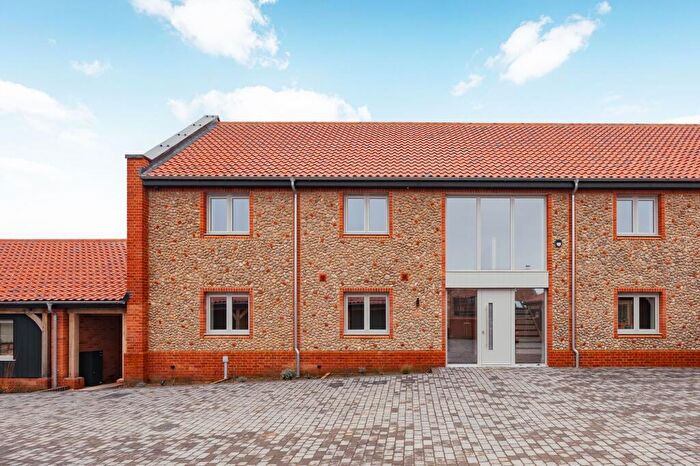
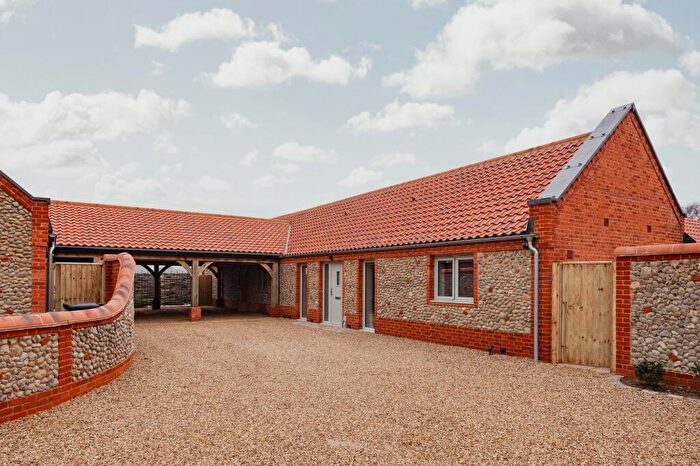
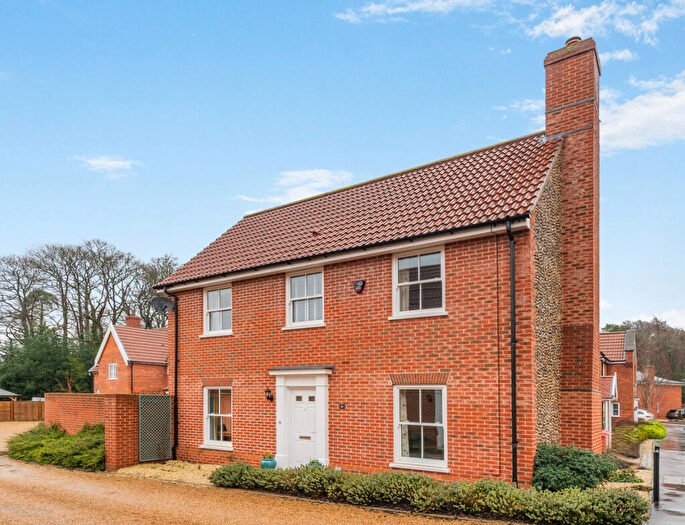
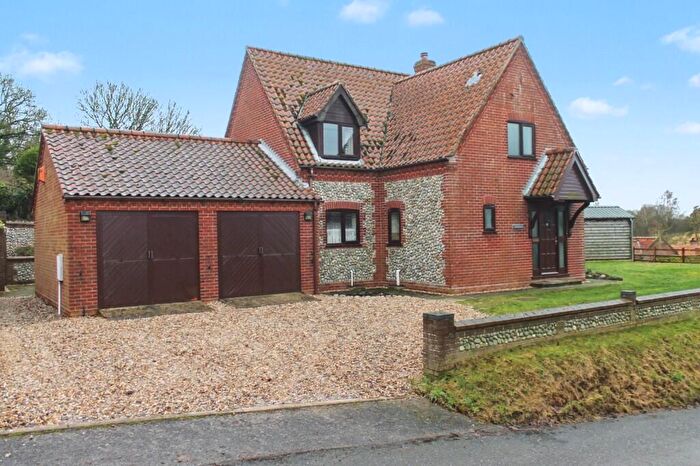
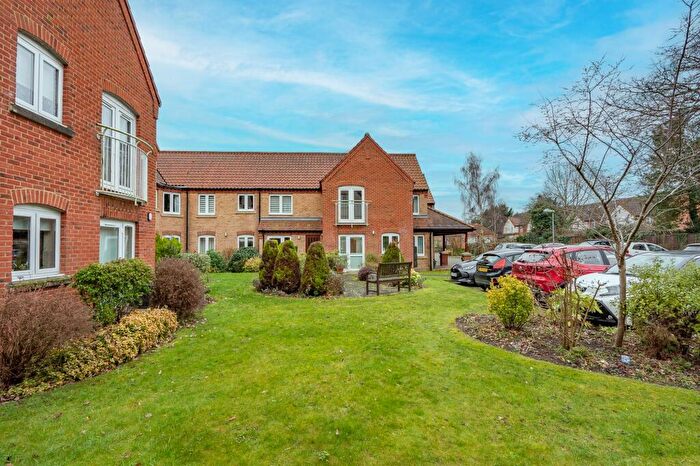
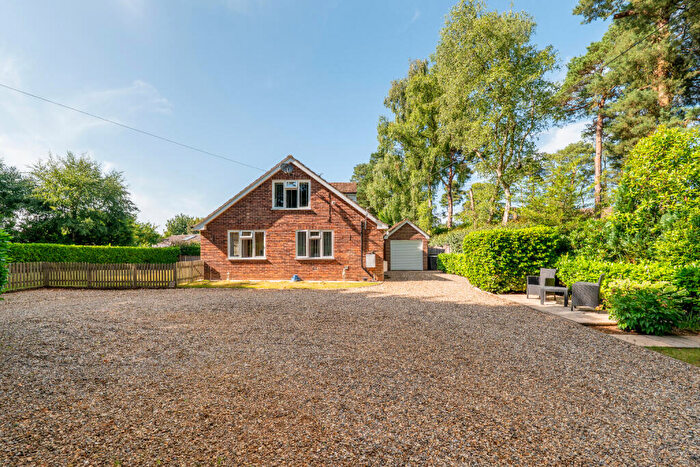
Properties for sale in Gresham
Roads and Postcodes in Gresham
Navigate through our locations to find the location of your next house in Gresham, Holt for sale or to rent.
| Streets | Postcodes |
|---|---|
| Baconsthorpe Road | NR11 7LH NR25 6LB |
| Barningham Park | NR11 7HY NR11 7RA |
| Barningham Road | NR11 7JA |
| Brick Kiln Lane | NR11 7HX |
| Church Lane | NR25 6LU |
| Church Road | NR25 6NY |
| Cromer Road | NR25 6PN |
| Gibbet Lane | NR11 8SF |
| Gresham Road | NR25 6ND |
| Hall Meadow | NR25 6TN |
| Hole Farm Road | NR25 6TT |
| Holt Road | NR25 6JY NR26 8TU |
| John William Way | NR25 6FG |
| Kelling Road | NR25 6NE NR25 6NF NR25 6RW |
| Little Barningham Lane | NR24 2AR |
| Little Barningham Road | NR11 7LL |
| Manor House Road | NR25 6PU |
| Marlpit Lane | NR25 6TS |
| Matlaske Road | NR11 7DQ |
| Morgans Way | NR25 6NL |
| New Road | NR25 6PP |
| Northfield Lane | NR11 7PT |
| Otters Lane | NR11 8GA |
| Plumstead Road | NR24 2AN |
| Rectory Road | NR25 6NA NR25 6PR |
| Red Barn Lane | NR11 8RW |
| Sayer Court | NR25 6NJ |
| School Lane | NR25 6LS |
| Sheringham Road | NR25 6PG NR25 6PQ |
| The Lane | NR11 7LR |
| The Street | NR11 7JB NR25 6NN |
| Wells Cottages | NR11 7JX |
| NR11 7JY NR11 7LB NR11 7LS NR11 7NH NR11 8PS NR25 6LR NR25 6LT |
Transport near Gresham
- FAQ
- Price Paid By Year
- Property Type Price
Frequently asked questions about Gresham
What is the average price for a property for sale in Gresham?
The average price for a property for sale in Gresham is £461,000. This amount is 9% lower than the average price in Holt. There are 980 property listings for sale in Gresham.
Which train stations are available in or near Gresham?
Some of the train stations available in or near Gresham are Sheringham, West Runton and Roughton Road.
Property Price Paid in Gresham by Year
The average sold property price by year was:
| Year | Average Sold Price | Price Change |
Sold Properties
|
|---|---|---|---|
| 2024 | £422,000 | -18% |
1 Property |
| 2023 | £500,000 | 9% |
1 Property |
| 2021 | £457,500 | 26% |
2 Properties |
| 2020 | £340,000 | -32% |
2 Properties |
| 2017 | £450,000 | 24% |
1 Property |
| 2015 | £340,000 | 85% |
1 Property |
| 1995 | £49,500 | - |
1 Property |
Property Price per Property Type in Gresham
Here you can find historic sold price data in order to help with your property search.
The average Property Paid Price for specific property types in the last three years are:
| Property Type | Average Sold Price | Sold Properties |
|---|---|---|
| Detached House | £461,000.00 | 2 Detached Houses |

