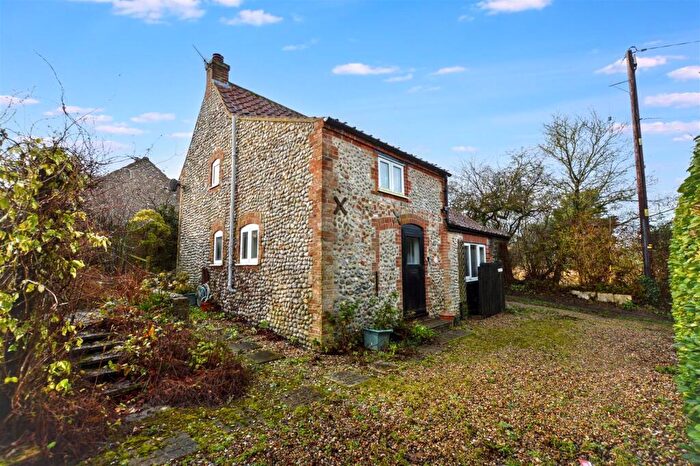
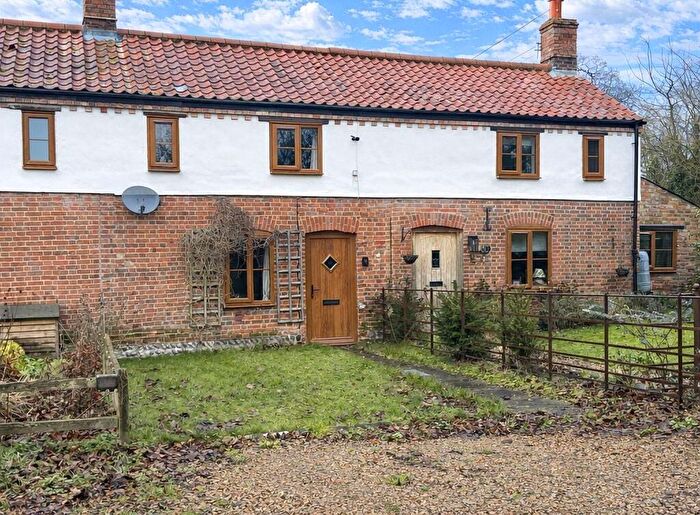
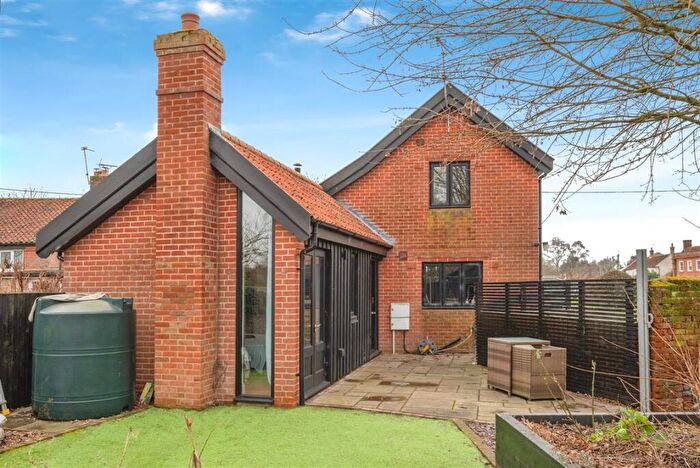
Houses for sale & to rent in Chaucer, Norwich
House Prices in Chaucer
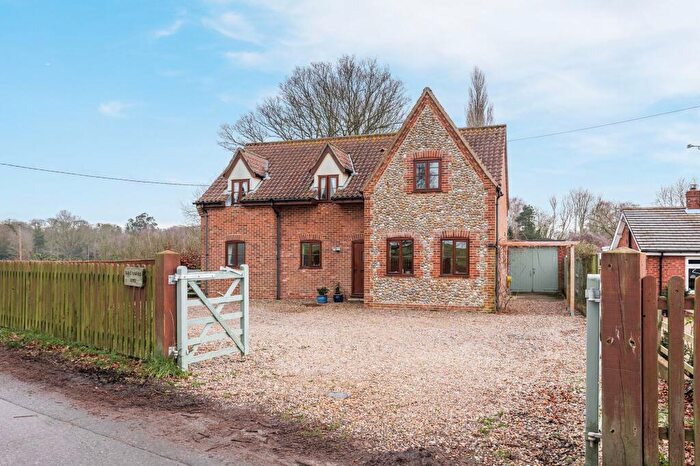
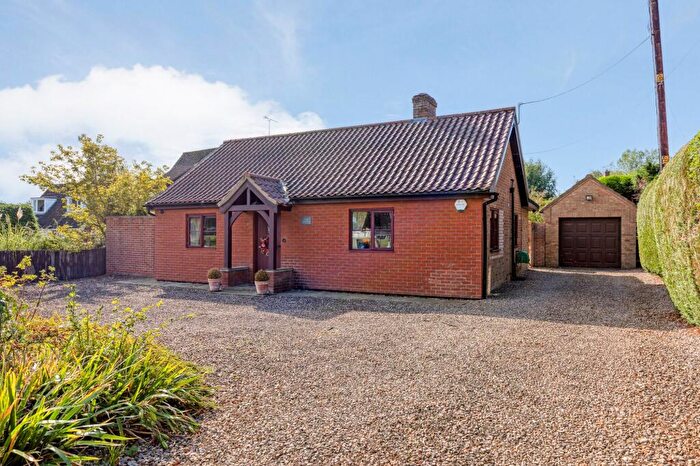
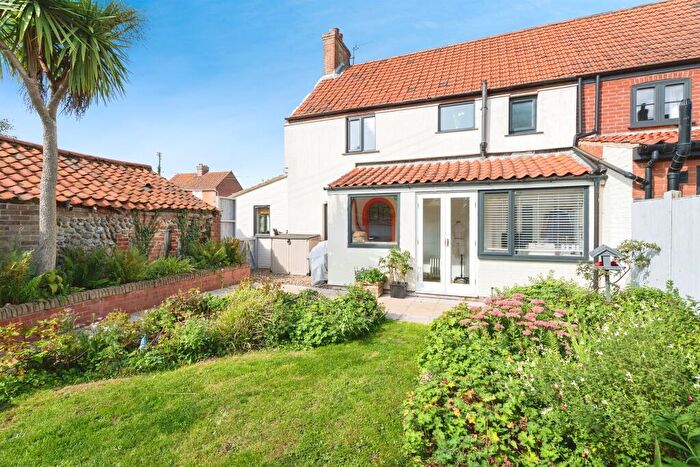
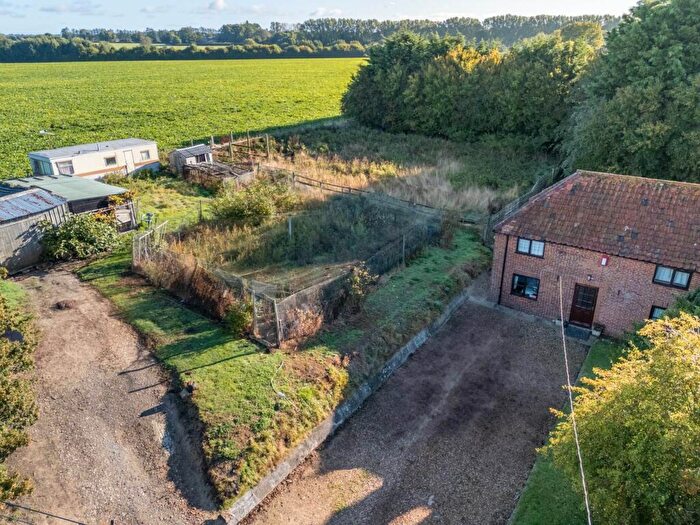
Properties in Chaucer have an average house price of £380,788.00 and had 27 Property Transactions within the last 3 years¹.
Chaucer is an area in Norwich, Norfolk with 326 households², where the most expensive property was sold for £800,000.00.
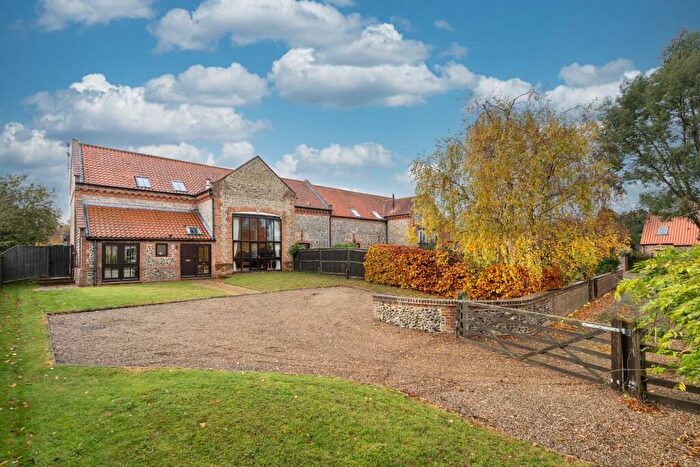
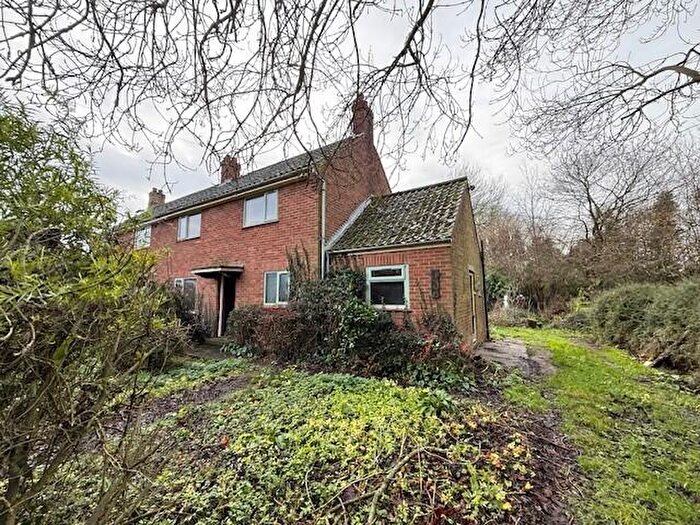
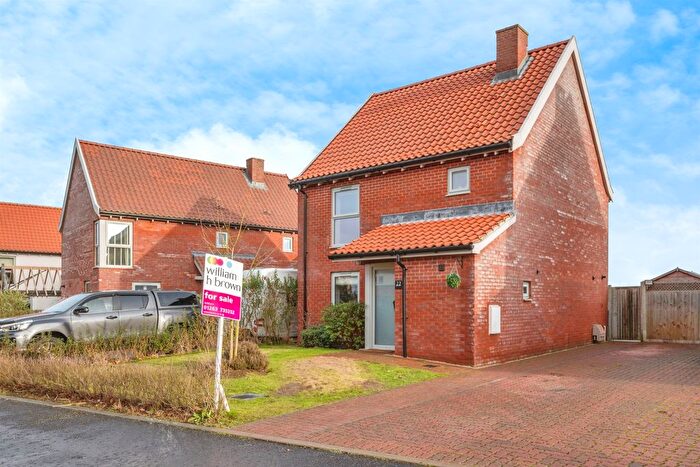
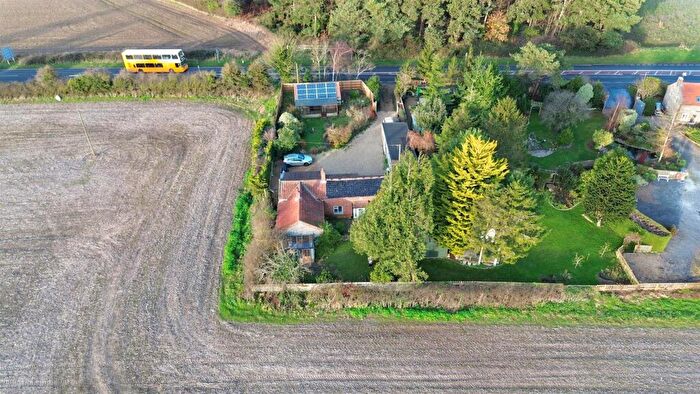
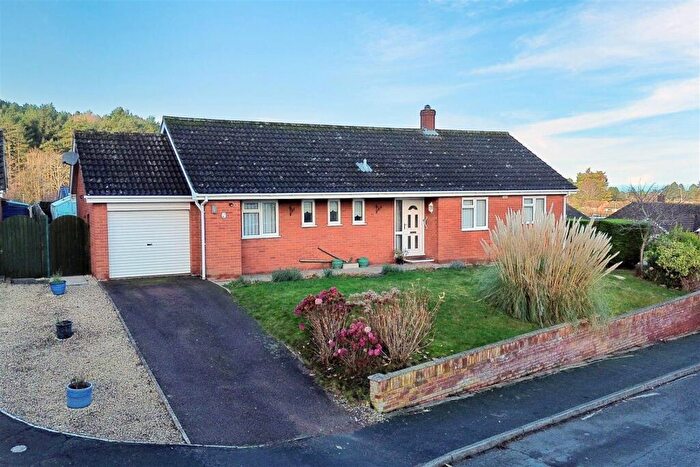
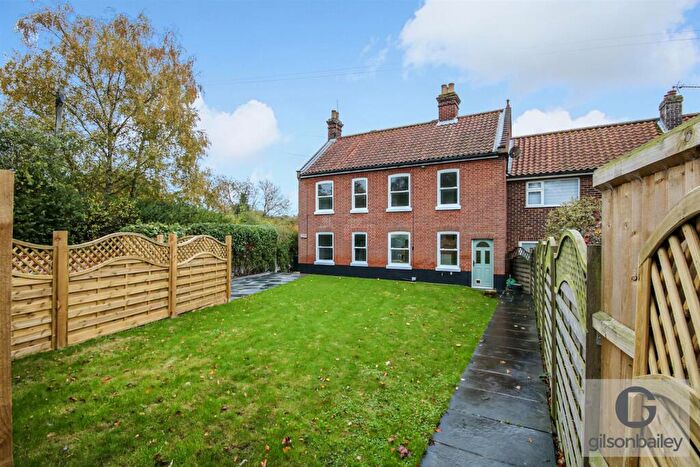
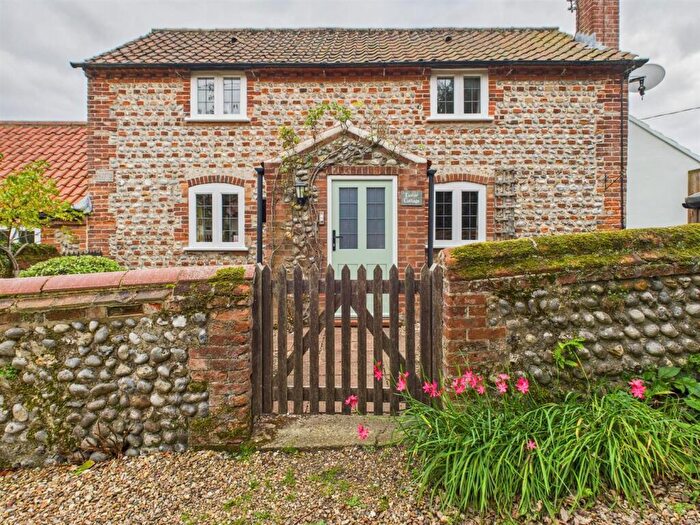
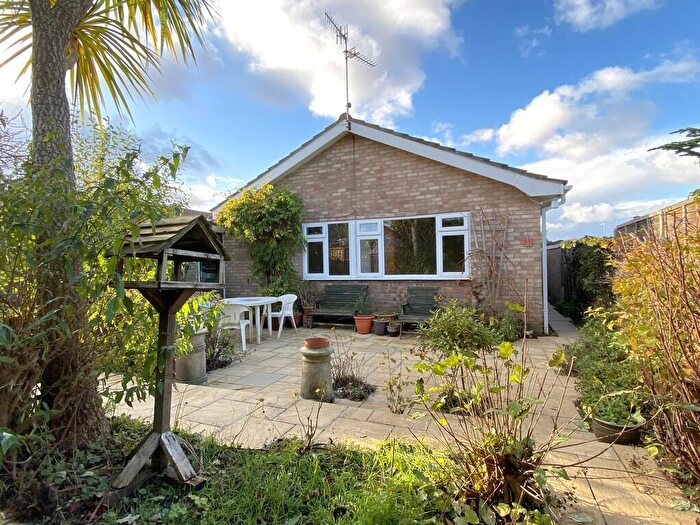
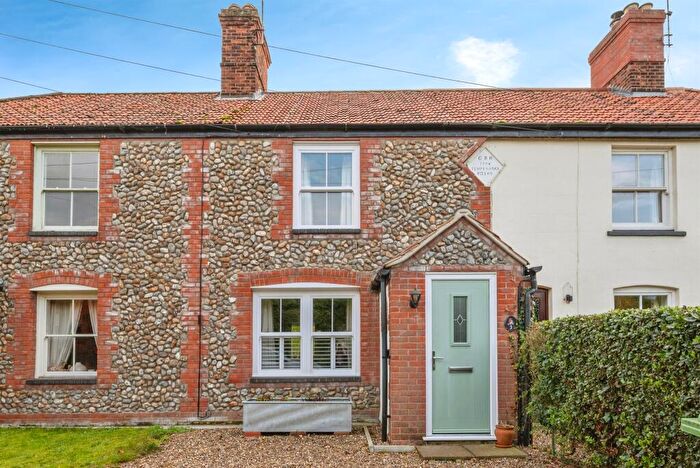
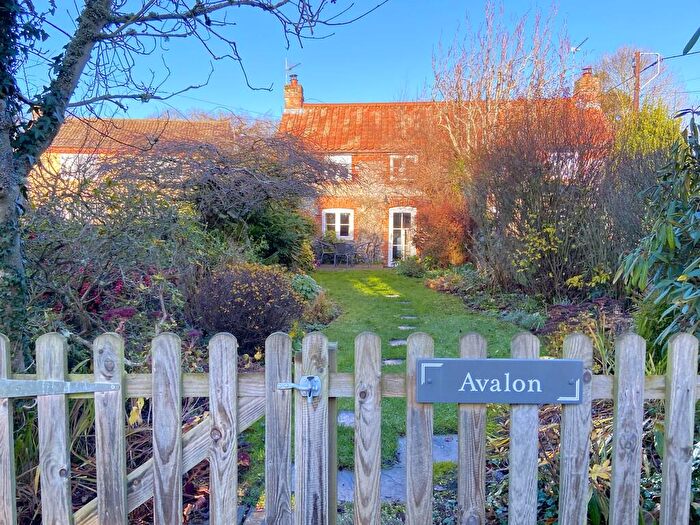
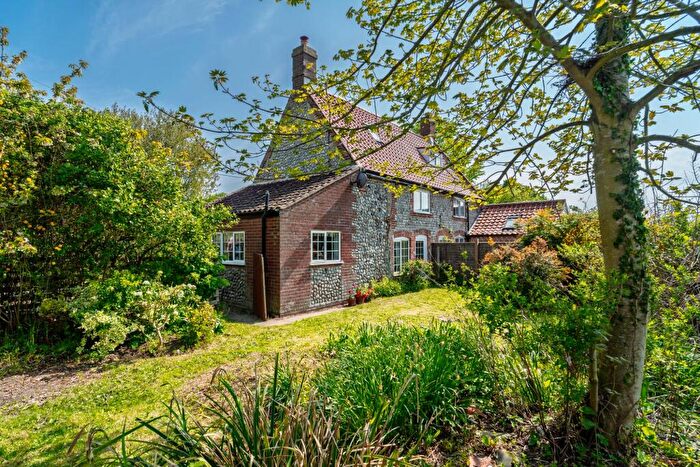
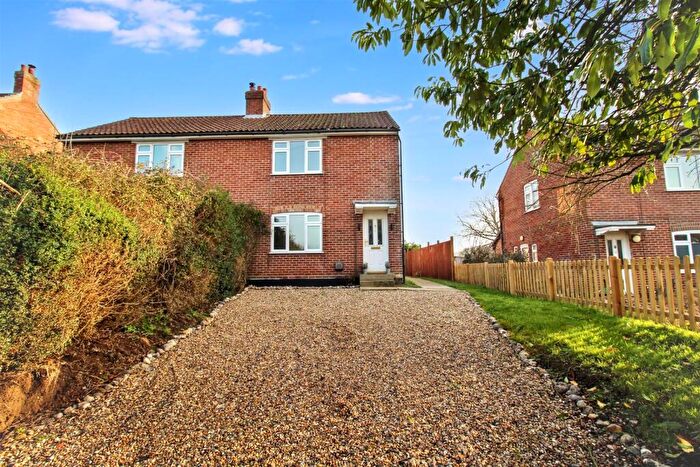
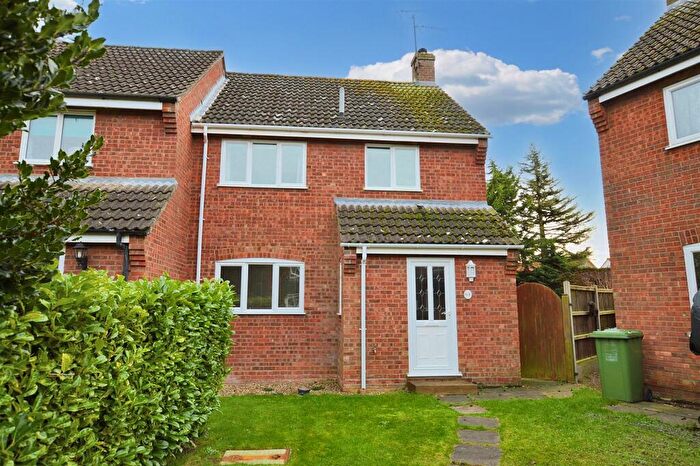
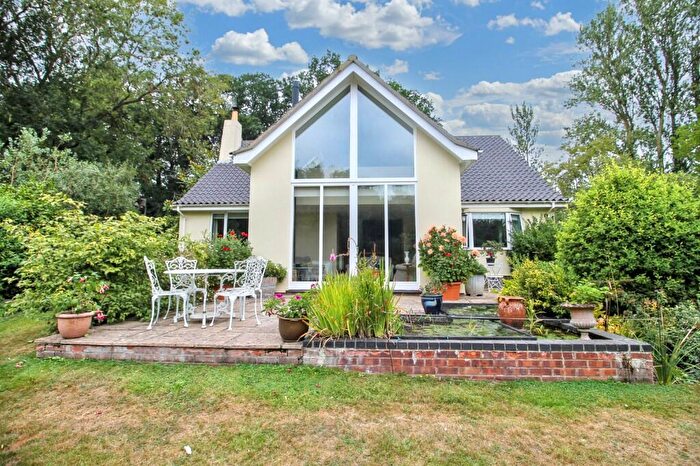
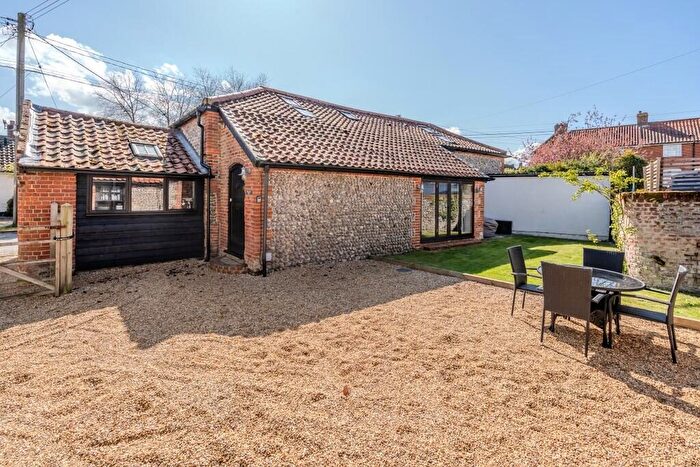
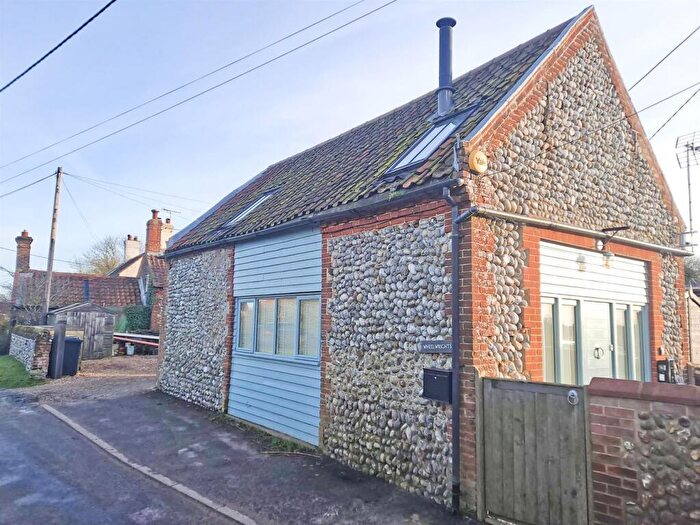
Properties for sale in Chaucer
Roads and Postcodes in Chaucer
Navigate through our locations to find the location of your next house in Chaucer, Norwich for sale or to rent.
| Streets | Postcodes |
|---|---|
| Barningham Place | NR11 7JQ |
| Barningham Road | NR11 8RL |
| Beech Close | NR11 8AG |
| Bessingham Road | NR11 7JU |
| Castle Close | NR11 8RH |
| Chequers Road | NR11 8RQ |
| Church Cottages | NR11 7JS |
| Church Lane | NR11 8RT |
| Church Road | NR11 7JP |
| Cromer Road | NR11 8RB NR11 8RF |
| Holt Road | NR11 8AD NR11 8RG |
| North Barningham Road | NR11 7JT |
| Paston Close | NR11 8SD |
| Sustead Lane | NR11 8RR |
| Sustead Road | NR11 8RE |
| The Green | NR11 7JG |
| The Loke | NR11 8RJ NR11 8RP |
| The Meadows | NR11 8RZ |
| The Street | NR11 7AQ NR11 7JR |
| Watermill Close | NR11 8RD |
| Watery Lane | NR11 7JD |
| Wickmere Road | NR11 7JH |
| NR11 7JN NR11 7JW NR11 7JZ NR11 7LA NR11 7LD NR11 7LE NR11 8QU NR11 8QX NR11 8RN NR11 8RU NR11 8RY |
Transport near Chaucer
- FAQ
- Price Paid By Year
- Property Type Price
Frequently asked questions about Chaucer
What is the average price for a property for sale in Chaucer?
The average price for a property for sale in Chaucer is £380,788. This amount is 24% higher than the average price in Norwich. There are 137 property listings for sale in Chaucer.
What streets have the most expensive properties for sale in Chaucer?
The streets with the most expensive properties for sale in Chaucer are The Street at an average of £685,000, North Barningham Road at an average of £600,000 and Cromer Road at an average of £533,333.
What streets have the most affordable properties for sale in Chaucer?
The streets with the most affordable properties for sale in Chaucer are Watermill Close at an average of £245,000, The Meadows at an average of £249,000 and Castle Close at an average of £270,000.
Which train stations are available in or near Chaucer?
Some of the train stations available in or near Chaucer are West Runton, Sheringham and Roughton Road.
Property Price Paid in Chaucer by Year
The average sold property price by year was:
| Year | Average Sold Price | Price Change |
Sold Properties
|
|---|---|---|---|
| 2025 | £287,562 | -55% |
8 Properties |
| 2024 | £445,080 | 12% |
10 Properties |
| 2023 | £392,222 | -27% |
9 Properties |
| 2022 | £497,050 | 12% |
10 Properties |
| 2021 | £437,472 | 34% |
18 Properties |
| 2020 | £289,630 | -8% |
11 Properties |
| 2019 | £313,812 | -16% |
8 Properties |
| 2018 | £364,242 | -7% |
13 Properties |
| 2017 | £390,247 | 7% |
17 Properties |
| 2016 | £363,988 | 10% |
21 Properties |
| 2015 | £326,185 | 21% |
14 Properties |
| 2014 | £258,558 | 7% |
17 Properties |
| 2013 | £239,654 | 10% |
11 Properties |
| 2012 | £215,875 | -46% |
4 Properties |
| 2011 | £316,033 | 30% |
15 Properties |
| 2010 | £220,707 | -20% |
7 Properties |
| 2009 | £265,618 | -30% |
13 Properties |
| 2008 | £344,750 | 24% |
9 Properties |
| 2007 | £262,615 | 8% |
19 Properties |
| 2006 | £241,805 | 19% |
23 Properties |
| 2005 | £196,772 | -28% |
11 Properties |
| 2004 | £251,302 | 28% |
18 Properties |
| 2003 | £180,772 | 13% |
18 Properties |
| 2002 | £157,009 | -0,3% |
19 Properties |
| 2001 | £157,433 | 20% |
15 Properties |
| 2000 | £125,347 | 6% |
17 Properties |
| 1999 | £117,650 | 20% |
13 Properties |
| 1998 | £94,055 | 27% |
9 Properties |
| 1997 | £68,675 | -15% |
20 Properties |
| 1996 | £78,973 | -2% |
19 Properties |
| 1995 | £80,750 | - |
7 Properties |
Property Price per Property Type in Chaucer
Here you can find historic sold price data in order to help with your property search.
The average Property Paid Price for specific property types in the last three years are:
| Property Type | Average Sold Price | Sold Properties |
|---|---|---|
| Semi Detached House | £333,100.00 | 13 Semi Detached Houses |
| Terraced House | £333,333.00 | 3 Terraced Houses |
| Detached House | £450,090.00 | 11 Detached Houses |

