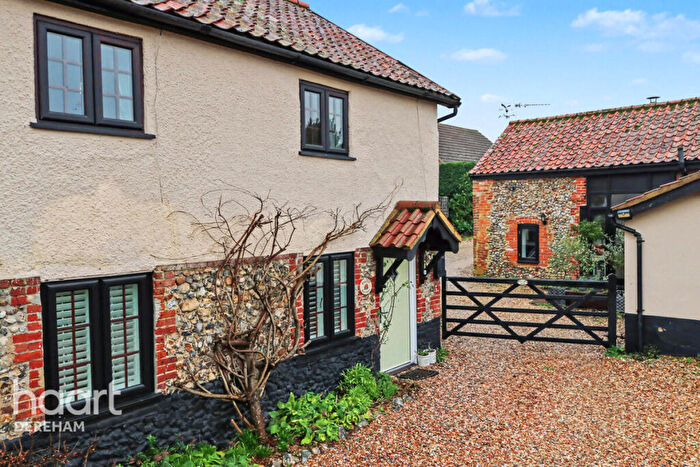
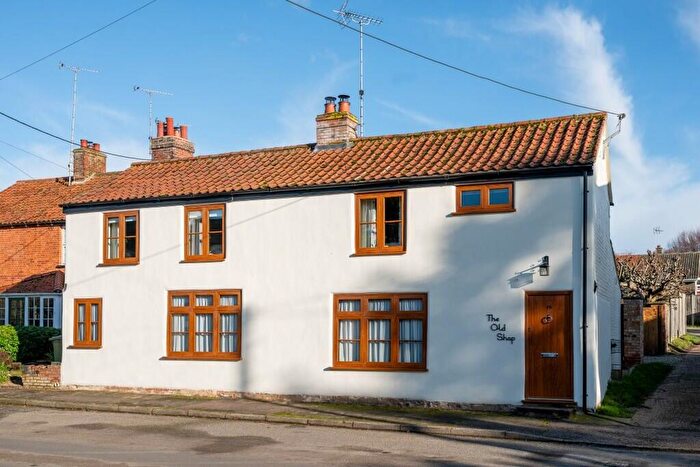
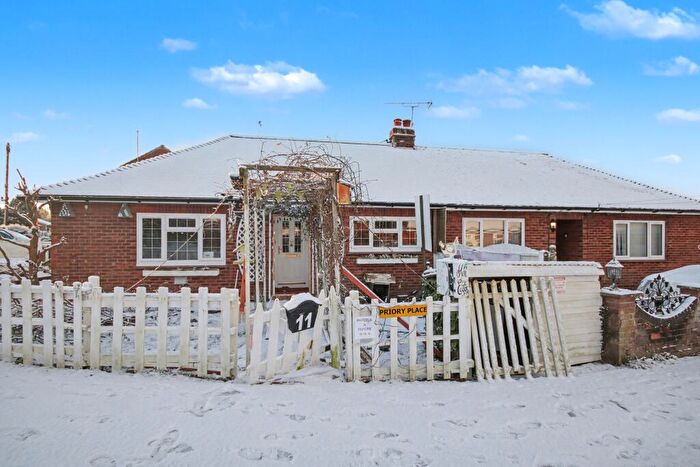
Houses for sale & to rent in Launditch, Kings Lynn
House Prices in Launditch
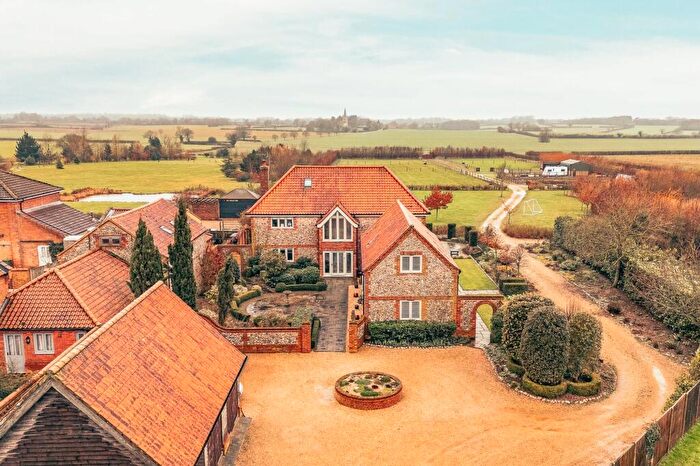
Properties in Launditch have an average house price of £462,481.00 and had 60 Property Transactions within the last 3 years¹.
Launditch is an area in Kings Lynn, Norfolk with 832 households², where the most expensive property was sold for £1,100,000.00.
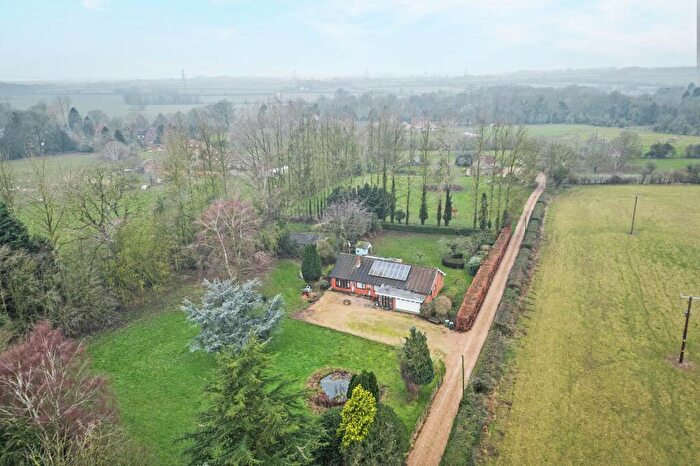
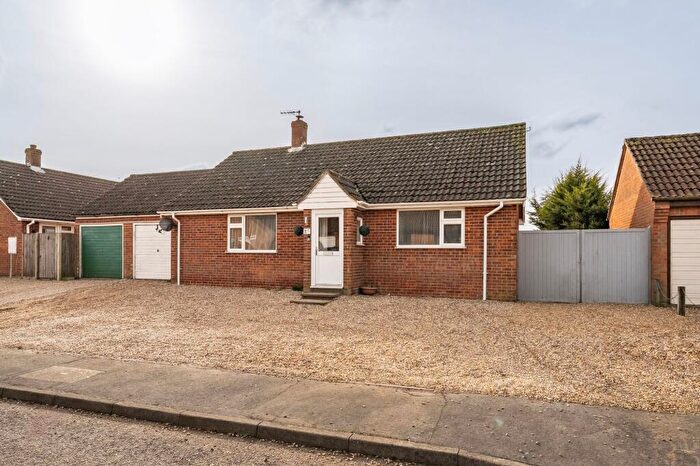
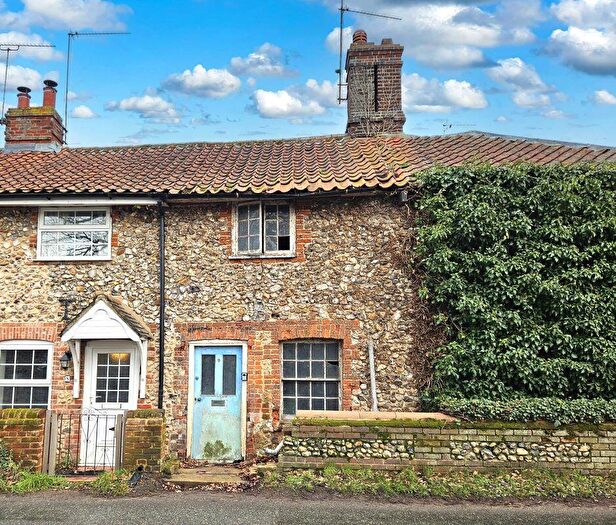
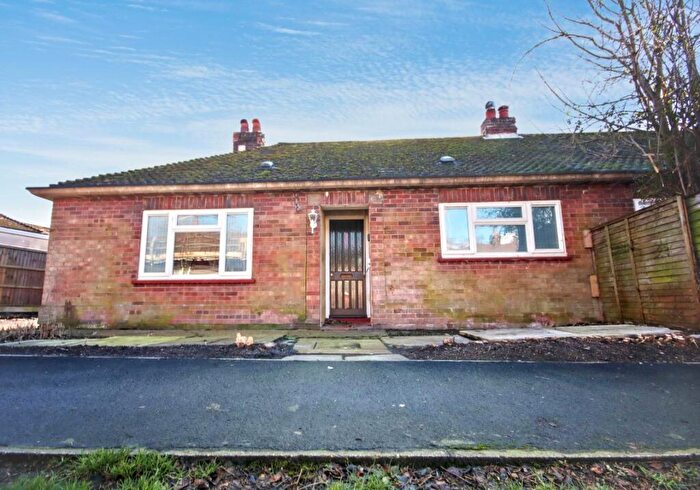
Properties for sale in Launditch
Roads and Postcodes in Launditch
Navigate through our locations to find the location of your next house in Launditch, Kings Lynn for sale or to rent.
| Streets | Postcodes |
|---|---|
| Albion Terrace | PE32 2QG |
| Back Lane | PE32 2NN PE32 2NP |
| Back Street | PE32 2PA |
| Barrows Hole Lane | PE32 2DP |
| Bates Close | PE32 2XN |
| Beeston Road | PE32 2LU PE32 2LX |
| Brocks Yard | PE32 2GZ |
| Burrells Meadow | PE32 2TL |
| Butt Lane | PE32 2NY |
| Castle Acre Road | PE32 2LP |
| Castleacre Road | PE32 2LL PE32 2LW |
| Chapel Lane | PE32 2NG |
| Church Street | PE32 2NS |
| Dereham Road | PE32 2NQ PE32 2NU PE32 2RN PE32 2RP PE32 2LE PE32 2RW |
| Druids Lane | PE32 2YA |
| Drury Lane | PE32 2YE |
| Drury Square | PE32 2NA |
| Dunham Road | PE32 2QP |
| Gouch Close | PE32 2XL |
| Hall Lane | PE32 2FN |
| Hall Road | PE32 2GL |
| Herne Lane | PE32 2NB |
| Holly Close | PE32 2SJ |
| Kempstone | PE32 2LG |
| Keppel Close | PE32 2YD |
| Lexham Lane | PE32 2QZ |
| Lexham Road | PE32 2LS PE32 2QQ PE32 2QH |
| Litcham Close | PE32 2QX |
| Litcham Road | PE32 2LJ |
| Lord Nelson Close | PE32 2ND |
| Mace Drive | PE32 2RR |
| Manor Drive | PE32 2NX PE32 2NW |
| Mileham Road | PE32 2NZ |
| Mill Drift | PE32 2FL |
| Necton Road | PE32 2DN PE32 2DW |
| Newton | PE32 2BY |
| North Street | PE32 2LR |
| Palgrave Road | PE32 2DF PE32 2LN |
| Pound Lane | PE32 2QR |
| Rectory Meadow | PE32 2NR |
| School Lane | PE32 2DQ |
| South Street | PE32 2LH |
| Sporle Road | PE32 2DE |
| Station Road | PE32 2DJ PE32 2LT |
| Syers Lane | PE32 2NJ |
| The Square | PE32 2SH |
| The Street | PE32 2DH PE32 2NF PE32 2FR |
| Tittleshall Road | PE32 2PB |
| Waterend Lane | PE32 2NL |
| Watery Lane | PE32 2BF PE32 2YQ |
| Weasenham Road | PE32 2QT |
| Wellingham Road | PE32 2QS |
| PE32 2DG PE32 2LQ PE32 2LZ PE32 2NE PE32 2NT PE32 2QN PE32 2SA PE32 2DA PE32 2DL PE32 2FE PE32 2FQ PE32 2LY PE32 2NH PE32 2QJ PE32 2QL PE32 2QW PE32 2RY PE32 2RZ PE32 2SB PE32 2SD PE32 2SE PE32 2SF PE32 2SG PE32 2SL PE32 2SQ PE32 2XW |
Transport near Launditch
-
King's Lynn Station
-
Watlington Station
-
Attleborough Station
-
Wymondham Station
-
Spooner Row Station
-
Eccles Road Station
-
Harling Road Station
-
Downham Market Station
-
Brandon Station
- FAQ
- Price Paid By Year
- Property Type Price
Frequently asked questions about Launditch
What is the average price for a property for sale in Launditch?
The average price for a property for sale in Launditch is £462,481. This amount is 55% higher than the average price in Kings Lynn. There are 1,096 property listings for sale in Launditch.
What streets have the most expensive properties for sale in Launditch?
The streets with the most expensive properties for sale in Launditch are Beeston Road at an average of £985,000, Mileham Road at an average of £744,500 and Necton Road at an average of £696,250.
What streets have the most affordable properties for sale in Launditch?
The streets with the most affordable properties for sale in Launditch are Keppel Close at an average of £212,500, Litcham Road at an average of £254,362 and Tittleshall Road at an average of £263,750.
Which train stations are available in or near Launditch?
Some of the train stations available in or near Launditch are King's Lynn, Watlington and Attleborough.
Property Price Paid in Launditch by Year
The average sold property price by year was:
| Year | Average Sold Price | Price Change |
Sold Properties
|
|---|---|---|---|
| 2025 | £451,950 | 13% |
21 Properties |
| 2024 | £393,594 | -31% |
15 Properties |
| 2023 | £514,749 | 26% |
24 Properties |
| 2022 | £381,212 | -6% |
33 Properties |
| 2021 | £404,448 | 26% |
30 Properties |
| 2020 | £301,045 | 1% |
22 Properties |
| 2019 | £298,981 | -3% |
29 Properties |
| 2018 | £308,900 | -16% |
30 Properties |
| 2017 | £359,107 | 29% |
28 Properties |
| 2016 | £254,650 | -23% |
25 Properties |
| 2015 | £312,948 | 9% |
31 Properties |
| 2014 | £284,008 | 14% |
29 Properties |
| 2013 | £244,355 | -16% |
30 Properties |
| 2012 | £282,743 | -1% |
24 Properties |
| 2011 | £285,443 | 18% |
18 Properties |
| 2010 | £233,590 | 1% |
21 Properties |
| 2009 | £230,501 | 1% |
23 Properties |
| 2008 | £227,267 | -17% |
17 Properties |
| 2007 | £264,947 | -14% |
35 Properties |
| 2006 | £301,816 | 39% |
34 Properties |
| 2005 | £184,323 | -1% |
23 Properties |
| 2004 | £186,499 | -7% |
22 Properties |
| 2003 | £198,685 | 25% |
27 Properties |
| 2002 | £149,886 | 7% |
18 Properties |
| 2001 | £138,999 | 19% |
27 Properties |
| 2000 | £112,455 | 9% |
27 Properties |
| 1999 | £101,885 | 15% |
35 Properties |
| 1998 | £86,664 | -13% |
23 Properties |
| 1997 | £97,855 | 28% |
30 Properties |
| 1996 | £70,059 | 0,4% |
40 Properties |
| 1995 | £69,789 | - |
25 Properties |
Property Price per Property Type in Launditch
Here you can find historic sold price data in order to help with your property search.
The average Property Paid Price for specific property types in the last three years are:
| Property Type | Average Sold Price | Sold Properties |
|---|---|---|
| Semi Detached House | £308,342.00 | 13 Semi Detached Houses |
| Detached House | £558,831.00 | 39 Detached Houses |
| Terraced House | £243,250.00 | 8 Terraced Houses |

