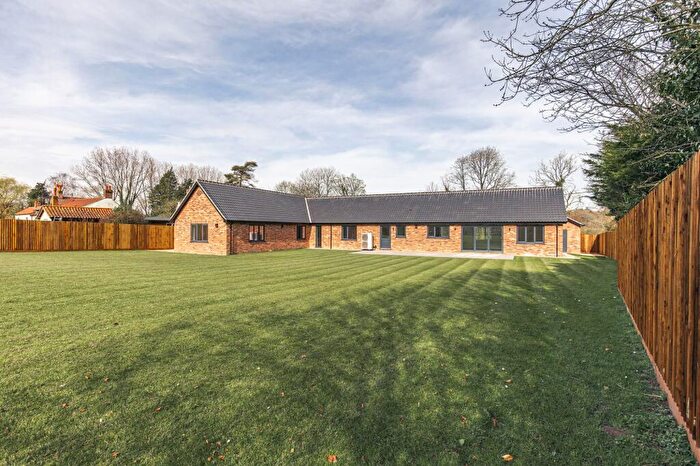
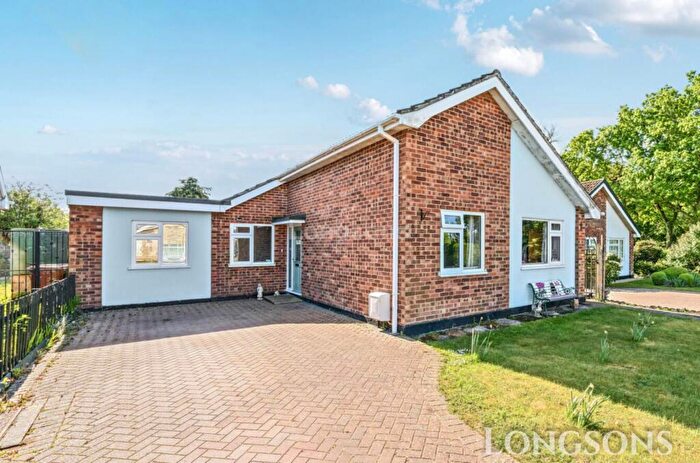
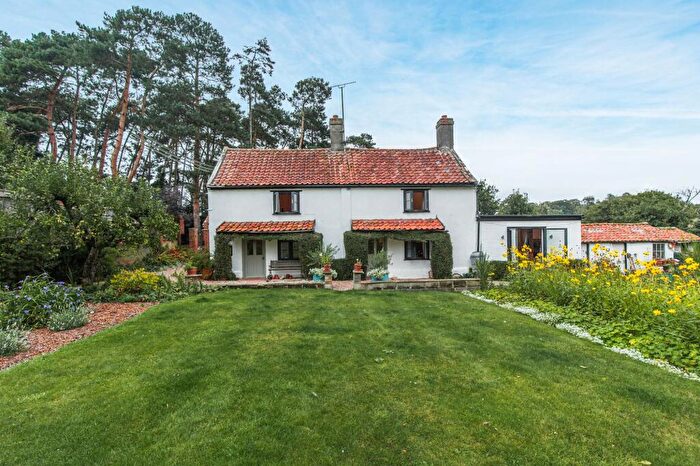
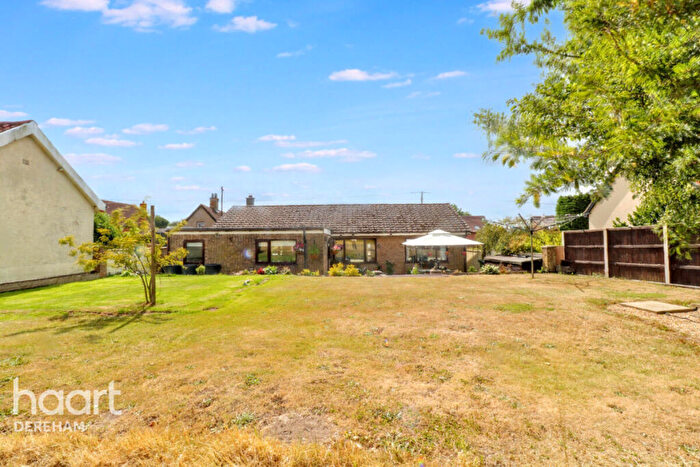
Houses for sale & to rent in Necton, Swaffham
House Prices in Necton
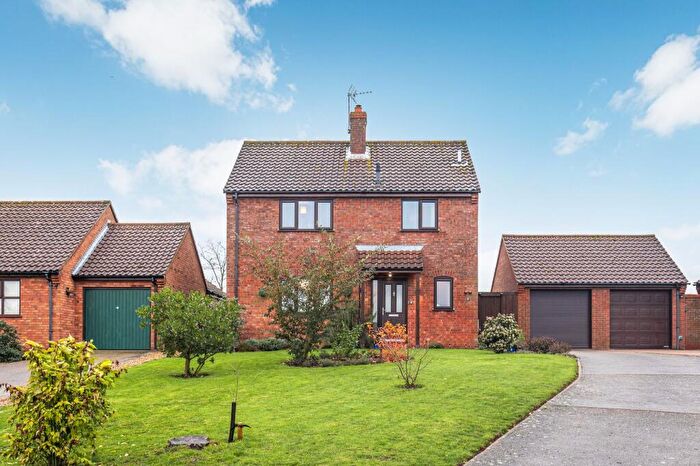
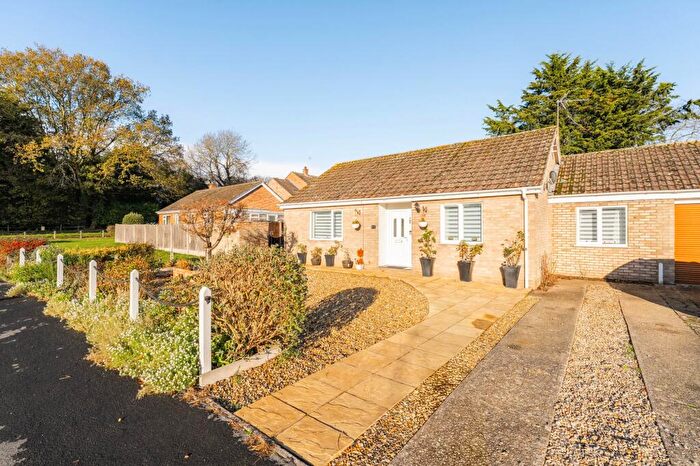
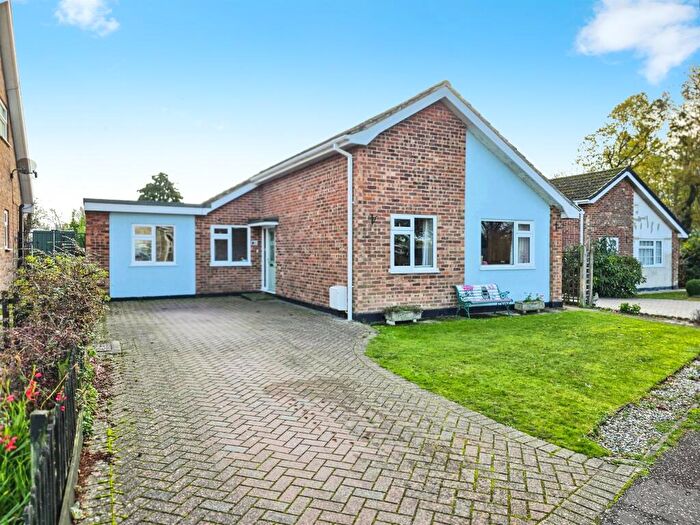
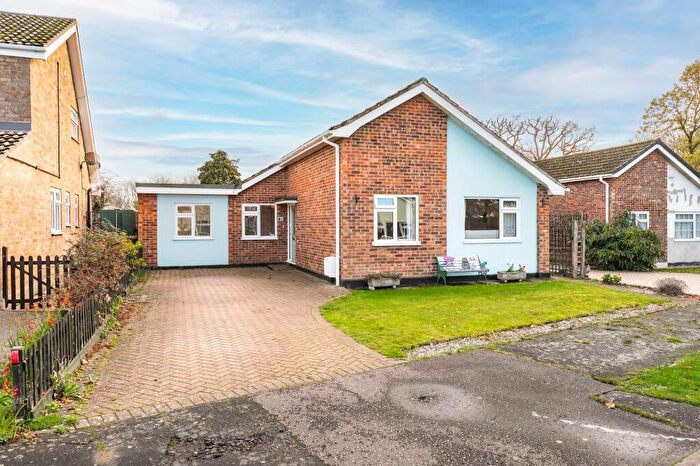
Properties in Necton have an average house price of £306,560.00 and had 99 Property Transactions within the last 3 years¹.
Necton is an area in Swaffham, Norfolk with 879 households², where the most expensive property was sold for £1,350,000.00.
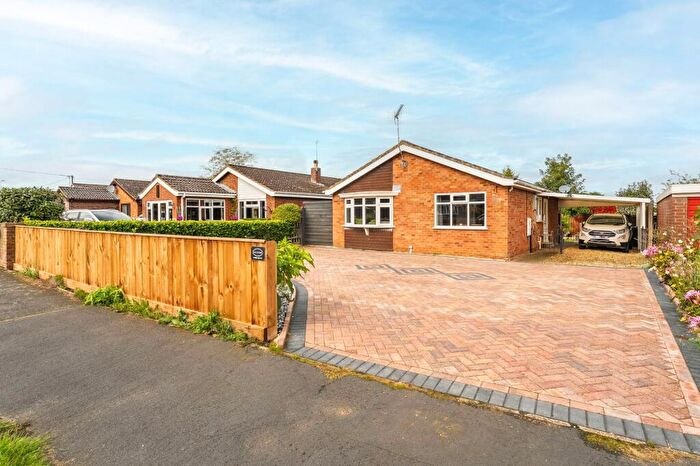
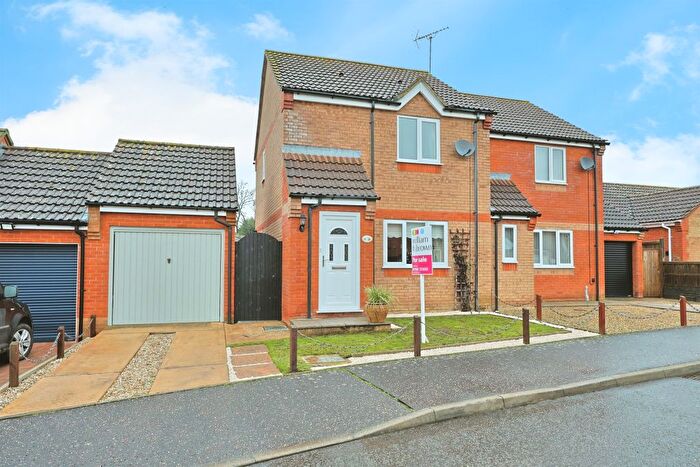
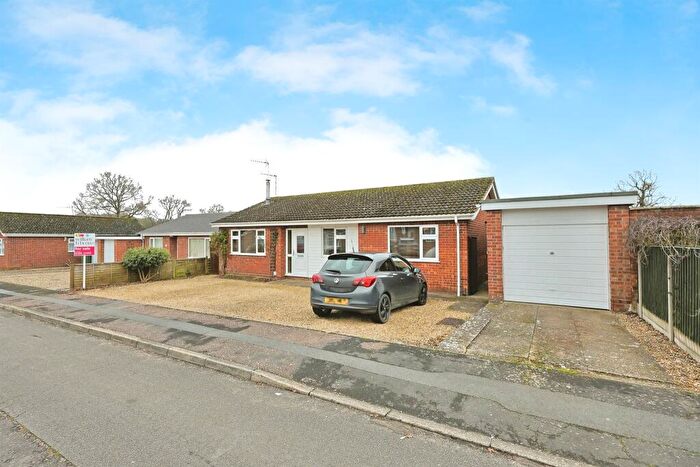
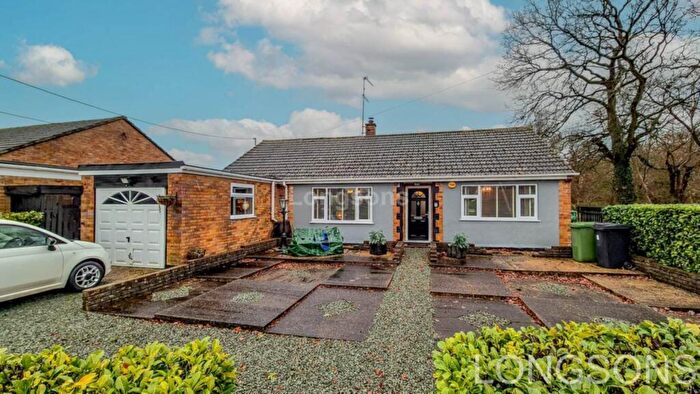
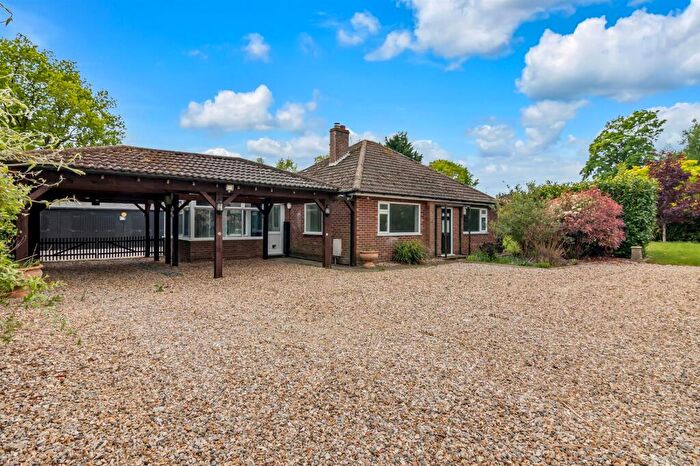
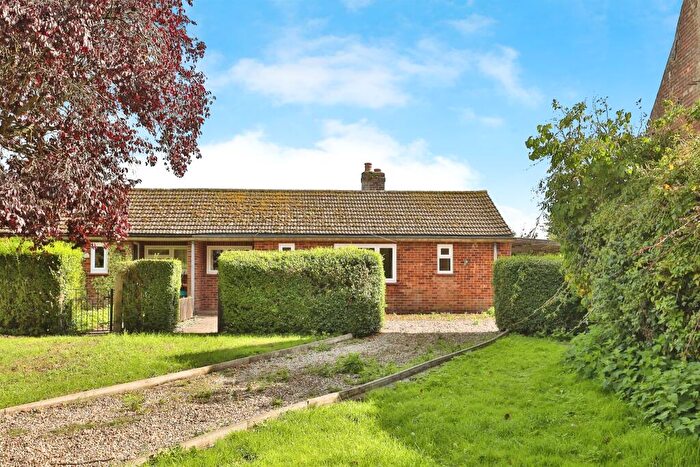
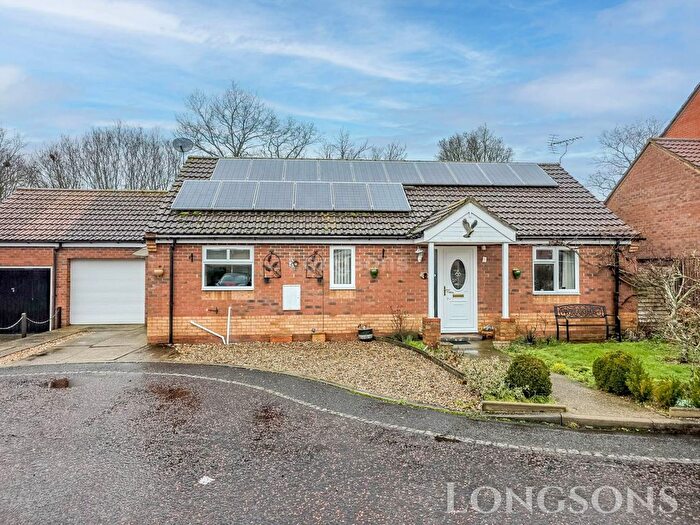
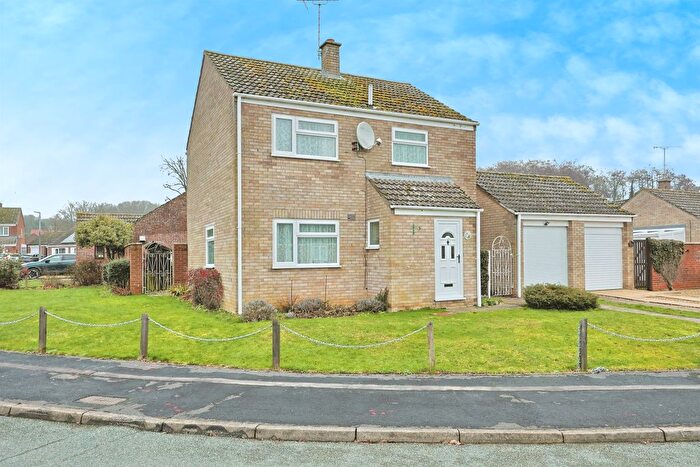
Properties for sale in Necton
Previously listed properties in Necton
Roads and Postcodes in Necton
Navigate through our locations to find the location of your next house in Necton, Swaffham for sale or to rent.
| Streets | Postcodes |
|---|---|
| Ash Meadow | PE37 8GB |
| Bells Meadow | PE37 8NE |
| Bengeys Road | PE37 8LZ |
| Bittern Close | PE37 8NP |
| Boundary Cottages | PE37 8DJ |
| Brackenwoods | PE37 8EU PE37 8EX |
| Briar Close | PE37 8HB |
| Burnside | PE37 8ER |
| Chantry Court | PE37 8HA |
| Chantry Lane | PE37 8ES PE37 8ET PE37 8HU |
| Chapel Road | PE37 8JA |
| Church View | PE37 8HE |
| Eastgate Park | PE37 8ED |
| Elizabeth Drive | PE37 8NB PE37 8ND |
| Farm View | IP25 7EG |
| Farm Walk | PE37 8LX |
| Folly View | PE37 8LU |
| Grove Lane | PE37 8EQ |
| Hale Road | PE37 8EY |
| Heron Way | PE37 8NQ |
| Ivy Todd | PE37 8JB |
| Ivy Todd Road | PE37 8HZ |
| Jubilee Way | PE37 8NA |
| Ketts Hill | PE37 8HX |
| Kingfisher Drive | PE37 8NN |
| Larwood Close | PE37 8HW |
| Maple Drive | PE37 8GA |
| Masons Drive | PE37 8EE |
| Mill Street | PE37 8EN |
| North Pickenham Road | PE37 8EF PE37 8DN |
| Norwich Road | PE37 8DQ PE37 8EG |
| Oaks Drive | PE37 8LY |
| Ramms Lane | PE37 8EZ |
| Rudge Way | PE37 8FP |
| School Road | PE37 8HT |
| St Andrews Lane | PE37 8HY |
| St Andrews Way | PE37 8EJ |
| The Avenue | PE37 8EP |
| Treasure Grove | PE37 8FN |
| Tuns Road | PE37 8EH PE37 8EL PE37 8HR |
| Watery Lane | PE37 8EW |
| Woodward Avenue | PE37 8FA |
| Wren Close | PE37 8NR |
| Wyndfields | PE37 8HD |
| Yaxley Meadow | IP25 7EJ |
| PE37 8DL PE37 8HS IP25 7DT IP25 7ED IP25 7EF PE37 8FQ |
Transport near Necton
- FAQ
- Price Paid By Year
- Property Type Price
Frequently asked questions about Necton
What is the average price for a property for sale in Necton?
The average price for a property for sale in Necton is £306,560. This amount is 18% higher than the average price in Swaffham. There are 339 property listings for sale in Necton.
What streets have the most expensive properties for sale in Necton?
The streets with the most expensive properties for sale in Necton are Norwich Road at an average of £745,000, Chantry Lane at an average of £368,714 and Woodward Avenue at an average of £328,750.
What streets have the most affordable properties for sale in Necton?
The streets with the most affordable properties for sale in Necton are St Andrews Way at an average of £154,000, Briar Close at an average of £170,000 and Wyndfields at an average of £212,000.
Which train stations are available in or near Necton?
Some of the train stations available in or near Necton are Attleborough, Harling Road and Eccles Road.
Property Price Paid in Necton by Year
The average sold property price by year was:
| Year | Average Sold Price | Price Change |
Sold Properties
|
|---|---|---|---|
| 2025 | £265,543 | -12% |
23 Properties |
| 2024 | £297,735 | -13% |
34 Properties |
| 2023 | £336,165 | 3% |
42 Properties |
| 2022 | £327,263 | 12% |
36 Properties |
| 2021 | £289,474 | 10% |
65 Properties |
| 2020 | £261,509 | 0,5% |
29 Properties |
| 2019 | £260,216 | 12% |
43 Properties |
| 2018 | £228,532 | -7% |
49 Properties |
| 2017 | £245,571 | 19% |
48 Properties |
| 2016 | £197,760 | 14% |
50 Properties |
| 2015 | £169,842 | -7% |
49 Properties |
| 2014 | £181,407 | -2% |
65 Properties |
| 2013 | £184,834 | 6% |
58 Properties |
| 2012 | £174,222 | 15% |
31 Properties |
| 2011 | £148,242 | -6% |
39 Properties |
| 2010 | £156,714 | -21% |
28 Properties |
| 2009 | £189,519 | -4% |
23 Properties |
| 2008 | £197,356 | 6% |
21 Properties |
| 2007 | £184,570 | 6% |
51 Properties |
| 2006 | £173,042 | 1% |
58 Properties |
| 2005 | £171,629 | 8% |
34 Properties |
| 2004 | £158,418 | 3% |
50 Properties |
| 2003 | £153,973 | 14% |
46 Properties |
| 2002 | £131,664 | 27% |
49 Properties |
| 2001 | £96,096 | 7% |
53 Properties |
| 2000 | £89,259 | 29% |
44 Properties |
| 1999 | £63,592 | -0,2% |
48 Properties |
| 1998 | £63,728 | 14% |
47 Properties |
| 1997 | £55,032 | 15% |
44 Properties |
| 1996 | £46,789 | -14% |
37 Properties |
| 1995 | £53,374 | - |
38 Properties |
Property Price per Property Type in Necton
Here you can find historic sold price data in order to help with your property search.
The average Property Paid Price for specific property types in the last three years are:
| Property Type | Average Sold Price | Sold Properties |
|---|---|---|
| Semi Detached House | £230,842.00 | 19 Semi Detached Houses |
| Detached House | £330,828.00 | 76 Detached Houses |
| Terraced House | £205,112.00 | 4 Terraced Houses |

