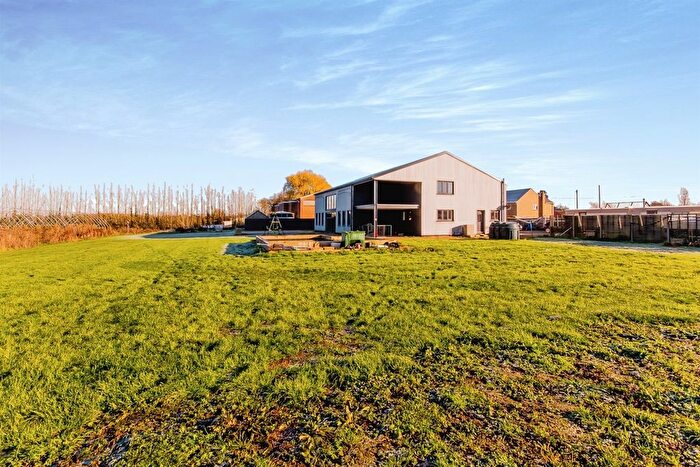
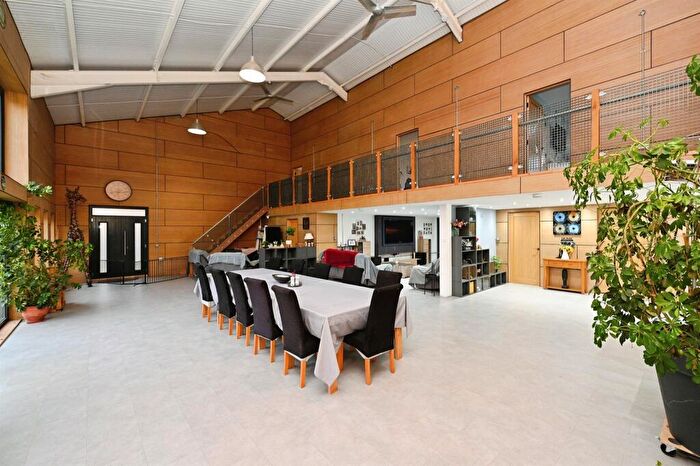
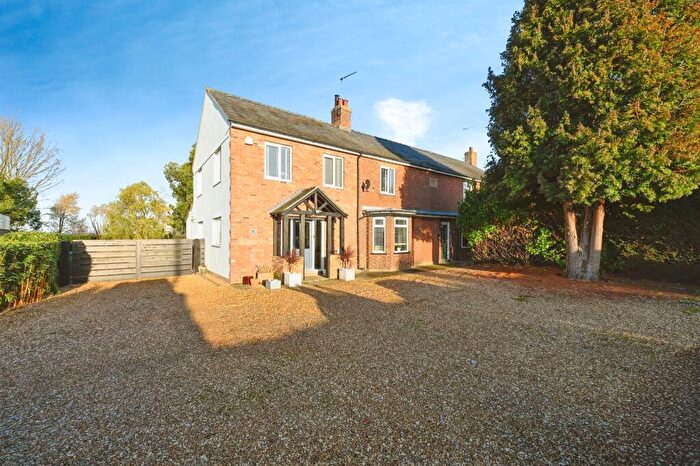
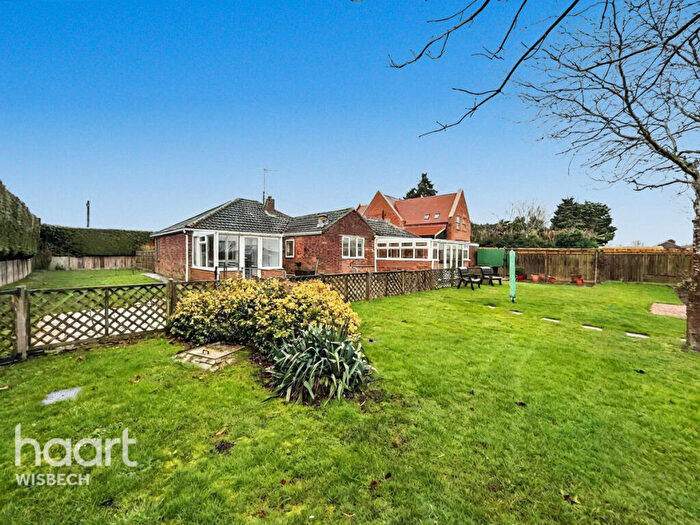
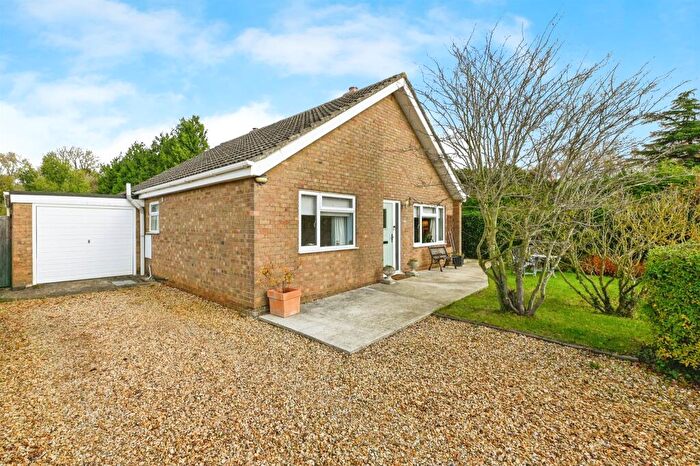
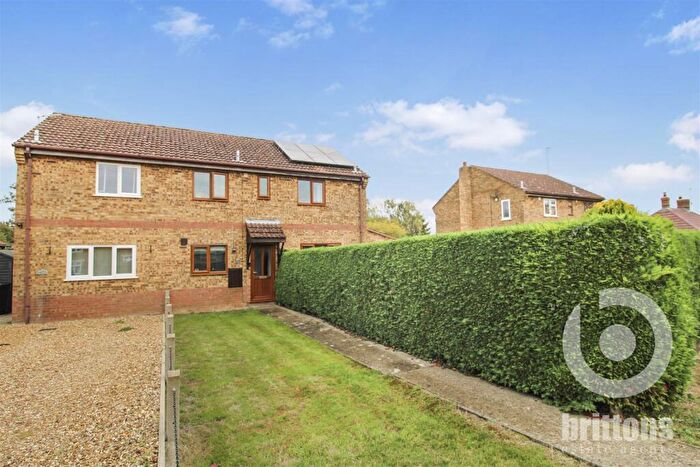
Houses for sale & to rent in St Lawrence, Kings Lynn
House Prices in St Lawrence
Properties in St Lawrence have an average house price of £250,275.00 and had 57 Property Transactions within the last 3 years¹.
St Lawrence is an area in Kings Lynn, Norfolk with 612 households², where the most expensive property was sold for £1,100,000.00.
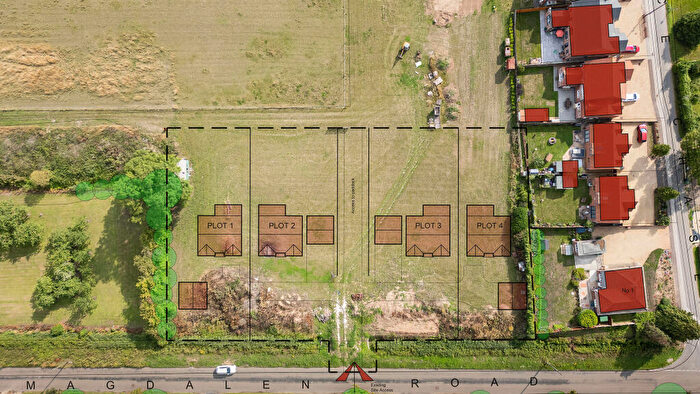
Properties for sale in St Lawrence
Roads and Postcodes in St Lawrence
Navigate through our locations to find the location of your next house in St Lawrence, Kings Lynn for sale or to rent.
| Streets | Postcodes |
|---|---|
| Aylmer Drive | PE34 4RQ |
| Church Road | PE34 4QG PE34 4QQ |
| High Road | PE34 3BH PE34 3BJ PE34 3BL PE34 3BN |
| Islington Green | PE34 4SB |
| Islington Road | PE34 4RZ |
| Lynn Road | PE34 4RT PE34 4RU |
| Magdalen Road | PE34 4QX PE34 4RE PE34 4RF PE34 4RG |
| Mill Lane | PE34 4QE |
| New Road | PE34 4QF |
| Punsfer Way | PE34 4RJ |
| School Road | PE34 4QY PE34 4QZ PE34 4RA PE34 4RB |
| Spice Chase | PE34 4RD |
| St Johns Road | PE34 4QJ PE34 4QL PE34 4QN |
| Stallett Way | PE34 4HT |
| Victory Lane | PE34 4QU |
| Westfields | PE34 4QP PE34 4QR PE34 4QS PE34 4QT |
| Westfields Close | PE34 4QW |
| Workhouse Lane | PE34 4QH |
Transport near St Lawrence
- FAQ
- Price Paid By Year
- Property Type Price
Frequently asked questions about St Lawrence
What is the average price for a property for sale in St Lawrence?
The average price for a property for sale in St Lawrence is £250,275. This amount is 16% lower than the average price in Kings Lynn. There are 295 property listings for sale in St Lawrence.
What streets have the most expensive properties for sale in St Lawrence?
The streets with the most expensive properties for sale in St Lawrence are New Road at an average of £562,500, High Road at an average of £524,200 and Spice Chase at an average of £370,000.
What streets have the most affordable properties for sale in St Lawrence?
The streets with the most affordable properties for sale in St Lawrence are Victory Lane at an average of £139,333, Islington Road at an average of £142,000 and Stallett Way at an average of £143,750.
Which train stations are available in or near St Lawrence?
Some of the train stations available in or near St Lawrence are Watlington, King's Lynn and Downham Market.
Property Price Paid in St Lawrence by Year
The average sold property price by year was:
| Year | Average Sold Price | Price Change |
Sold Properties
|
|---|---|---|---|
| 2025 | £255,300 | 11% |
20 Properties |
| 2024 | £227,653 | -13% |
13 Properties |
| 2023 | £258,341 | - |
24 Properties |
| 2022 | £258,466 | 15% |
15 Properties |
| 2021 | £219,388 | -12% |
39 Properties |
| 2020 | £245,315 | -7% |
18 Properties |
| 2019 | £263,048 | 19% |
29 Properties |
| 2018 | £212,990 | -2% |
25 Properties |
| 2017 | £218,142 | 17% |
28 Properties |
| 2016 | £182,070 | -12% |
31 Properties |
| 2015 | £204,291 | 13% |
24 Properties |
| 2014 | £178,284 | 6% |
35 Properties |
| 2013 | £168,192 | 27% |
13 Properties |
| 2012 | £123,397 | -53% |
20 Properties |
| 2011 | £188,296 | 34% |
15 Properties |
| 2010 | £123,730 | -21% |
13 Properties |
| 2009 | £149,638 | 5% |
18 Properties |
| 2008 | £142,722 | -22% |
9 Properties |
| 2007 | £174,278 | 24% |
25 Properties |
| 2006 | £132,748 | 3% |
35 Properties |
| 2005 | £129,212 | -2% |
20 Properties |
| 2004 | £132,076 | 21% |
30 Properties |
| 2003 | £103,969 | 0,5% |
36 Properties |
| 2002 | £103,489 | 27% |
37 Properties |
| 2001 | £75,837 | 26% |
32 Properties |
| 2000 | £56,260 | 2% |
34 Properties |
| 1999 | £55,388 | 8% |
47 Properties |
| 1998 | £50,933 | 16% |
36 Properties |
| 1997 | £42,771 | -4% |
28 Properties |
| 1996 | £44,521 | -3% |
20 Properties |
| 1995 | £45,991 | - |
31 Properties |
Property Price per Property Type in St Lawrence
Here you can find historic sold price data in order to help with your property search.
The average Property Paid Price for specific property types in the last three years are:
| Property Type | Average Sold Price | Sold Properties |
|---|---|---|
| Semi Detached House | £210,852.00 | 17 Semi Detached Houses |
| Terraced House | £153,784.00 | 13 Terraced Houses |
| Detached House | £321,555.00 | 27 Detached Houses |

