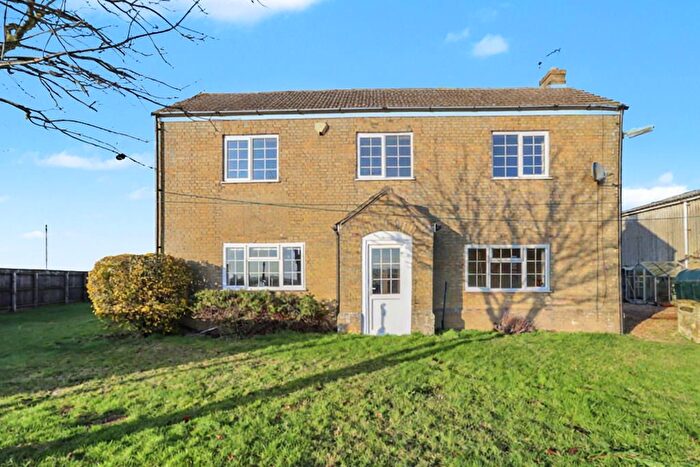
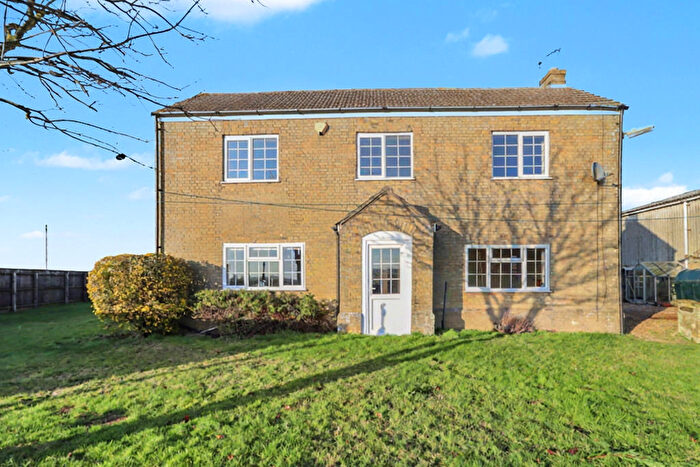
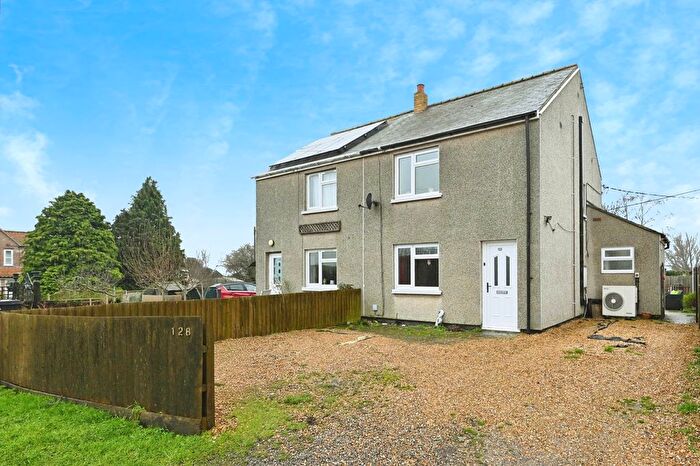
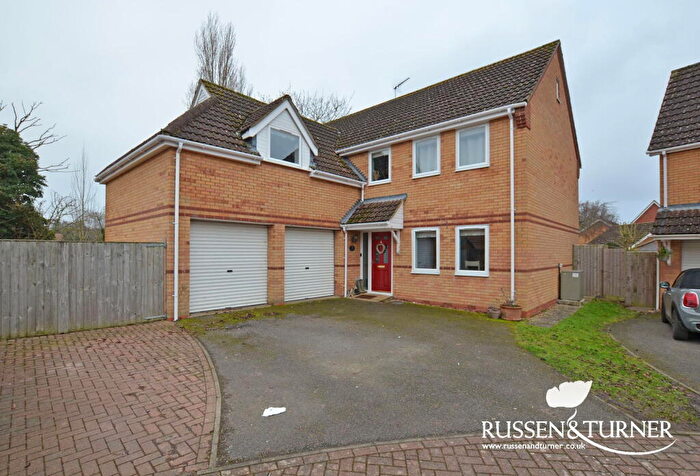
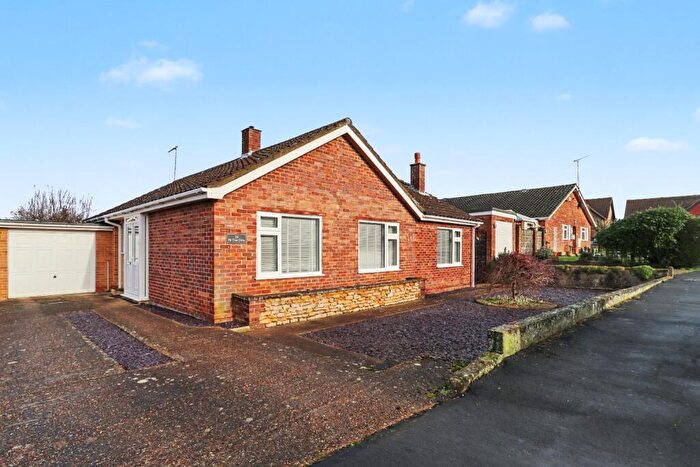
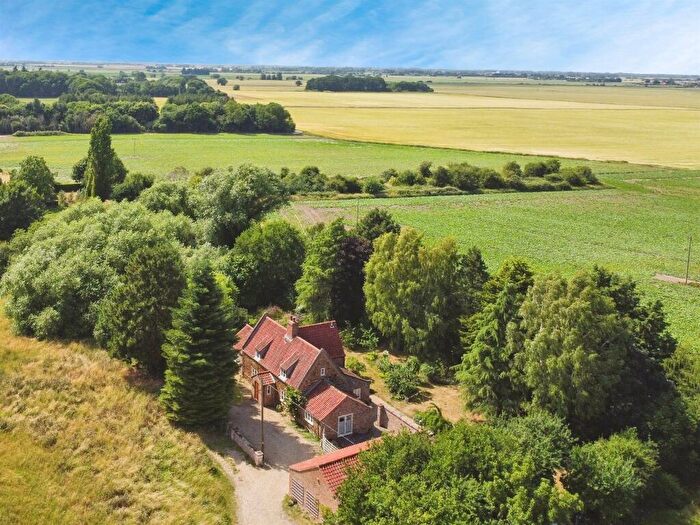
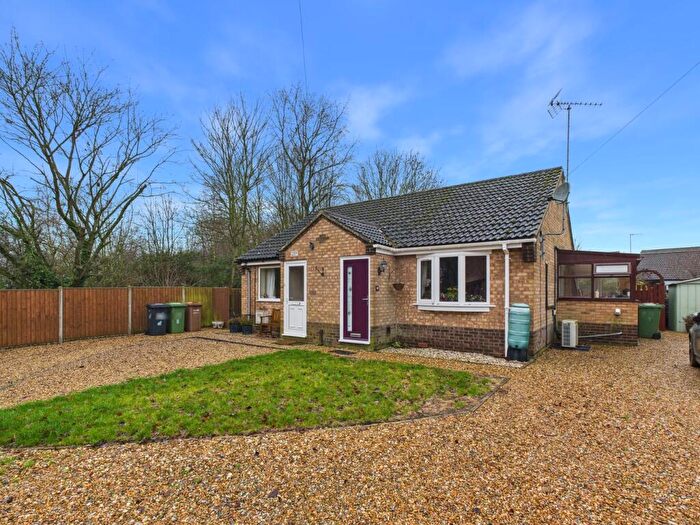
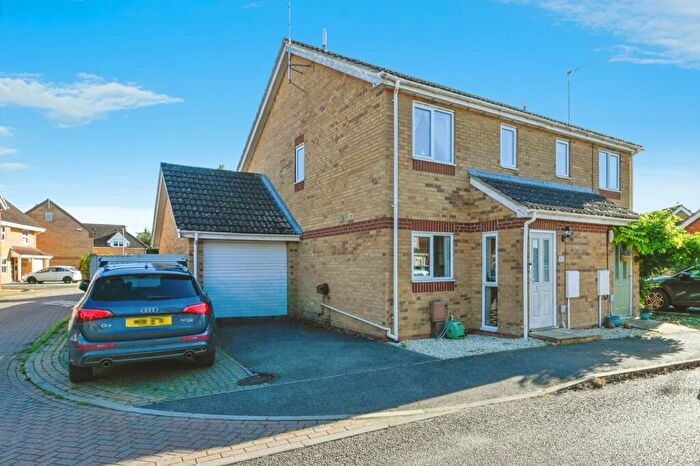
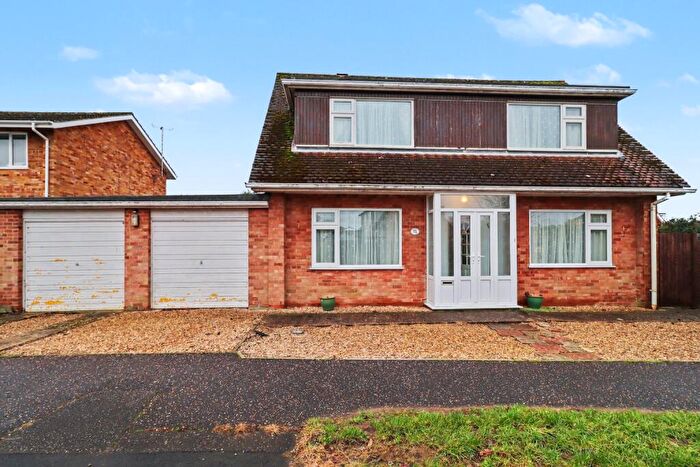
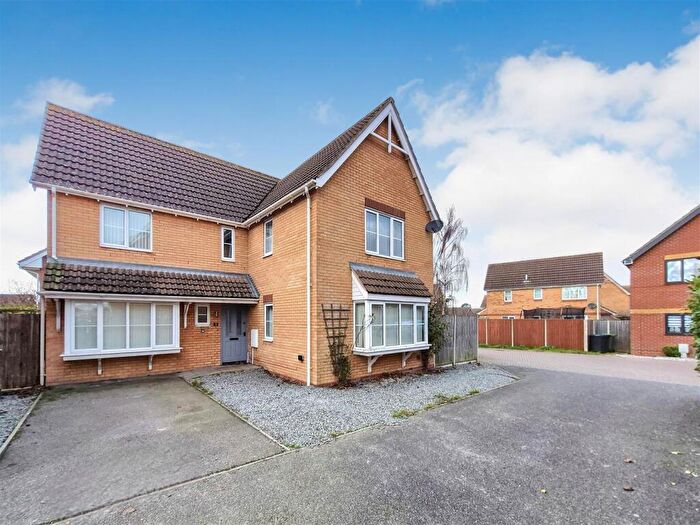
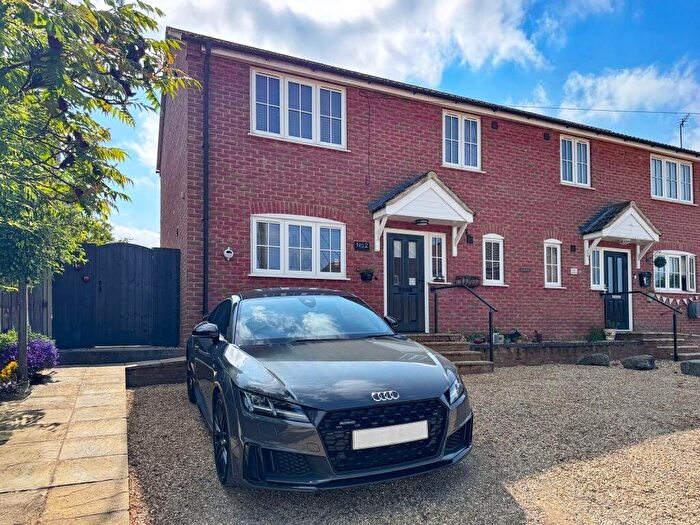
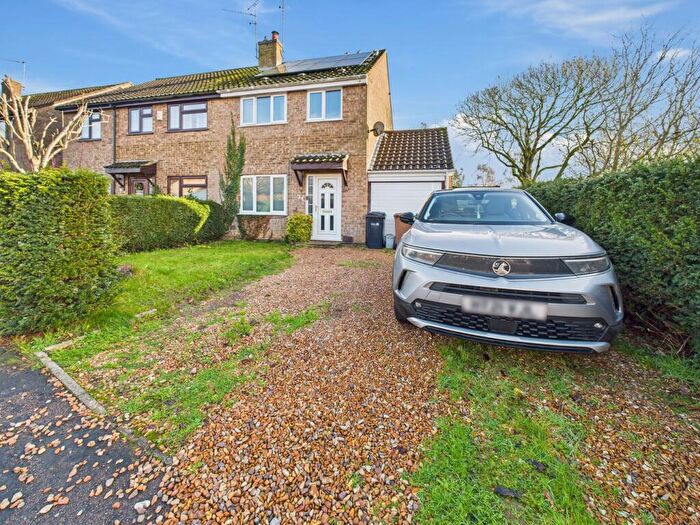
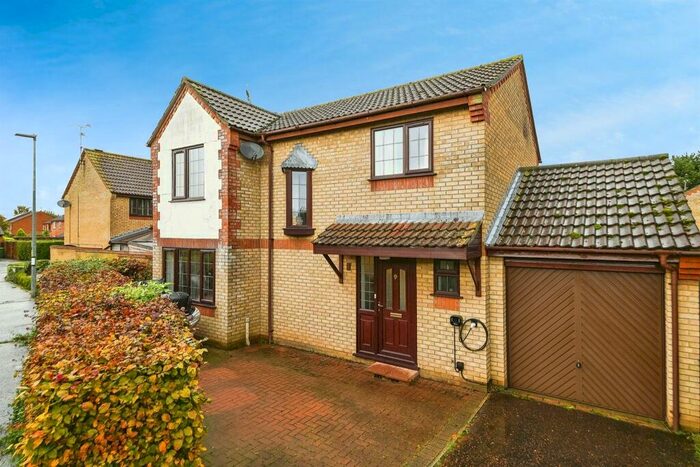
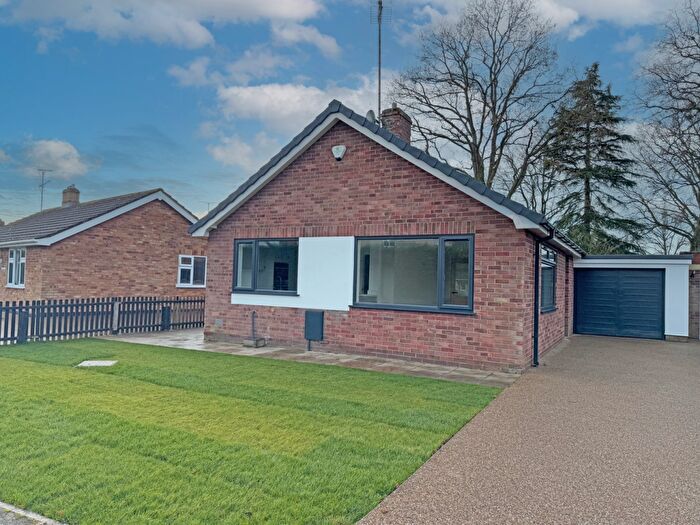
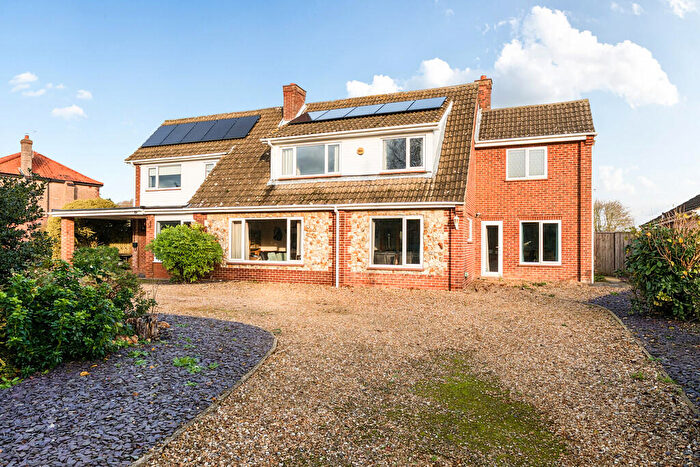
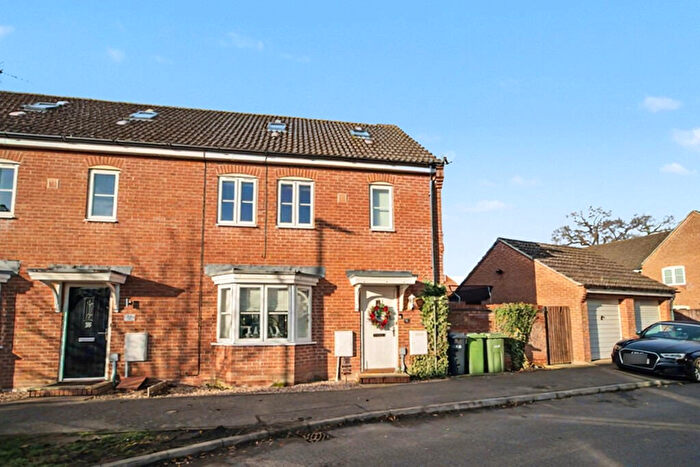
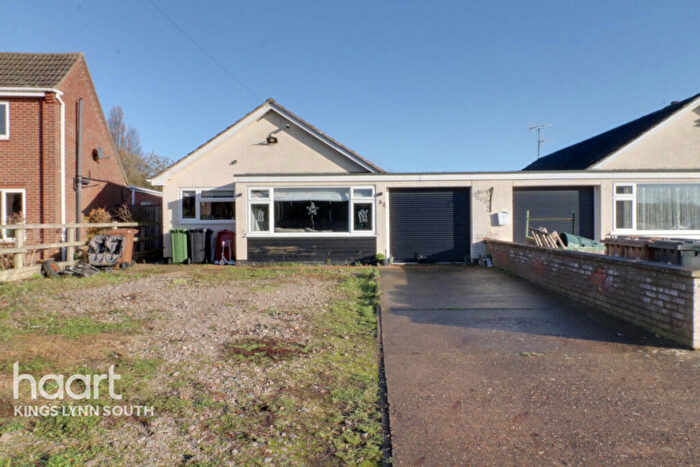
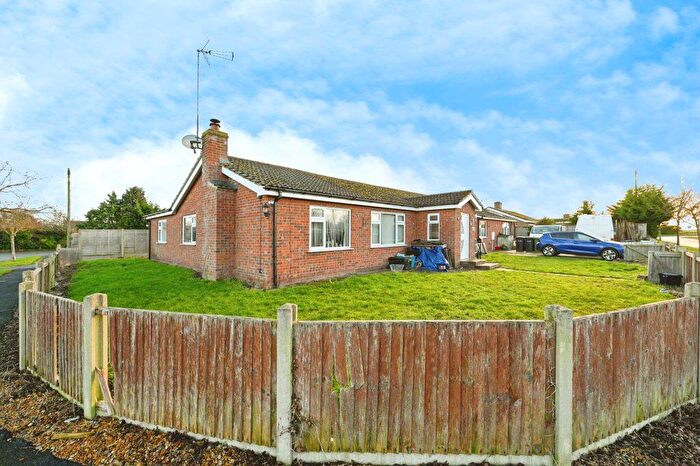
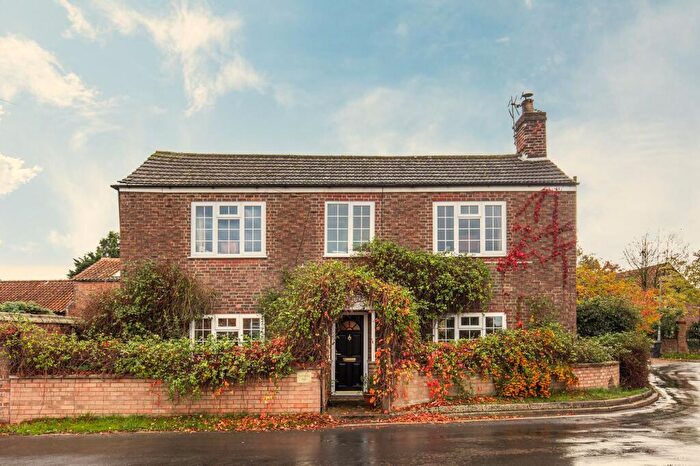
Houses for sale & to rent in Wiggenhall, Kings Lynn
House Prices in Wiggenhall
Properties in Wiggenhall have an average house price of £304,361.00 and had 69 Property Transactions within the last 3 years¹.
Wiggenhall is an area in Kings Lynn, Norfolk with 809 households², where the most expensive property was sold for £920,000.00.
Properties for sale in Wiggenhall
Roads and Postcodes in Wiggenhall
Navigate through our locations to find the location of your next house in Wiggenhall, Kings Lynn for sale or to rent.
| Streets | Postcodes |
|---|---|
| Bluebell Walk | PE34 3FG |
| Burnt Lane | PE34 3DE |
| Church Close | PE34 3EP |
| Church Road | PE34 3BA PE34 3DG PE34 3EH |
| Clover Walk | PE34 3FH |
| Common Road | PE34 3EN |
| Cowslip Walk | PE34 3FD |
| Eau Brink | PE34 4SQ |
| Eau Brink Road | PE34 3DY |
| Edinburgh Place | PE34 3ED |
| Fen Road | PE34 3DB PE34 3DD |
| Fitton Road | PE34 3AU PE34 3AX PE34 3AY PE34 3EL |
| Foldgate Lane | PE34 3DA |
| Foxglove Walk | PE34 3FL |
| Garden Road | PE34 3DT |
| High Road | PE34 3AR PE34 3AW PE34 3BF PE34 3BG PE34 3BQ |
| Hiltons Lane | PE34 3EZ |
| Legge Place | PE34 3HD |
| Lewis Drive | PE34 3FB |
| Lynn Road | PE34 3AZ PE34 3DW PE34 3EY PE34 3HA |
| Mayflower Close | PE34 3FF |
| Mill Road | PE34 3BZ PE34 3HL |
| Orchard Road | PE34 3DS |
| Park Crescent | PE34 3BU |
| Pleasant Row | PE34 3EW |
| Prophets Alley | PE34 3DH |
| Queens Place | PE34 3EB |
| School Lane | PE34 3DZ |
| School Road | PE34 3DR PE34 3DU |
| Sluice Road | PE34 3EF PE34 3EG PE34 3EQ PE34 3ET |
| St Peters Road | PE34 3HB PE34 3HE PE34 3HF |
| Stow Road | PE34 3BB PE34 3BD PE34 3BT PE34 3BX PE34 3BY PE34 3DJ PE34 3PF |
| Surrey Street | PE34 3EX |
| Turrell Close | PE34 3FJ |
| Vine Hill | PE34 3SB |
Transport near Wiggenhall
- FAQ
- Price Paid By Year
- Property Type Price
Frequently asked questions about Wiggenhall
What is the average price for a property for sale in Wiggenhall?
The average price for a property for sale in Wiggenhall is £304,361. This amount is 2% higher than the average price in Kings Lynn. There are 592 property listings for sale in Wiggenhall.
What streets have the most expensive properties for sale in Wiggenhall?
The streets with the most expensive properties for sale in Wiggenhall are Mill Road at an average of £459,333, High Road at an average of £437,875 and Vine Hill at an average of £365,000.
What streets have the most affordable properties for sale in Wiggenhall?
The streets with the most affordable properties for sale in Wiggenhall are Pleasant Row at an average of £65,000, Church Road at an average of £192,666 and School Road at an average of £200,000.
Which train stations are available in or near Wiggenhall?
Some of the train stations available in or near Wiggenhall are Watlington, King's Lynn and Downham Market.
Property Price Paid in Wiggenhall by Year
The average sold property price by year was:
| Year | Average Sold Price | Price Change |
Sold Properties
|
|---|---|---|---|
| 2025 | £282,420 | -5% |
25 Properties |
| 2024 | £297,300 | -15% |
25 Properties |
| 2023 | £342,523 | 4% |
19 Properties |
| 2022 | £330,281 | 13% |
42 Properties |
| 2021 | £286,553 | 16% |
46 Properties |
| 2020 | £241,451 | 7% |
31 Properties |
| 2019 | £225,605 | -1% |
33 Properties |
| 2018 | £227,972 | 13% |
29 Properties |
| 2017 | £197,785 | -5% |
35 Properties |
| 2016 | £207,366 | 10% |
45 Properties |
| 2015 | £186,424 | 10% |
33 Properties |
| 2014 | £167,581 | 0,4% |
37 Properties |
| 2013 | £166,943 | 5% |
36 Properties |
| 2012 | £158,944 | -13% |
18 Properties |
| 2011 | £178,923 | -1% |
23 Properties |
| 2010 | £181,016 | 7% |
24 Properties |
| 2009 | £167,547 | -8% |
19 Properties |
| 2008 | £181,020 | -9% |
31 Properties |
| 2007 | £197,236 | 14% |
57 Properties |
| 2006 | £168,741 | -5% |
51 Properties |
| 2005 | £176,401 | 7% |
39 Properties |
| 2004 | £164,477 | 25% |
82 Properties |
| 2003 | £123,232 | 16% |
61 Properties |
| 2002 | £103,388 | 22% |
43 Properties |
| 2001 | £80,363 | 9% |
42 Properties |
| 2000 | £73,429 | 2% |
43 Properties |
| 1999 | £71,730 | 20% |
55 Properties |
| 1998 | £57,591 | -9% |
26 Properties |
| 1997 | £62,842 | 39% |
34 Properties |
| 1996 | £38,483 | -6% |
24 Properties |
| 1995 | £40,971 | - |
21 Properties |
Property Price per Property Type in Wiggenhall
Here you can find historic sold price data in order to help with your property search.
The average Property Paid Price for specific property types in the last three years are:
| Property Type | Average Sold Price | Sold Properties |
|---|---|---|
| Semi Detached House | £236,646.00 | 17 Semi Detached Houses |
| Detached House | £345,238.00 | 46 Detached Houses |
| Terraced House | £182,833.00 | 6 Terraced Houses |

