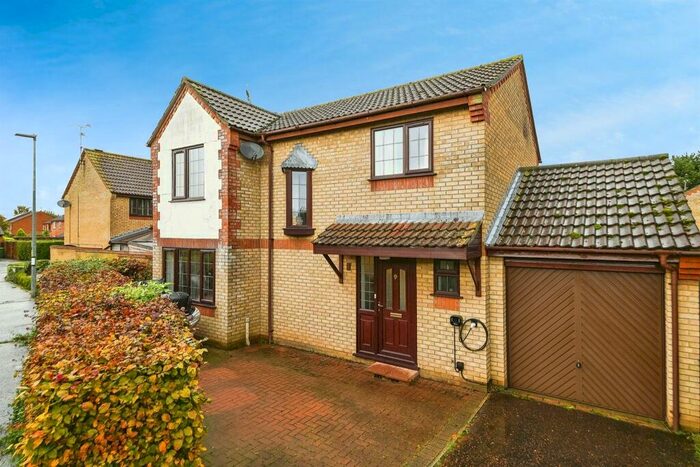
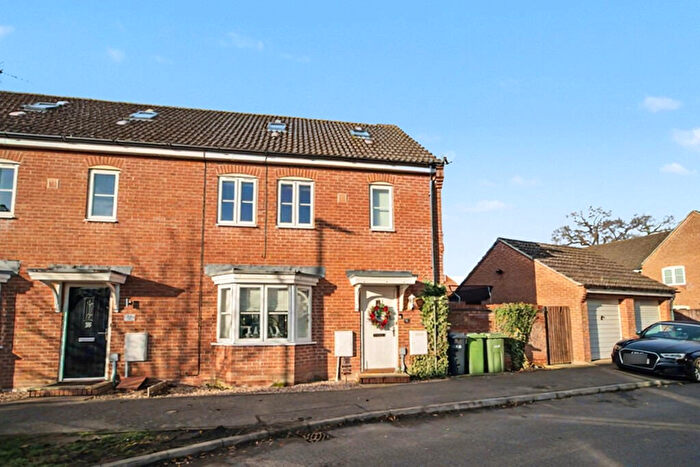
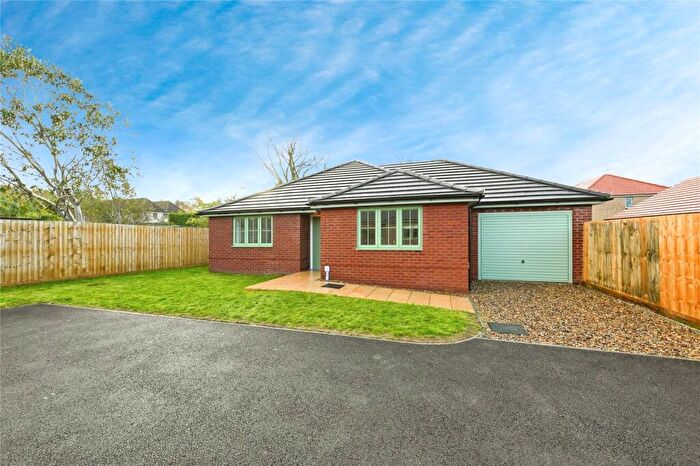
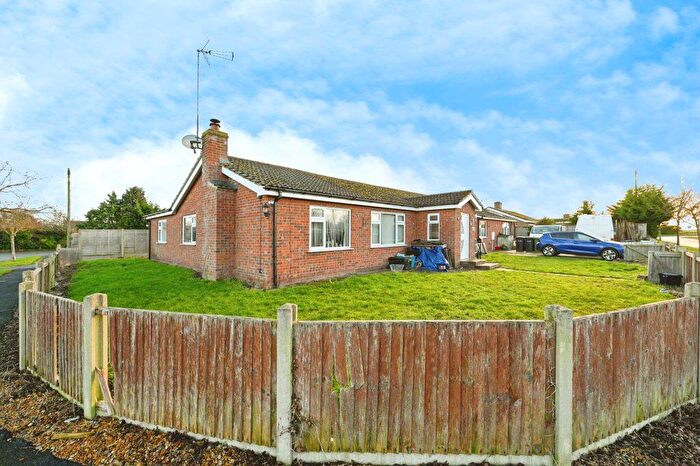
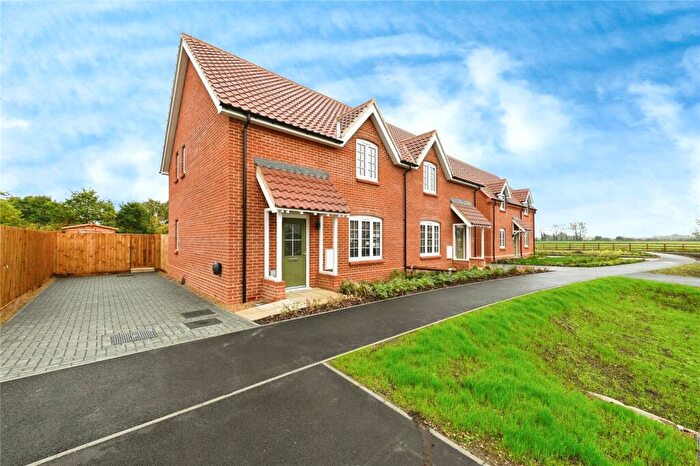
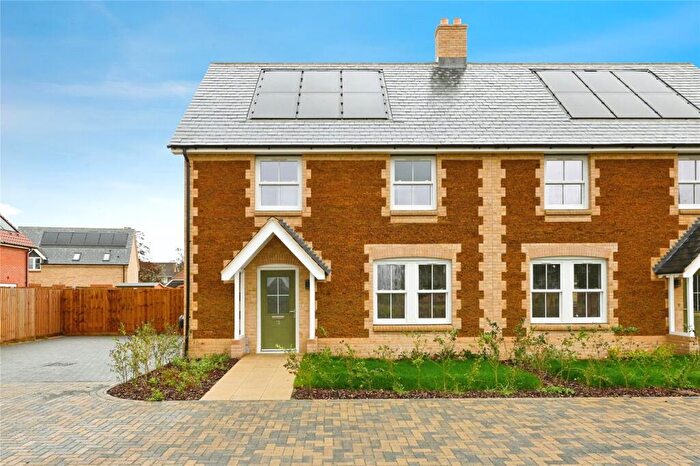
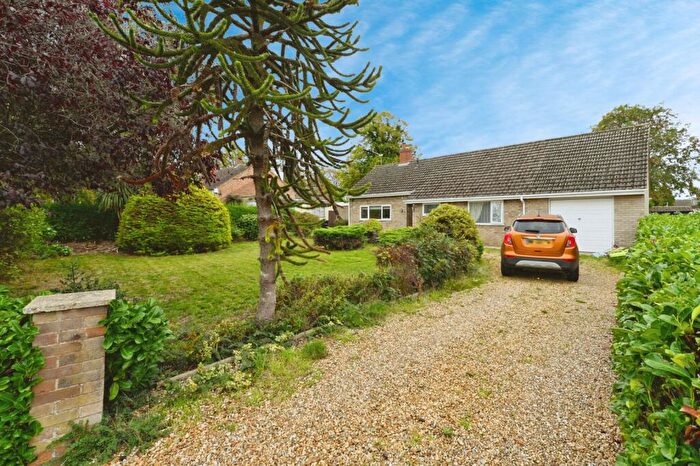
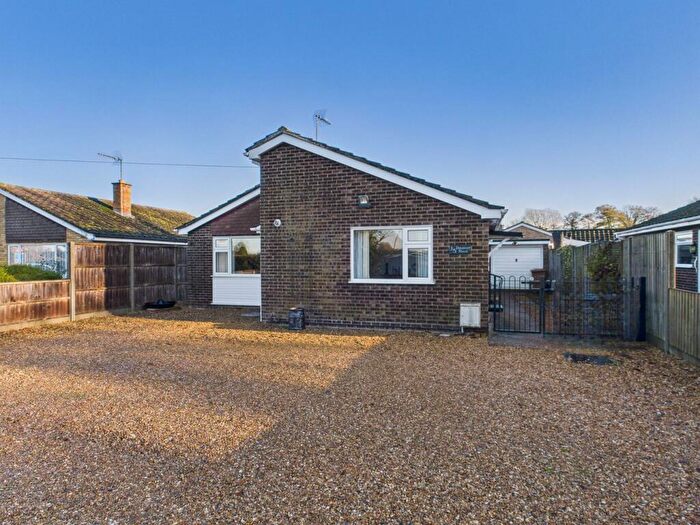
Houses for sale & to rent in Watlington, Kings Lynn
House Prices in Watlington
Properties in Watlington have an average house price of £261,921.00 and had 119 Property Transactions within the last 3 years¹.
Watlington is an area in Kings Lynn, Norfolk with 1,026 households², where the most expensive property was sold for £720,000.00.
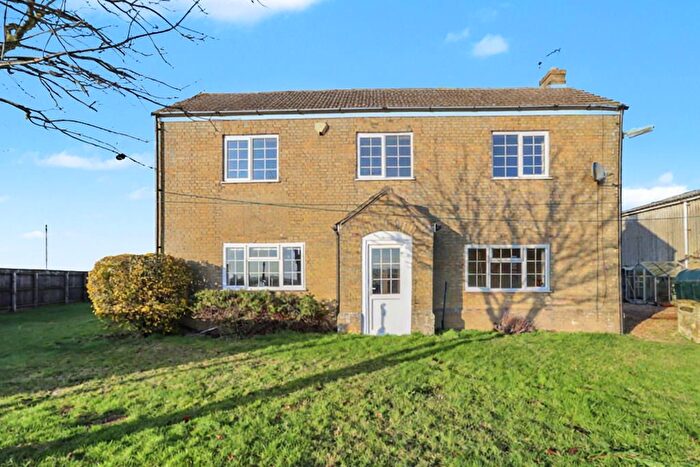
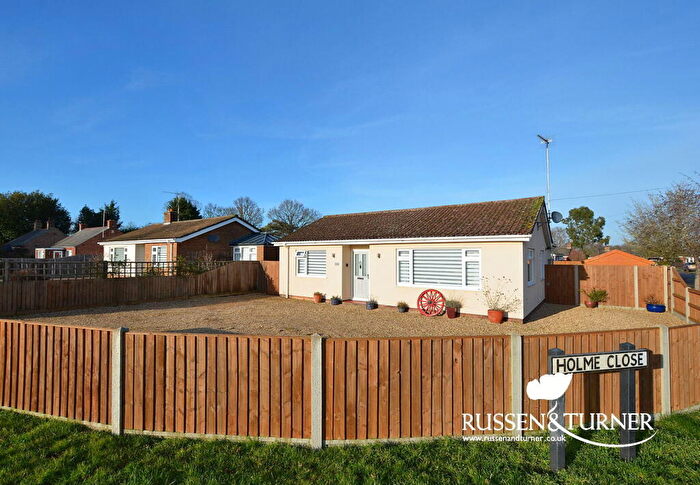
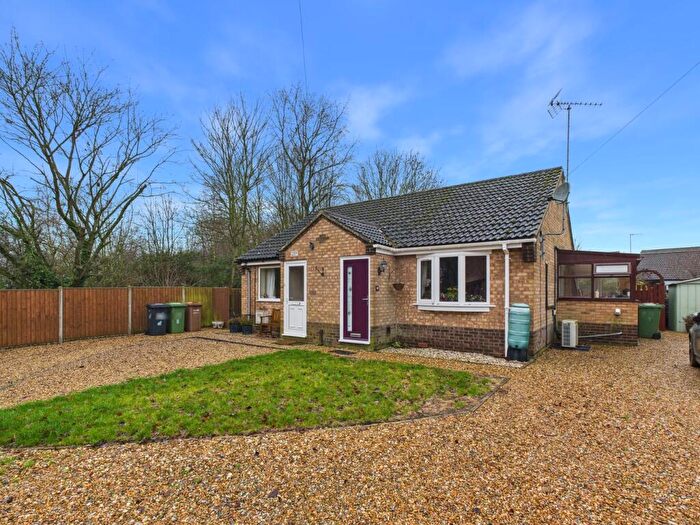
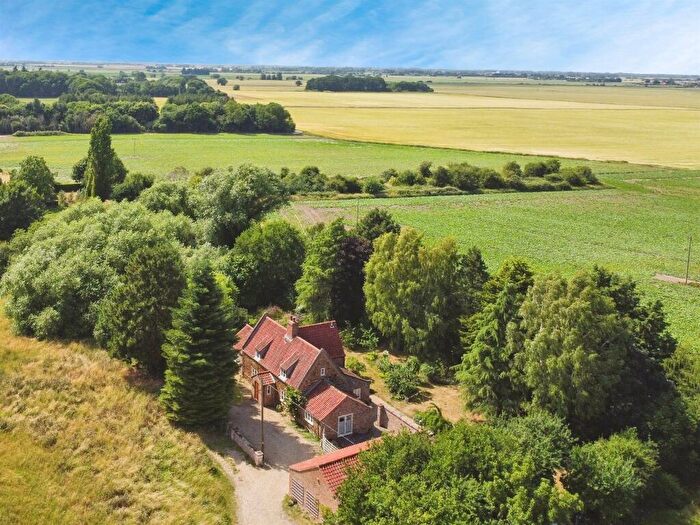
Properties for sale in Watlington
Roads and Postcodes in Watlington
Navigate through our locations to find the location of your next house in Watlington, Kings Lynn for sale or to rent.
| Streets | Postcodes |
|---|---|
| Babingley Close | PE33 0TR |
| Barley Close | PE33 0JD |
| Barnards Lane | PE33 0JN |
| Beechwood Close | PE33 0HP |
| Bennett Close | PE33 0TF |
| Britton Close | PE33 0JH PE33 0JQ |
| Bure Close | PE33 0TN |
| Cecil Close | PE33 0JS |
| Challis Close | PE33 0EY |
| Chestnut Close | PE33 0HX |
| Church Road | PE33 0HE |
| Downham Road | PE33 0HR PE33 0HS PE33 0HT |
| Fairfield Lane | PE33 0JE |
| Featherby Drive | PE33 0TY |
| Fen Road | PE33 0HY PE33 0HZ PE33 0JA PE33 0JB |
| Fendley Close | PE33 0TW |
| Franklin Way | PE33 0TZ |
| Glebe Avenue | PE33 0HW |
| Gypsy Lane | PE33 0JJ |
| Hawthorn Close | PE33 0HD |
| Jackson Close | PE33 0FH |
| John Davis Way | PE33 0TB PE33 0TD |
| Kent Drive | PE33 0EZ |
| Lacey Close | PE33 0TX |
| Lake Close | PE33 0TJ |
| Langridge Circle | PE33 0UF |
| Lark Road | PE33 0TL |
| Lynn Road | PE33 0HG PE33 0SR |
| Martin Close | PE33 0FJ |
| Mill Road | PE33 0HH PE33 0HJ |
| Nene Road | PE33 0TP |
| Nolan Court | PE33 0JP |
| Old Chapel Close | PE33 0FA |
| Orchard Close | PE33 0HN |
| Paige Close | PE33 0TQ |
| Plough Lane | PE33 0HQ |
| Rectory Lane | PE33 0HU |
| Rowan Close | PE33 0TU PE33 0UG |
| School Road | PE33 0HA |
| St Peters Road | PE33 0JW |
| Station Road | PE33 0JF PE33 0JG |
| Stiffkey Close | PE33 0JT |
| Stone Close | PE33 0TE |
| Thieves Bridge Road | PE33 0HL |
| Thomas Close | PE33 0TG |
| Tottenhill | PE33 0RJ PE33 0RL PE33 0SA |
| Warren Close | PE33 0TA |
| Wensum Close | PE33 0TT |
| Willow Close | PE33 0JR |
| Woodward Close | PE33 0FL |
Transport near Watlington
- FAQ
- Price Paid By Year
- Property Type Price
Frequently asked questions about Watlington
What is the average price for a property for sale in Watlington?
The average price for a property for sale in Watlington is £261,921. This amount is 12% lower than the average price in Kings Lynn. There are 307 property listings for sale in Watlington.
What streets have the most expensive properties for sale in Watlington?
The streets with the most expensive properties for sale in Watlington are Hawthorn Close at an average of £420,000, Plough Lane at an average of £395,000 and Barnards Lane at an average of £385,000.
What streets have the most affordable properties for sale in Watlington?
The streets with the most affordable properties for sale in Watlington are Fairfield Lane at an average of £156,500, Thomas Close at an average of £159,165 and Beechwood Close at an average of £172,000.
Which train stations are available in or near Watlington?
Some of the train stations available in or near Watlington are Watlington, Downham Market and King's Lynn.
Property Price Paid in Watlington by Year
The average sold property price by year was:
| Year | Average Sold Price | Price Change |
Sold Properties
|
|---|---|---|---|
| 2025 | £251,190 | -6% |
38 Properties |
| 2024 | £266,260 | -1% |
42 Properties |
| 2023 | £267,704 | -4% |
39 Properties |
| 2022 | £277,990 | 15% |
55 Properties |
| 2021 | £237,446 | 4% |
65 Properties |
| 2020 | £228,973 | 12% |
48 Properties |
| 2019 | £202,588 | 4% |
50 Properties |
| 2018 | £194,730 | 0,2% |
52 Properties |
| 2017 | £194,275 | -6% |
68 Properties |
| 2016 | £205,035 | 5% |
70 Properties |
| 2015 | £194,437 | 10% |
77 Properties |
| 2014 | £174,858 | 7% |
70 Properties |
| 2013 | £162,276 | 2% |
38 Properties |
| 2012 | £158,936 | 8% |
43 Properties |
| 2011 | £145,992 | -12% |
55 Properties |
| 2010 | £163,376 | 12% |
42 Properties |
| 2009 | £144,535 | -11% |
44 Properties |
| 2008 | £160,290 | -2% |
51 Properties |
| 2007 | £163,989 | 7% |
113 Properties |
| 2006 | £153,223 | 10% |
68 Properties |
| 2005 | £137,756 | 1% |
37 Properties |
| 2004 | £136,649 | 20% |
57 Properties |
| 2003 | £108,851 | 20% |
52 Properties |
| 2002 | £87,021 | 12% |
54 Properties |
| 2001 | £76,859 | 15% |
69 Properties |
| 2000 | £65,214 | 11% |
77 Properties |
| 1999 | £57,885 | 13% |
74 Properties |
| 1998 | £50,375 | 4% |
68 Properties |
| 1997 | £48,392 | 0,3% |
80 Properties |
| 1996 | £48,238 | -4% |
58 Properties |
| 1995 | £49,997 | - |
55 Properties |
Property Price per Property Type in Watlington
Here you can find historic sold price data in order to help with your property search.
The average Property Paid Price for specific property types in the last three years are:
| Property Type | Average Sold Price | Sold Properties |
|---|---|---|
| Semi Detached House | £222,840.00 | 41 Semi Detached Houses |
| Detached House | £322,716.00 | 52 Detached Houses |
| Terraced House | £201,961.00 | 26 Terraced Houses |

