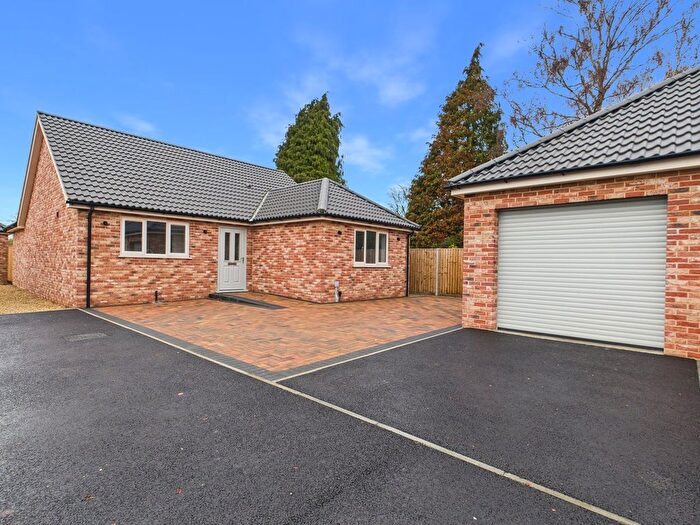
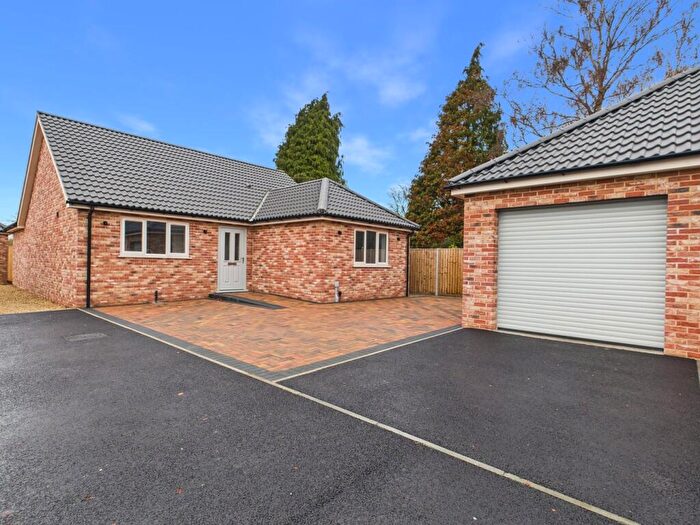
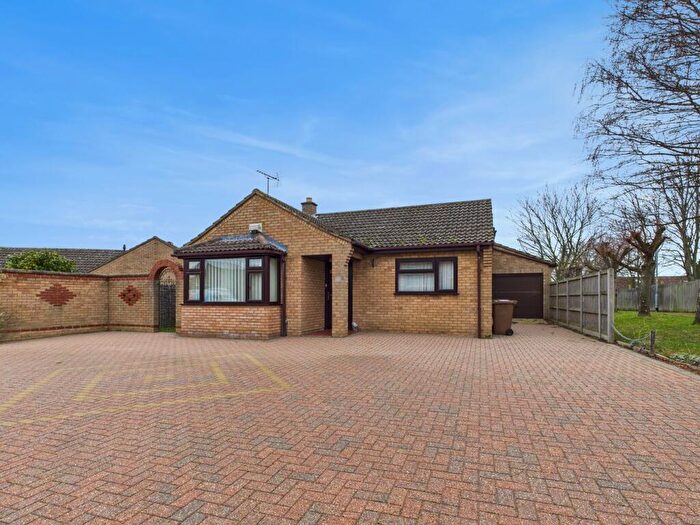
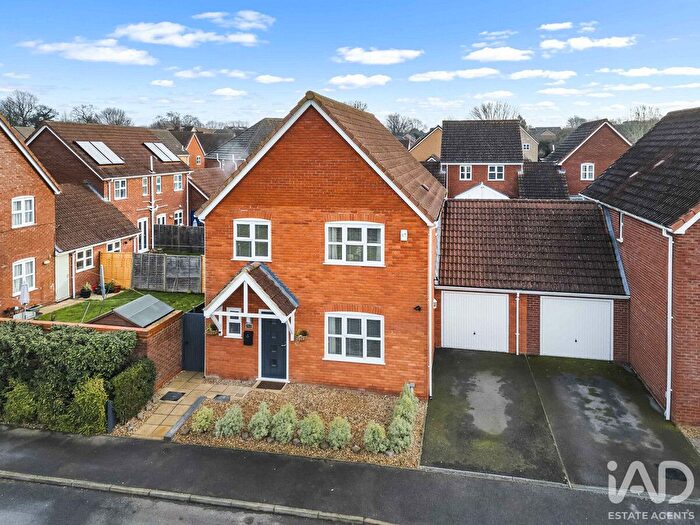
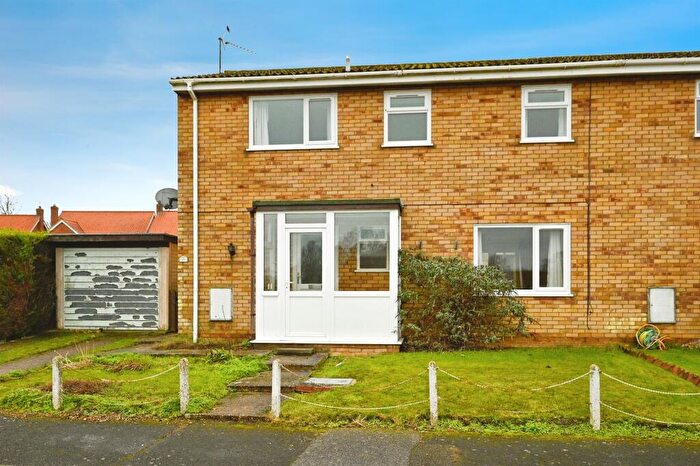
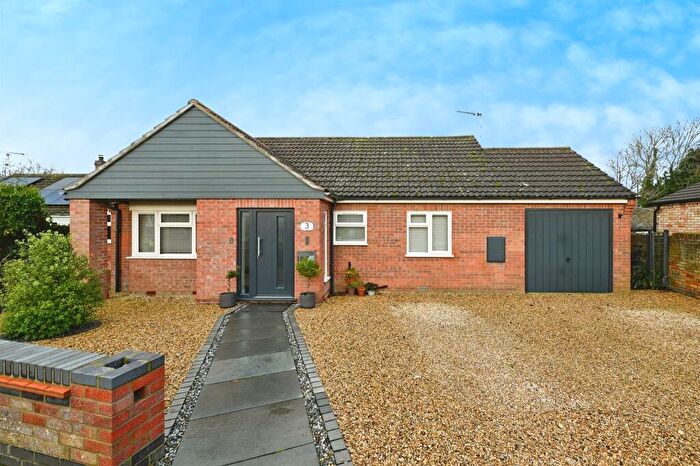
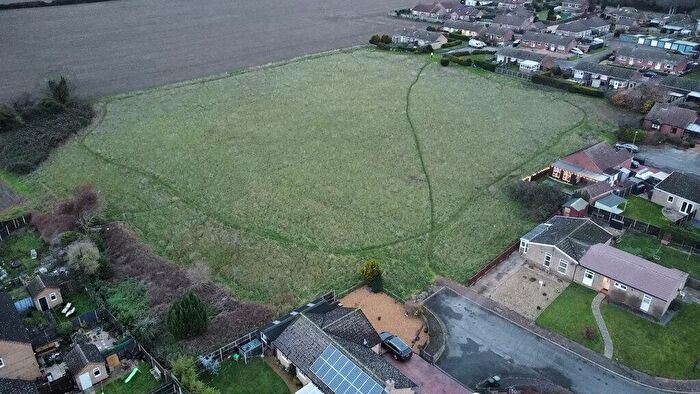
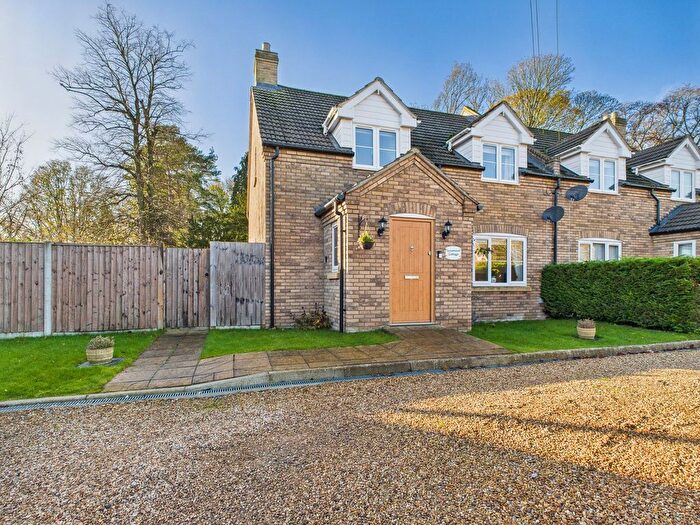
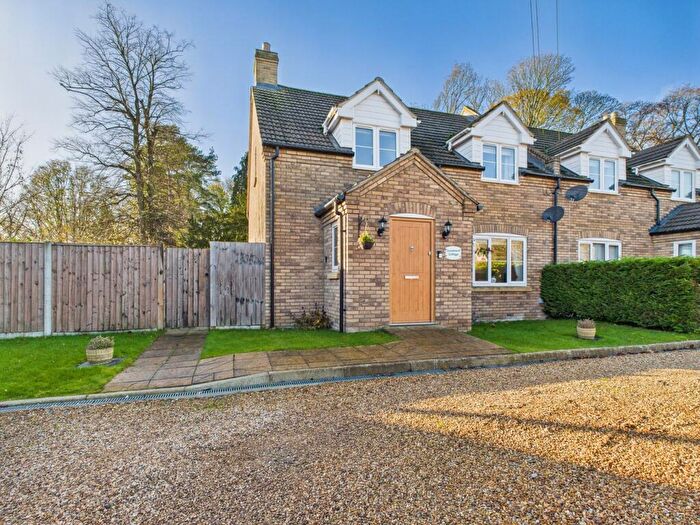
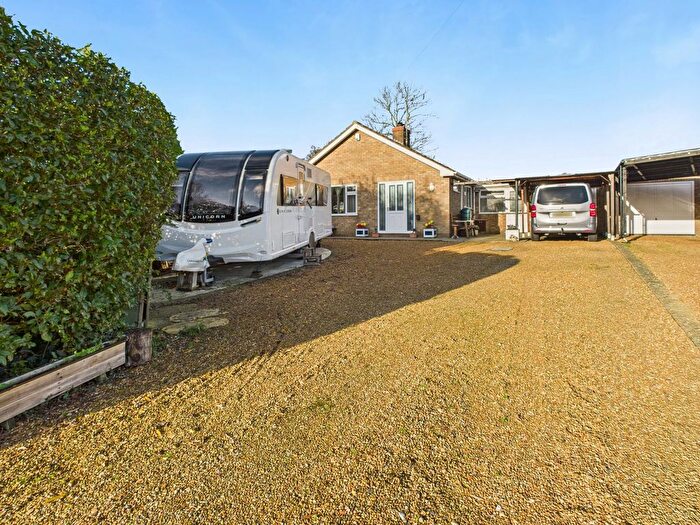
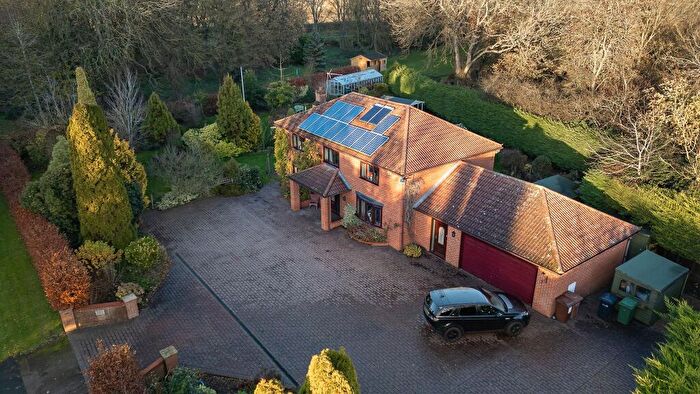
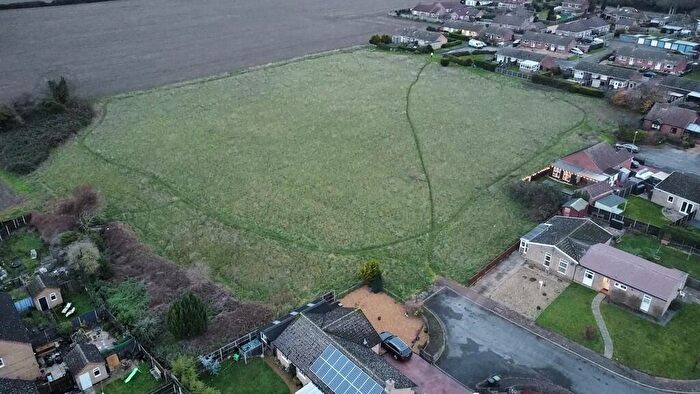
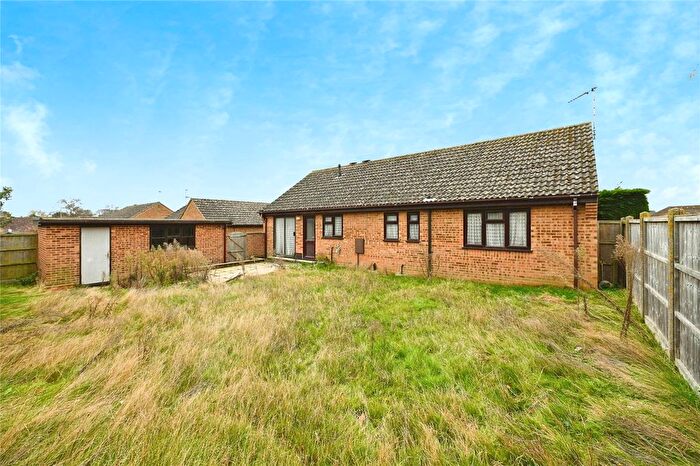
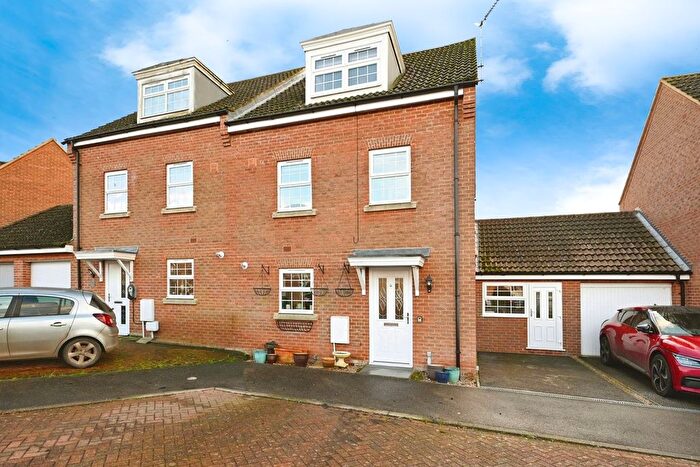
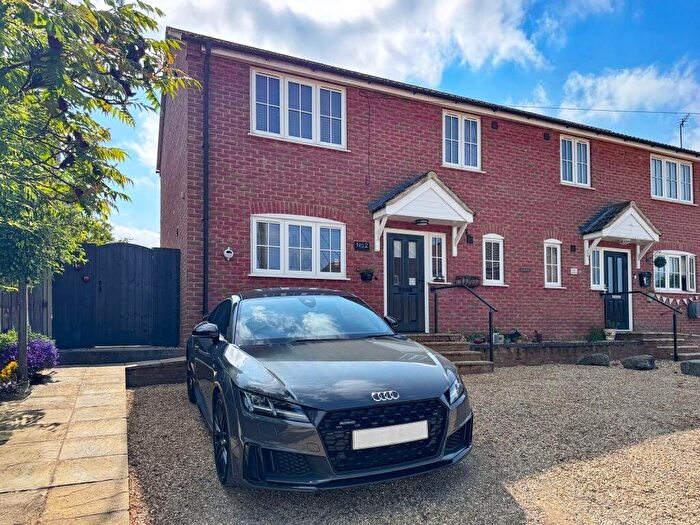
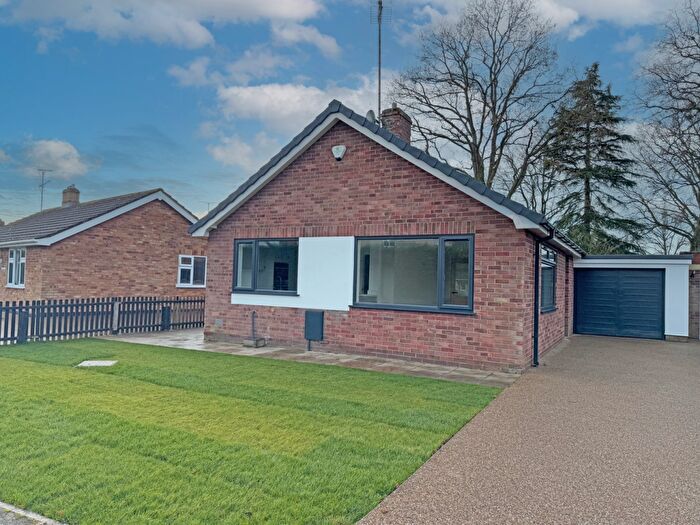
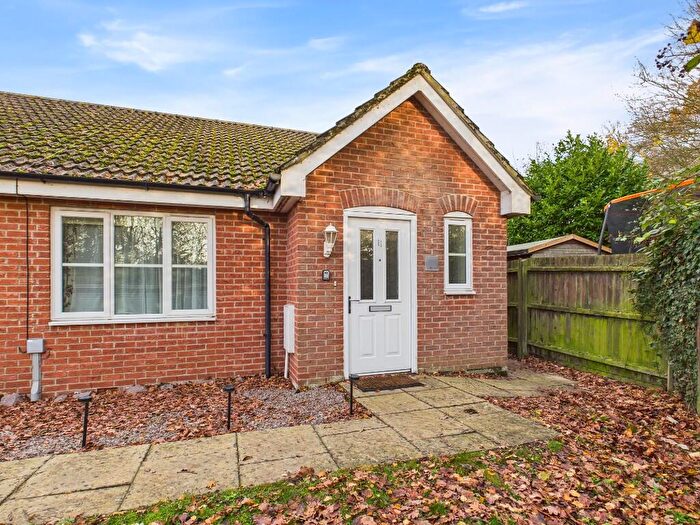
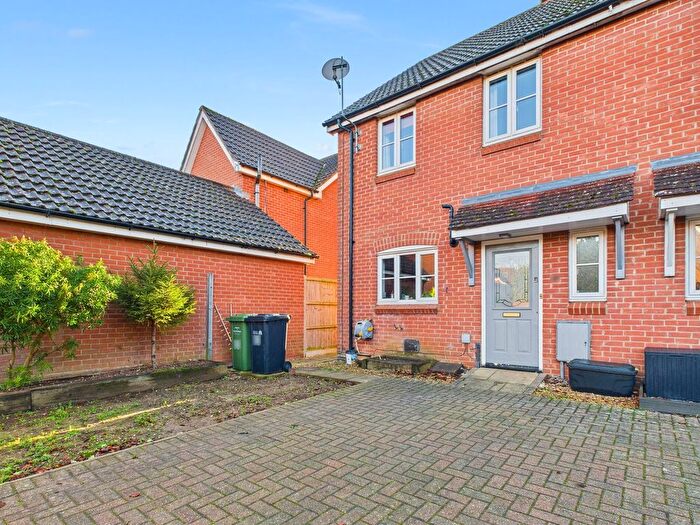
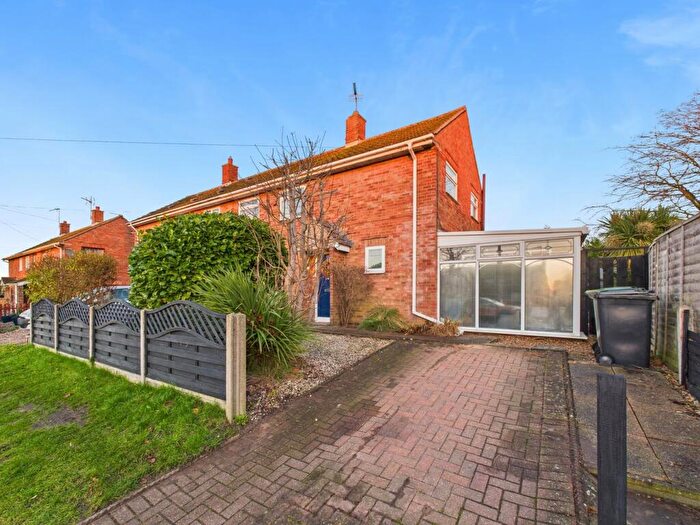
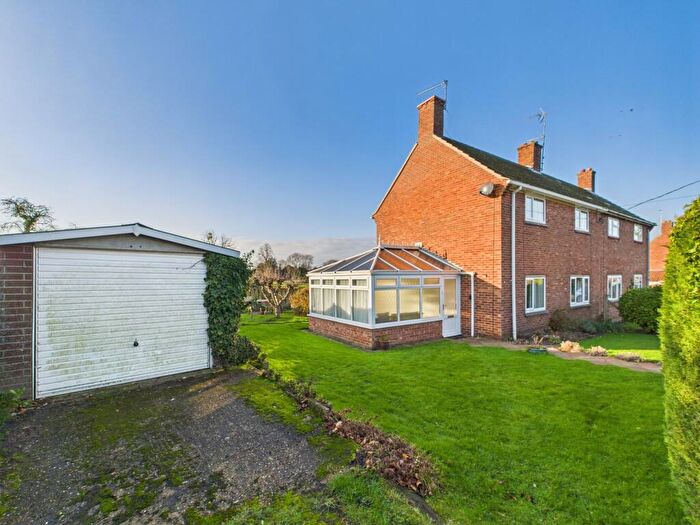
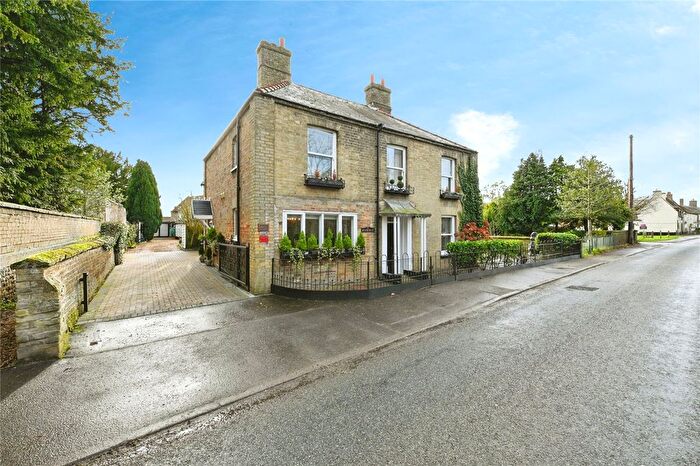
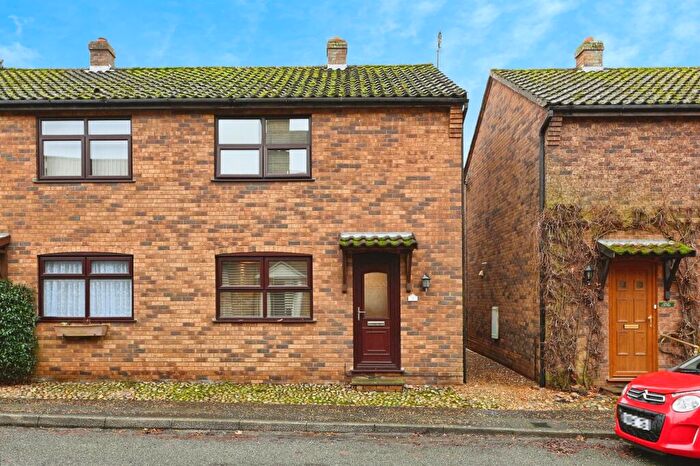
Houses for sale & to rent in Wimbotsham With Fincham, Kings Lynn
House Prices in Wimbotsham With Fincham
Properties in Wimbotsham With Fincham have an average house price of £347,309.00 and had 107 Property Transactions within the last 3 years¹.
Wimbotsham With Fincham is an area in Kings Lynn, Norfolk with 1,039 households², where the most expensive property was sold for £1,650,000.00.
Properties for sale in Wimbotsham With Fincham
Roads and Postcodes in Wimbotsham With Fincham
Navigate through our locations to find the location of your next house in Wimbotsham With Fincham, Kings Lynn for sale or to rent.
| Streets | Postcodes |
|---|---|
| Adelphi Terrace | PE33 9DY |
| Bardolph Place | PE34 3PL |
| Basil Road | PE33 9RP |
| Bath Road | PE33 9TP |
| Bexwell Road | PE38 9GA |
| Black Drove | PE33 9HQ |
| Boughton Long Road | PE33 9DN |
| Boughton Road | PE33 9ER |
| Brooks Lane | PE33 9TU |
| Buttlands Lane | PE33 9DP |
| California | PE33 9EP |
| Chapel Lane | PE33 9DS PE33 9EN PE34 3QH |
| Church Farm Walk | PE33 9UL |
| Church Road | PE33 9GF PE33 9RF PE34 3QG |
| Churchfields | PE33 9EA |
| Churchill Crescent | PE33 9EU |
| Downham Road | PE33 9DU PE33 9HF |
| Eastmoor Road | PE33 9PZ |
| Fincham Road | PE33 9DL PE34 3HX |
| Gullpit Drove | PE34 3PU |
| Hatherley Gardens | PE33 9DR |
| High Street | PE33 9EH PE33 9EJ PE33 9EL PE33 9HD |
| Hilgay Road | PE33 9RN PE33 9RW |
| Hills View | PE33 9UN |
| Holme Road | PE34 3PW |
| Honey Hill | PE34 3QD |
| Lime Kiln Road | PE33 9RT |
| Low Road | PE34 3QQ |
| Lynn Road | PE33 9HE PE34 3HT PE34 3QL |
| Main Road | PE33 9DX PE33 9ET |
| Marham Road | PE33 9ES |
| Market Lane | PE33 9DZ |
| Millers Lane | PE34 3QF |
| Napthans Lane | PE34 3QU |
| Ryston Road | PE33 9RJ PE33 9RQ |
| South Side | PE34 3QA |
| Springfield Close | PE33 9EF |
| St Andrews Close | PE33 9RG |
| Station Road | PE33 9RE PE33 9RR |
| Stokeferry Road | PE33 9QA |
| Stow Bridge Road | PE34 3HZ |
| Stow Corner | PE34 3PS |
| Swaffham Road | PE33 9DH |
| Swan Lane | PE33 9UR |
| The Causeway | PE34 3PH PE34 3PP |
| The Hill | PE33 9EW |
| The Paddocks | PE33 9GG |
| The Row | PE33 9RH |
| Tinkers Lane | PE34 3QE |
| Turners Close | PE34 3QJ |
| West Way | PE34 3PZ PE34 3QB |
| Wimbotsham Road | PE34 3PT |
| PE33 9HH PE33 9HL |
Transport near Wimbotsham With Fincham
- FAQ
- Price Paid By Year
- Property Type Price
Frequently asked questions about Wimbotsham With Fincham
What is the average price for a property for sale in Wimbotsham With Fincham?
The average price for a property for sale in Wimbotsham With Fincham is £347,309. This amount is 14% higher than the average price in Kings Lynn. There are 2,672 property listings for sale in Wimbotsham With Fincham.
What streets have the most expensive properties for sale in Wimbotsham With Fincham?
The streets with the most expensive properties for sale in Wimbotsham With Fincham are Lynn Road at an average of £709,166, Eastmoor Road at an average of £625,000 and Market Lane at an average of £475,000.
What streets have the most affordable properties for sale in Wimbotsham With Fincham?
The streets with the most affordable properties for sale in Wimbotsham With Fincham are Hatherley Gardens at an average of £125,500, Adelphi Terrace at an average of £220,000 and Holme Road at an average of £225,000.
Which train stations are available in or near Wimbotsham With Fincham?
Some of the train stations available in or near Wimbotsham With Fincham are Downham Market, Watlington and King's Lynn.
Property Price Paid in Wimbotsham With Fincham by Year
The average sold property price by year was:
| Year | Average Sold Price | Price Change |
Sold Properties
|
|---|---|---|---|
| 2025 | £298,277 | -36% |
18 Properties |
| 2024 | £404,950 | 24% |
30 Properties |
| 2023 | £308,538 | -14% |
26 Properties |
| 2022 | £352,200 | 11% |
33 Properties |
| 2021 | £312,443 | 3% |
44 Properties |
| 2020 | £303,829 | 24% |
41 Properties |
| 2019 | £229,466 | -10% |
30 Properties |
| 2018 | £252,769 | -3% |
25 Properties |
| 2017 | £260,254 | 7% |
43 Properties |
| 2016 | £242,953 | 6% |
56 Properties |
| 2015 | £229,161 | 0,3% |
46 Properties |
| 2014 | £228,578 | 16% |
46 Properties |
| 2013 | £192,902 | -2% |
38 Properties |
| 2012 | £196,690 | -1% |
26 Properties |
| 2011 | £198,223 | 1% |
38 Properties |
| 2010 | £196,247 | -4% |
24 Properties |
| 2009 | £204,058 | -8% |
29 Properties |
| 2008 | £221,394 | -5% |
49 Properties |
| 2007 | £232,235 | 17% |
46 Properties |
| 2006 | £191,645 | -7% |
45 Properties |
| 2005 | £204,243 | 19% |
36 Properties |
| 2004 | £165,943 | 3% |
45 Properties |
| 2003 | £160,572 | 17% |
47 Properties |
| 2002 | £133,760 | 19% |
54 Properties |
| 2001 | £107,967 | 14% |
43 Properties |
| 2000 | £92,958 | 18% |
39 Properties |
| 1999 | £76,332 | -1% |
55 Properties |
| 1998 | £77,007 | 23% |
54 Properties |
| 1997 | £59,452 | 2% |
42 Properties |
| 1996 | £58,016 | 8% |
49 Properties |
| 1995 | £53,610 | - |
25 Properties |
Property Price per Property Type in Wimbotsham With Fincham
Here you can find historic sold price data in order to help with your property search.
The average Property Paid Price for specific property types in the last three years are:
| Property Type | Average Sold Price | Sold Properties |
|---|---|---|
| Semi Detached House | £228,400.00 | 25 Semi Detached Houses |
| Detached House | £412,628.00 | 67 Detached Houses |
| Terraced House | £253,733.00 | 15 Terraced Houses |

