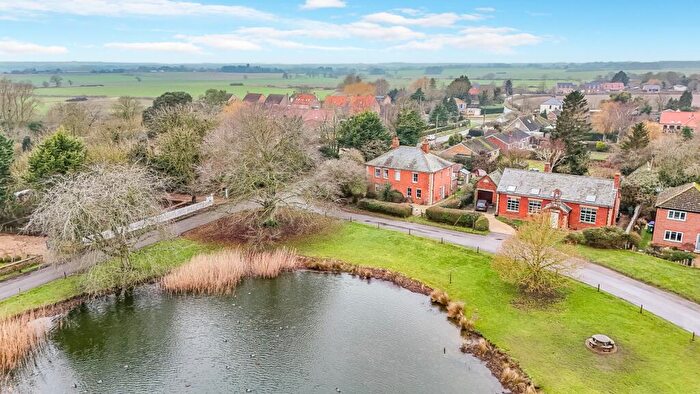
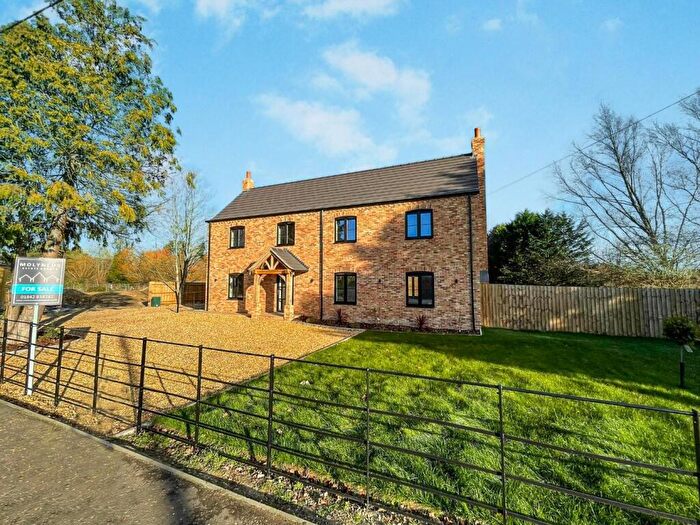
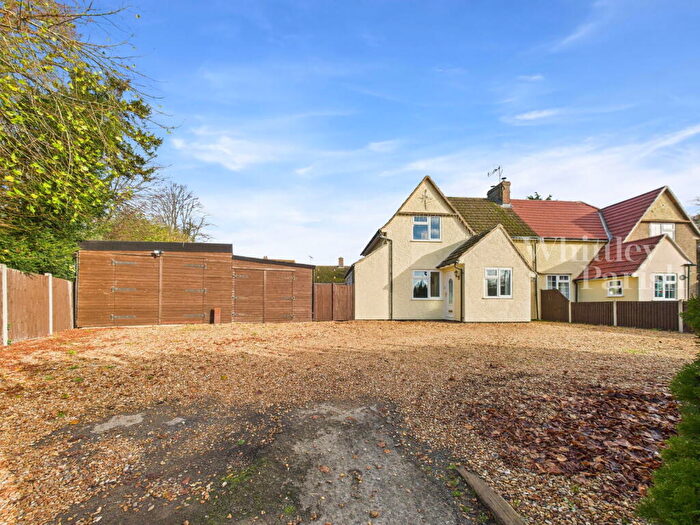
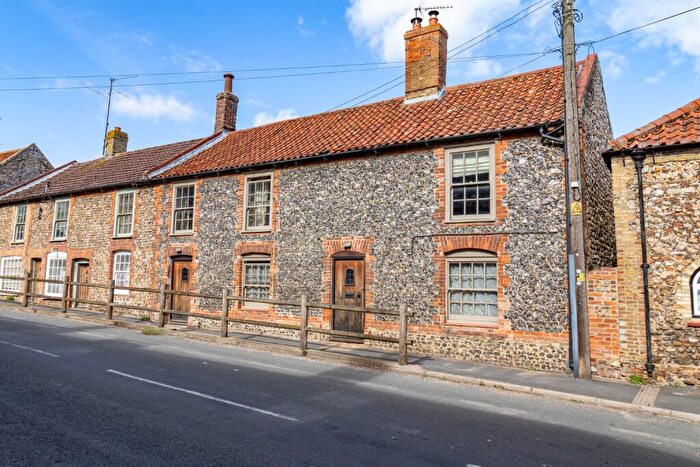
Houses for sale & to rent in Wissey, Kings Lynn
House Prices in Wissey
Properties in Wissey have an average house price of £321,509.00 and had 105 Property Transactions within the last 3 years¹.
Wissey is an area in Kings Lynn, Norfolk with 979 households², where the most expensive property was sold for £930,000.00.
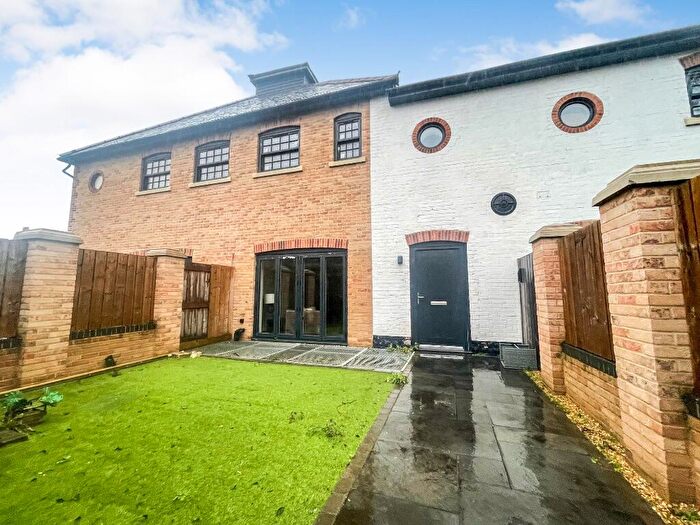
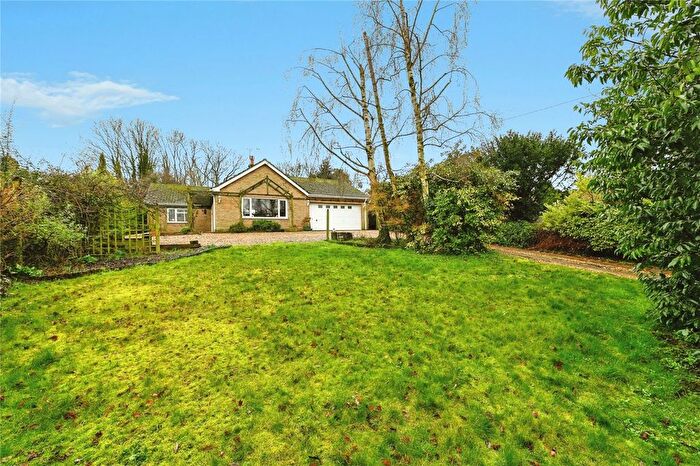
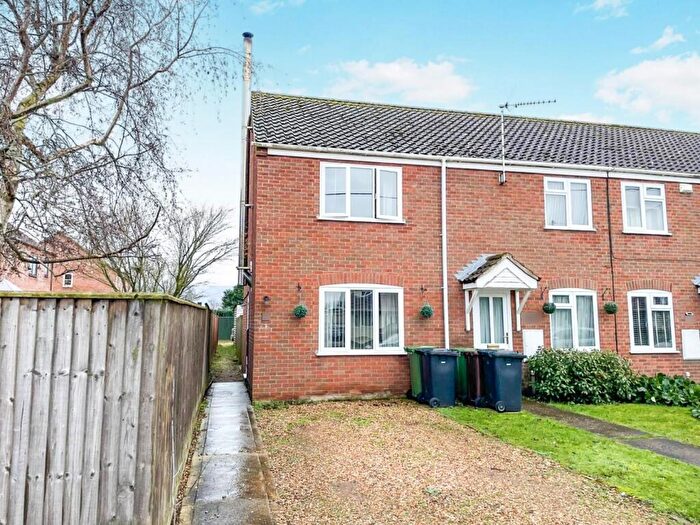
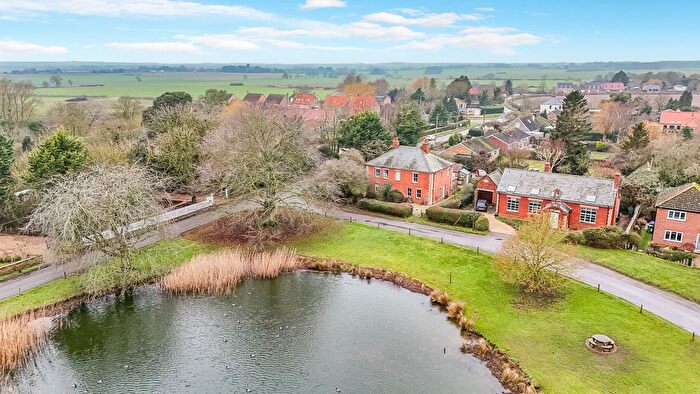
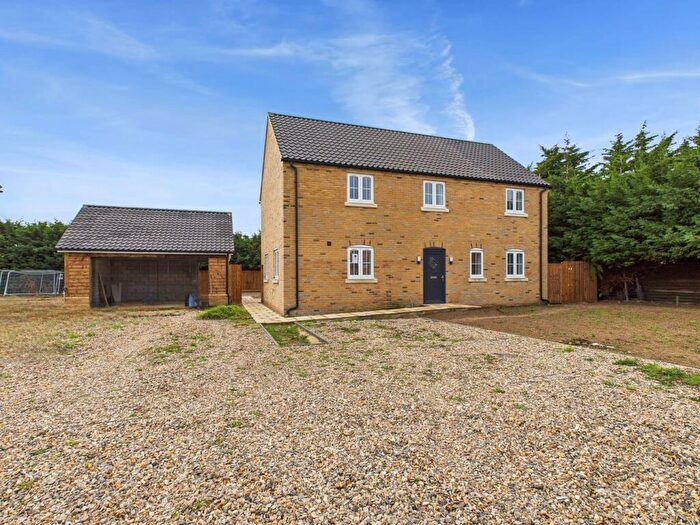
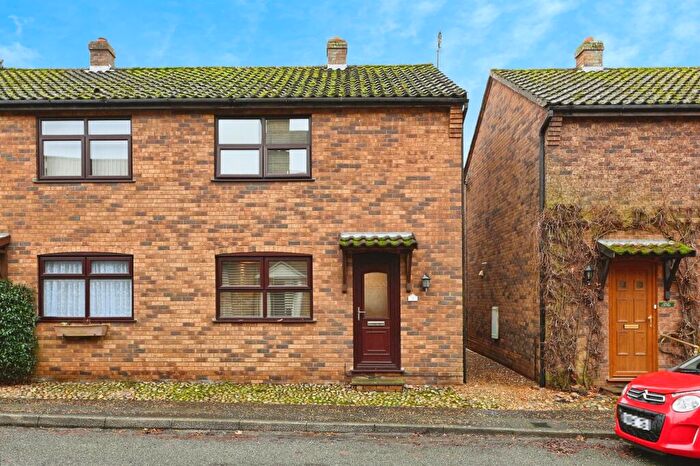
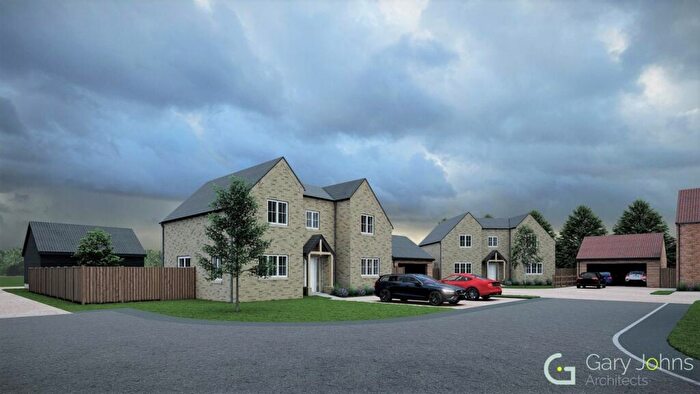
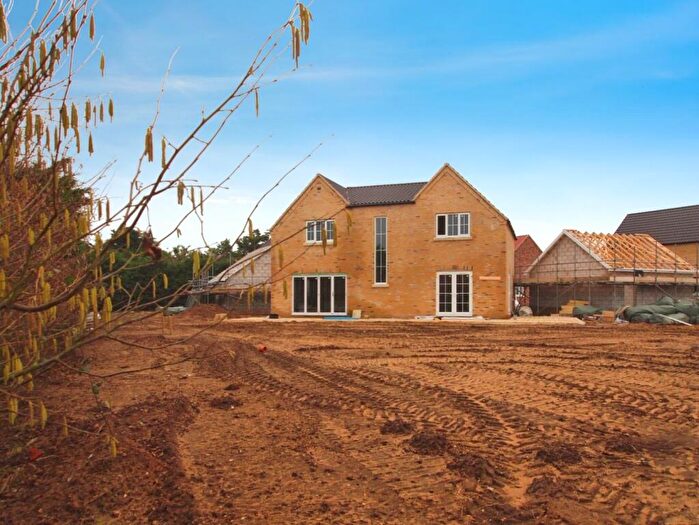
Properties for sale in Wissey
Roads and Postcodes in Wissey
Navigate through our locations to find the location of your next house in Wissey, Kings Lynn for sale or to rent.
| Streets | Postcodes |
|---|---|
| All Saints Place | PE33 9RA |
| Back Lane | PE33 9BB |
| Bens Lane | PE33 9FL |
| Border Road | PE33 9TW |
| Boughton Long Road | PE33 9DW PE33 9EQ |
| Boughton Road | PE33 9ST PE33 9BF |
| Bradfield Place | PE33 9SP |
| Bridge Road | PE33 9TB |
| Buckenham Drive | PE33 9SG |
| Cavenham Road | PE33 9AR |
| Chapel Road | PE33 9AG |
| Chequers Road | PE33 9QS |
| Church Lane | PE33 9AQ PE33 9GH |
| Church Road | PE33 9AP PE33 9QR |
| College Road | PE33 9AZ |
| Cromer Lane | PE33 9QX |
| Crown Gardens | PE33 9BG |
| Fairfield Road | PE33 9SR |
| Farhill Drove | PE33 9QF |
| Fen Drove | PE33 9QP |
| Field Lane | PE33 9QT PE33 9QZ |
| Field View Lane | PE33 9TL |
| Flegg Green | PE33 9BA |
| Furlong Drove | PE33 9SX |
| Furlong Road | PE33 9SU |
| Gibbet Lane | PE33 9AA |
| Great Mans Way | PE33 9SZ |
| High Street | PE33 9SF |
| Indigo Road | PE33 9TJ |
| Jane Forby Close | PE33 9QE |
| Lark Road | PE33 9TY |
| Lime Kiln Lane | PE33 9UA |
| Limehouse Drove | PE33 9QW |
| Little Lane | PE33 9SS |
| Little Mans Way | PE33 9UB |
| Low Road | PE33 9QN |
| Lynn Road | PE33 9BD PE33 9SW |
| Manor House Row | PE33 9DJ |
| Manor Road | PE33 9UG |
| Mill Hill Road | PE33 9AE |
| Nowhere Lane | PE33 9FG |
| Oak Road | PE33 9TX |
| Oxborough Road | PE33 9AH PE33 9SY PE33 9TA PE33 9EG PE33 9PY |
| Queens Close | PE33 9AX |
| River Drove | PE33 9QL |
| School Lane | PE33 9AW |
| Spring Court | PE33 9BQ |
| St Margarets Hill | PE33 9FN |
| Stoke Ferry | PE33 9SE PE33 9TD |
| Stoke Ferry Bypass A134 | PE33 9UF |
| Stoke Road | PE33 9AL PE33 9AT PE33 9QQ |
| Swaffham Road | PE33 9GJ |
| The Green | PE33 9AF |
| The Hollow | PE33 9UU |
| The Moorings | PE33 9UE |
| The Pines | PE33 9XW |
| The Pleasance | PE33 9EE |
| The Row | PE33 9AU PE33 9AY |
| Thompsons Lane | PE33 9SH |
| West Dereham Road | PE33 9RB |
| Winnold Cottages | PE33 9AB |
| Wretton Road | PE33 9AJ PE33 9QJ PE33 9SJ PE33 9SL PE33 9SN PE33 9SQ |
| Wretton Row | PE33 9BH PE33 9QU |
| PE33 9AN PE33 9AD PE33 9QY |
Transport near Wissey
- FAQ
- Price Paid By Year
- Property Type Price
Frequently asked questions about Wissey
What is the average price for a property for sale in Wissey?
The average price for a property for sale in Wissey is £321,509. This amount is 8% higher than the average price in Kings Lynn. There are 551 property listings for sale in Wissey.
What streets have the most expensive properties for sale in Wissey?
The streets with the most expensive properties for sale in Wissey are Mill Hill Road at an average of £930,000, The Green at an average of £675,000 and Field Lane at an average of £675,000.
What streets have the most affordable properties for sale in Wissey?
The streets with the most affordable properties for sale in Wissey are All Saints Place at an average of £132,500, The Moorings at an average of £149,500 and Bradfield Place at an average of £185,000.
Which train stations are available in or near Wissey?
Some of the train stations available in or near Wissey are Downham Market, Watlington and Lakenheath.
Property Price Paid in Wissey by Year
The average sold property price by year was:
| Year | Average Sold Price | Price Change |
Sold Properties
|
|---|---|---|---|
| 2025 | £349,908 | 19% |
41 Properties |
| 2024 | £283,314 | -14% |
31 Properties |
| 2023 | £322,106 | -18% |
33 Properties |
| 2022 | £380,997 | 9% |
43 Properties |
| 2021 | £346,873 | 19% |
50 Properties |
| 2020 | £282,405 | 3% |
37 Properties |
| 2019 | £272,813 | -5% |
41 Properties |
| 2018 | £285,966 | 1% |
59 Properties |
| 2017 | £283,124 | 6% |
42 Properties |
| 2016 | £266,884 | 16% |
52 Properties |
| 2015 | £225,200 | 3% |
48 Properties |
| 2014 | £219,125 | 11% |
36 Properties |
| 2013 | £195,224 | 3% |
40 Properties |
| 2012 | £188,507 | 11% |
30 Properties |
| 2011 | £167,767 | -31% |
28 Properties |
| 2010 | £220,239 | 28% |
25 Properties |
| 2009 | £158,938 | -18% |
26 Properties |
| 2008 | £188,278 | -6% |
33 Properties |
| 2007 | £199,091 | 1% |
49 Properties |
| 2006 | £197,545 | 25% |
50 Properties |
| 2005 | £147,765 | -13% |
38 Properties |
| 2004 | £166,377 | 20% |
61 Properties |
| 2003 | £133,377 | 4% |
45 Properties |
| 2002 | £128,602 | 29% |
72 Properties |
| 2001 | £91,924 | 7% |
68 Properties |
| 2000 | £85,245 | 23% |
68 Properties |
| 1999 | £65,939 | -11% |
68 Properties |
| 1998 | £73,510 | 21% |
51 Properties |
| 1997 | £58,340 | -8% |
54 Properties |
| 1996 | £63,216 | 28% |
36 Properties |
| 1995 | £45,825 | - |
37 Properties |
Property Price per Property Type in Wissey
Here you can find historic sold price data in order to help with your property search.
The average Property Paid Price for specific property types in the last three years are:
| Property Type | Average Sold Price | Sold Properties |
|---|---|---|
| Semi Detached House | £232,880.00 | 21 Semi Detached Houses |
| Detached House | £390,979.00 | 62 Detached Houses |
| Terraced House | £219,462.00 | 20 Terraced Houses |
| Flat | £119,000.00 | 2 Flats |

