
Houses for sale & to rent in Easton, Norwich
House Prices in Easton
Properties in Easton have an average house price of £355k and had 98 Property Transactions within the last 3 years¹.
Easton is an area in Norwich, Norfolk with 1,032 households², where the most expensive property was sold for £1.83M.
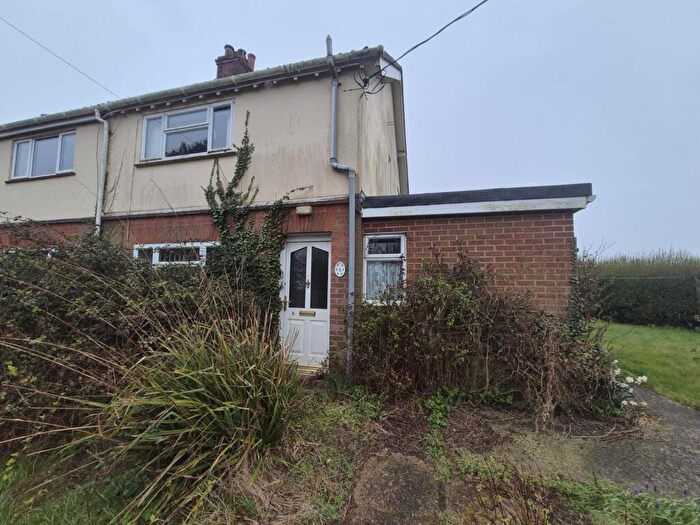
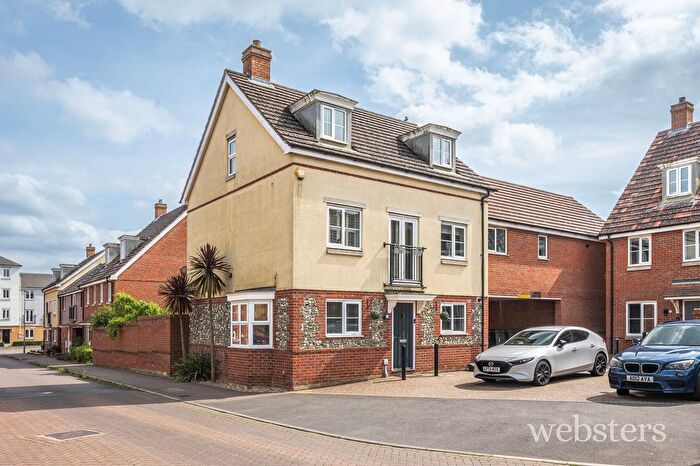
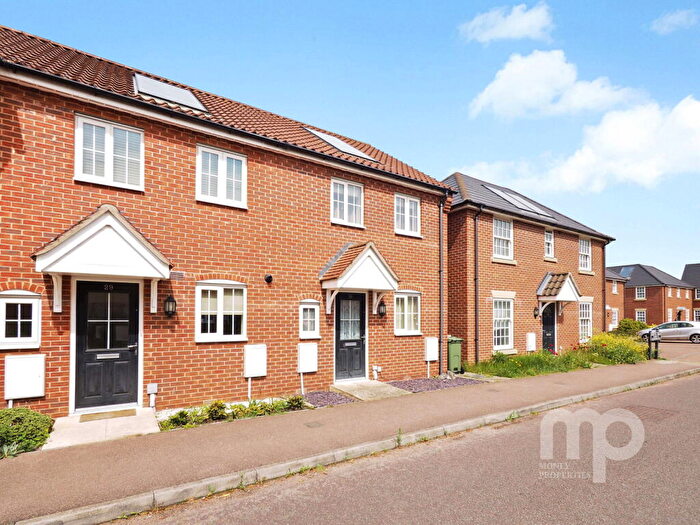
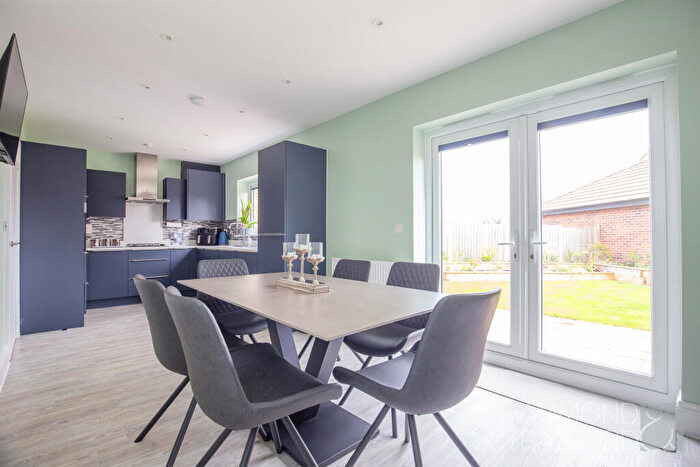
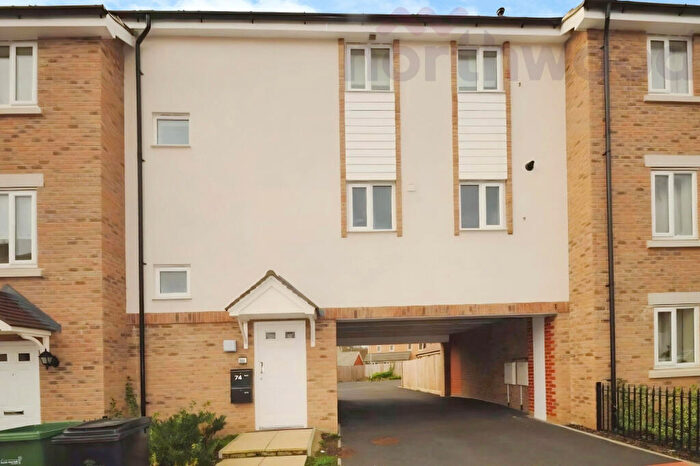
Properties for sale in Easton
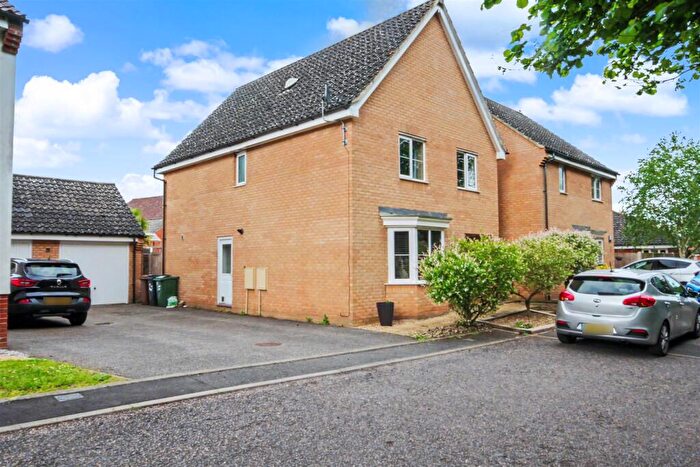
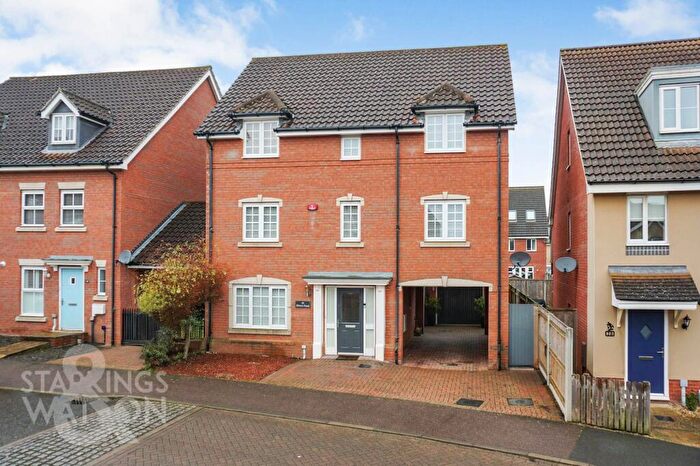
![]()
If you are looking to sell your house, let it out, or receive a property valuation, an expert can help you.
Click the button below to get started.

Roads and Postcodes in Easton
Navigate through our locations to find the location of your next house in Easton, Norwich for sale or to rent.
| Streets | Postcodes |
|---|---|
| Back Lane | NR9 4AT |
| Barford Road | NR9 5DA NR9 5HU |
| Bawburgh Road | NR9 5AG NR9 5ED NR9 5EF NR9 5EA NR9 5HX |
| Bayfield Close | NR9 4BN |
| Bluebell Way | NR9 5FH |
| Bow Hill | NR9 5HN |
| Broom Lane | NR9 5DT |
| Burdock Lane | NR9 3BN NR9 4BL |
| Buxton Close | NR9 5DW |
| Cardinal Close | NR9 5EW |
| Chapel Street | NR9 4AB NR9 4BJ |
| Church Lane | NR9 4AY NR9 5DE |
| Church Road | NR9 4AU NR9 5HP |
| Clarkes Close | NR9 4BB |
| Cock Street | NR9 4BD |
| Colton Road | NR9 5HS NR9 5HR |
| Daffodil Place | NR9 5FJ |
| Dereham Road | NR9 5DF NR9 5EG NR9 5EH NR9 5EJ NR9 5ES |
| Dusty Miller Drive | NR9 5FP |
| Eastleigh Gardens | NR9 4BW |
| Easton Road | NR9 5HJ NR9 5HY |
| Eddington Way | NR9 5FD |
| Fennel Drive | NR9 5FL |
| Garnett Drive | NR9 5FB |
| Golden Pightle | NR9 4AX |
| Hall Road | NR9 5EB NR9 3BJ NR9 5DS |
| High Green | NR9 3BQ |
| High House Farm Lane | NR9 5DG |
| John Howes Close | NR9 5DP |
| Kennedy Close | NR9 5EY NR9 5EZ |
| Ladys Mantle Way | NR9 5FN |
| Landlow Lane | NR9 3BL |
| Lodge Road | NR9 5EL |
| Low Road | NR9 5EN |
| Marlingford Road | NR9 5AD NR9 5DR NR9 5DD NR9 5DN |
| Marlingford Way | NR9 5HA NR9 5HB |
| Melton Road | NR9 3BT |
| Mill Road | NR9 5HL NR9 5HW |
| New Road | NR9 3HL |
| Norwich Road | NR9 4BQ NR9 5BX NR9 5BY NR9 5BZ |
| Oakwood Close | NR9 5EX |
| Park Avenue | NR9 4BA |
| Park Close | NR9 4GA |
| Parkers Close | NR9 5EE |
| Peacock Close | NR9 5JD |
| Pegg Close | NR9 5JB |
| Pockthorpe Road | NR9 3BP NR9 3BS NR9 3BW |
| Ringland Lane | NR9 5DL |
| Ringland Road | NR9 5EP NR9 5ER |
| St Peters Drive | NR9 5HF |
| Stearn Close | NR9 5FE |
| Style Loke | NR9 4BE |
| The Croft | NR9 3BG |
| The Street | NR9 5AB NR9 5DB |
| Watton Road | NR9 4AR NR9 4AS |
| Wheeler Crescent | NR9 5FF |
| Woodcocks Lane | NR9 3BY |
| Woodview Road | NR9 5EU |
| NR9 3BE NR9 3BH NR9 3BU NR9 3BX NR9 5DU NR9 5JA |
Transport near Easton

- FAQ
- Price Paid By Year
- Property Type Price
Frequently asked questions about Easton
What is the average price for a property for sale in Easton?
The average price for a property for sale in Easton is £355,346. This amount is 15% higher than the average price in Norwich. There are 1,686 property listings for sale in Easton.
What streets have the most expensive properties for sale in Easton?
The streets with the most expensive properties for sale in Easton are Church Lane at an average of £1,000,625, Barford Road at an average of £795,000 and Burdock Lane at an average of £553,750.
What streets have the most affordable properties for sale in Easton?
The streets with the most affordable properties for sale in Easton are Wheeler Crescent at an average of £199,850, Church Road at an average of £208,000 and Clarkes Close at an average of £215,000.
Which train stations are available in or near Easton?
Some of the train stations available in or near Easton are Wymondham, Norwich and Spooner Row.
Property Price Paid in Easton by Year
The average sold property price by year was:
| Year | Average Sold Price | Price Change |
Sold Properties
|
|---|---|---|---|
| 2026 | £320,750 | 4% |
4 Properties |
| 2025 | £306,923 | -29% |
26 Properties |
| 2024 | £397,090 | 19% |
49 Properties |
| 2023 | £321,236 | -9% |
19 Properties |
| 2022 | £349,196 | 5% |
54 Properties |
| 2021 | £331,042 | 7% |
53 Properties |
| 2020 | £307,260 | -1% |
39 Properties |
| 2019 | £310,079 | 13% |
32 Properties |
| 2018 | £270,892 | -9% |
35 Properties |
| 2017 | £295,931 | 2% |
43 Properties |
| 2016 | £288,632 | 18% |
34 Properties |
| 2015 | £237,840 | -20% |
25 Properties |
| 2014 | £285,030 | 11% |
33 Properties |
| 2013 | £255,078 | 12% |
35 Properties |
| 2012 | £224,856 | 12% |
30 Properties |
| 2011 | £197,405 | -11% |
19 Properties |
| 2010 | £218,930 | 9% |
23 Properties |
| 2009 | £200,163 | -17% |
26 Properties |
| 2008 | £235,116 | 3% |
43 Properties |
| 2007 | £228,871 | 5% |
77 Properties |
| 2006 | £217,824 | 11% |
81 Properties |
| 2005 | £193,386 | 6% |
49 Properties |
| 2004 | £181,199 | 8% |
53 Properties |
| 2003 | £167,327 | 7% |
36 Properties |
| 2002 | £155,604 | 22% |
45 Properties |
| 2001 | £120,915 | 6% |
78 Properties |
| 2000 | £113,244 | 22% |
52 Properties |
| 1999 | £88,866 | 8% |
81 Properties |
| 1998 | £81,548 | 18% |
32 Properties |
| 1997 | £67,085 | 1% |
25 Properties |
| 1996 | £66,310 | 4% |
28 Properties |
| 1995 | £63,796 | - |
29 Properties |
Property Price per Property Type in Easton
Here you can find historic sold price data in order to help with your property search.
The average Property Paid Price for specific property types in the last three years are:
| Property Type | Average Sold Price | Sold Properties |
|---|---|---|
| Semi Detached House | £258,830.00 | 30 Semi Detached Houses |
| Detached House | £421,855.00 | 60 Detached Houses |
| Terraced House | £218,468.00 | 8 Terraced Houses |