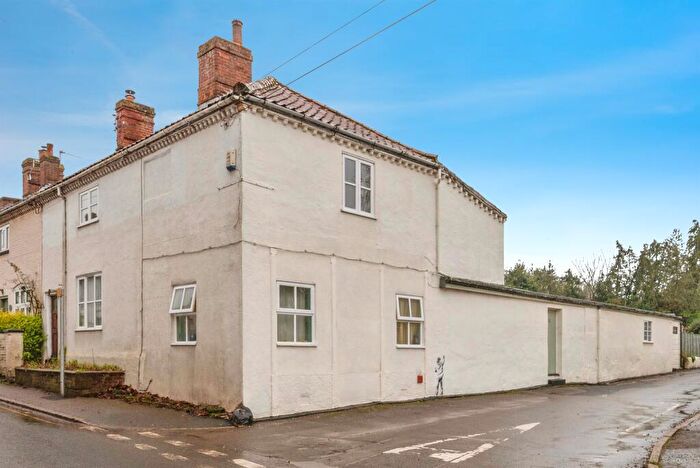
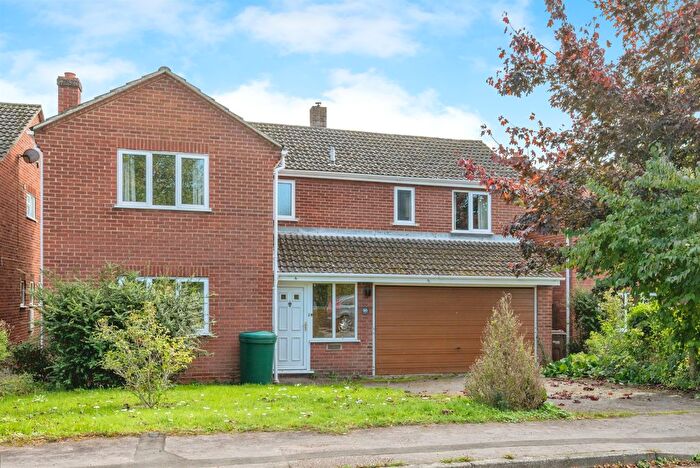
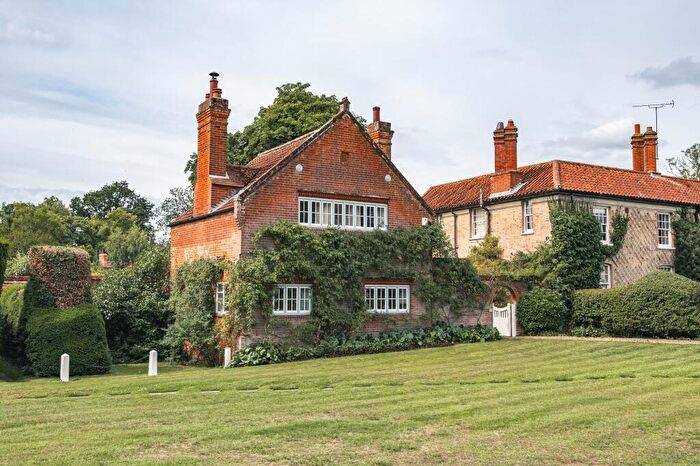
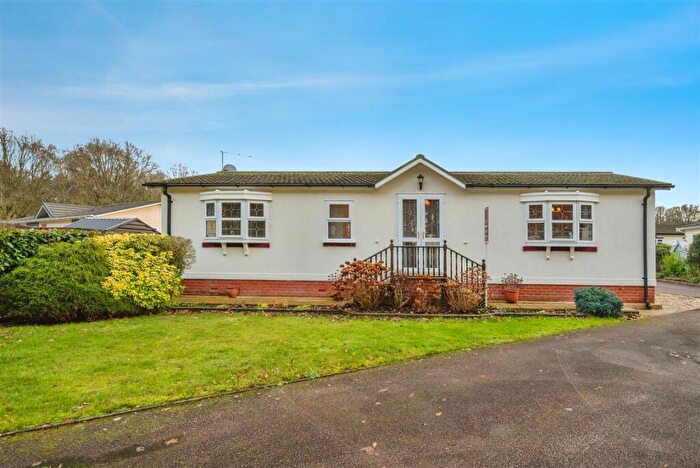
Houses for sale & to rent in Eynesford, Norwich
House Prices in Eynesford
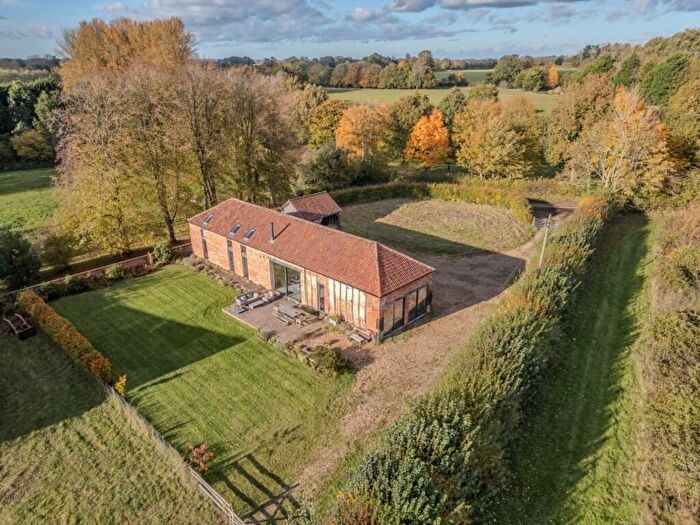
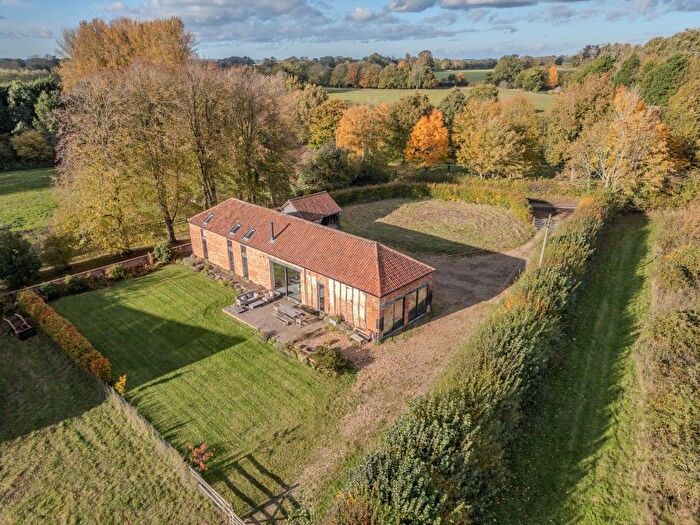
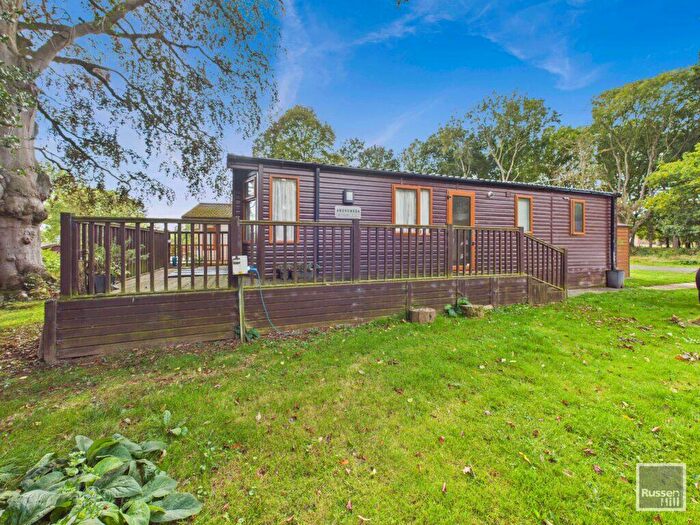
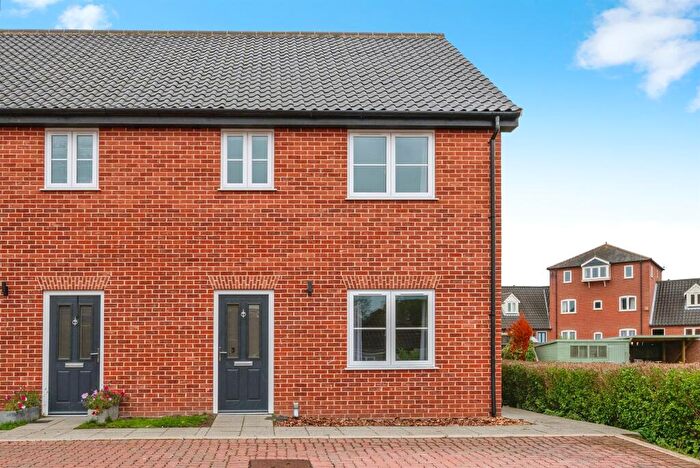
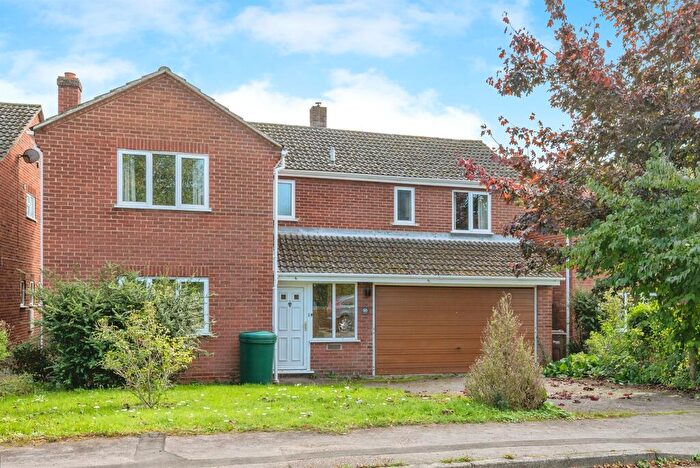
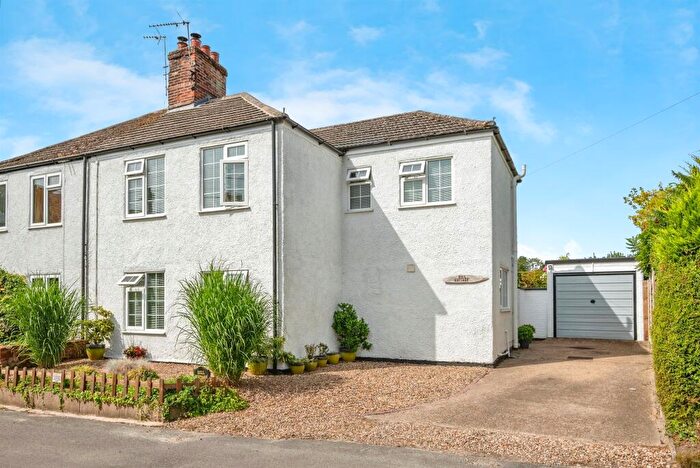
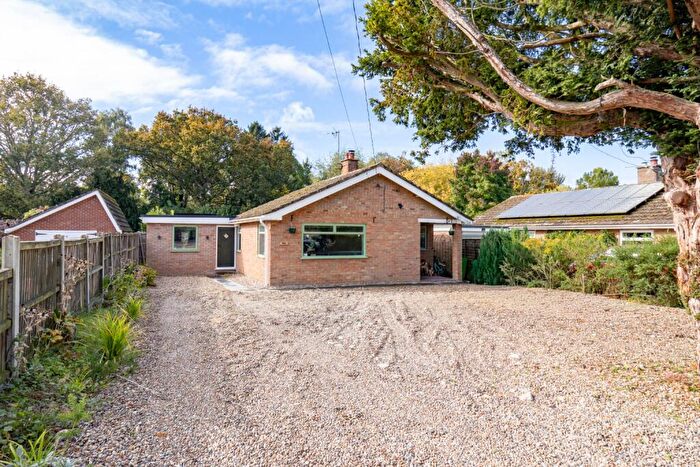
Properties in Eynesford have an average house price of £377,168.00 and had 62 Property Transactions within the last 3 years¹.
Eynesford is an area in Norwich, Norfolk with 863 households², where the most expensive property was sold for £1,500,000.00.
Properties for sale in Eynesford
Roads and Postcodes in Eynesford
Navigate through our locations to find the location of your next house in Eynesford, Norwich for sale or to rent.
| Streets | Postcodes |
|---|---|
| Ames Court | NR10 4QD |
| Aylsham Road | NR10 4AR NR10 4AX NR10 4AY NR10 4BA NR10 4HR NR10 4JD NR10 4AT |
| Back Lane | NR10 4AW NR10 4BP NR10 4HL |
| Birds Lane | NR10 4JA |
| Booton Road | NR10 4AH |
| Brandiston Road | NR10 4ET NR10 4ES |
| Buxton Road | NR10 4HN NR10 5QJ NR10 4HW |
| Cawston Road | NR10 4EW |
| Chapel Street | NR10 4BG |
| Church Lane | NR10 4AJ NR11 6SH NR11 6SJ NR11 6SQ |
| Clifford Pye Close | NR10 4BL |
| Commonside | NR10 4EP |
| Corpusty Road | NR11 6SD |
| Crabgate Lane North | NR11 6SB |
| Crabgate Lane South | NR11 6SW |
| Craft Lane | NR10 4HE |
| Crow Hall Lane | NR10 4TA |
| Crow Hill | NR11 6SE |
| Docking Farm Cottages | NR11 6QZ |
| Easton Way | NR10 4HF |
| Fairfields | NR10 4AS |
| Falgate | NR10 4HG |
| Fred Tuddenham Drive | NR10 4FD |
| Gayford Road | NR10 4AU |
| Glebe Crescent | NR10 4BD |
| Guestwick Lane | NR11 6SL |
| Guestwick Road | NR11 6SF |
| Hall Road | NR11 6SR |
| Heydon Lane | NR11 6RP |
| Heydon Road | NR10 4BE |
| High Street | NR10 4AA NR10 4AE NR10 4AG NR10 4BW |
| Holly Lane | NR11 6SP |
| Holt Road | NR10 4HP NR10 4HS NR11 6RD NR10 4HT NR10 4HU |
| Howards Way | NR10 4AZ |
| Jubilee Close | NR10 4AF |
| Marshall Howard Close | NR10 4TB |
| Marshams Court | NR10 4FF |
| Nettleship Farm Cottages | NR10 4JB |
| New Street | NR10 4AL NR10 4AN NR10 4BN |
| Norwich Road | NR10 4AP NR10 4ER NR10 4EU NR10 4EX NR10 4EY |
| Old Friendship Lane | NR10 4HQ |
| Old Station Yard | NR10 4BB |
| Old Winery Business Park | NR10 4FE |
| Paul Engelhard Way | NR10 4FB |
| Perrys Lane | NR10 4HJ |
| Red Pits | NR11 6RS |
| Reepham Road | NR10 4PL |
| Rodwell Corner | NR10 4HD |
| Southgate | NR10 4HY NR10 4HZ |
| Spinks Lane | NR11 6RF |
| Stocks Loke | NR10 4BS |
| The Green | NR11 6RG |
| The Street | NR10 4SD NR11 6RQ |
| William Bush Close | NR10 4AQ |
| Wood Dalling Road | NR11 6SG |
| NR10 4HX NR10 4SB NR10 4SF NR11 6AQ NR11 6RJ NR11 6RN NR11 6RT NR11 6RW NR11 6SN NR10 4HB NR10 4HH NR10 4SE NR10 4SG NR11 6AD NR11 6QY NR11 6RA NR11 6RB NR11 6RE NR11 6RH NR11 6RL NR11 6RX NR11 6RZ NR11 6SA |
Transport near Eynesford
-
North Walsham Station
-
Gunton Station
-
Worstead Station
-
Roughton Road Station
-
Sheringham Station
-
West Runton Station
-
Hoveton and Wroxham Station
-
Cromer Station
-
Salhouse Station
-
Norwich Station
- FAQ
- Price Paid By Year
- Property Type Price
Frequently asked questions about Eynesford
What is the average price for a property for sale in Eynesford?
The average price for a property for sale in Eynesford is £377,168. This amount is 23% higher than the average price in Norwich. There are 515 property listings for sale in Eynesford.
What streets have the most expensive properties for sale in Eynesford?
The streets with the most expensive properties for sale in Eynesford are Perrys Lane at an average of £860,000, Crabgate Lane South at an average of £803,500 and Holt Road at an average of £666,500.
What streets have the most affordable properties for sale in Eynesford?
The streets with the most affordable properties for sale in Eynesford are Aylsham Road at an average of £208,500, Booton Road at an average of £235,110 and Fairfields at an average of £235,666.
Which train stations are available in or near Eynesford?
Some of the train stations available in or near Eynesford are North Walsham, Gunton and Worstead.
Property Price Paid in Eynesford by Year
The average sold property price by year was:
| Year | Average Sold Price | Price Change |
Sold Properties
|
|---|---|---|---|
| 2025 | £351,857 | -14% |
14 Properties |
| 2024 | £400,860 | 10% |
29 Properties |
| 2023 | £359,657 | -19% |
19 Properties |
| 2022 | £428,221 | 6% |
19 Properties |
| 2021 | £400,702 | 31% |
22 Properties |
| 2020 | £278,142 | -12% |
21 Properties |
| 2019 | £311,460 | 1% |
32 Properties |
| 2018 | £307,375 | 0,2% |
28 Properties |
| 2017 | £306,813 | 12% |
24 Properties |
| 2016 | £271,478 | 20% |
23 Properties |
| 2015 | £216,175 | -7% |
16 Properties |
| 2014 | £230,444 | 4% |
25 Properties |
| 2013 | £221,354 | -14% |
21 Properties |
| 2012 | £252,574 | 16% |
27 Properties |
| 2011 | £212,938 | -1% |
18 Properties |
| 2010 | £216,031 | 6% |
35 Properties |
| 2009 | £203,868 | 24% |
23 Properties |
| 2008 | £154,866 | -51% |
15 Properties |
| 2007 | £234,033 | -6% |
39 Properties |
| 2006 | £248,050 | 19% |
36 Properties |
| 2005 | £200,090 | 18% |
26 Properties |
| 2004 | £164,277 | 4% |
36 Properties |
| 2003 | £157,728 | 21% |
23 Properties |
| 2002 | £125,074 | 16% |
44 Properties |
| 2001 | £105,336 | 18% |
58 Properties |
| 2000 | £86,270 | 13% |
24 Properties |
| 1999 | £75,099 | 5% |
44 Properties |
| 1998 | £70,998 | 25% |
29 Properties |
| 1997 | £53,586 | -14% |
32 Properties |
| 1996 | £61,112 | -29% |
20 Properties |
| 1995 | £78,843 | - |
15 Properties |
Property Price per Property Type in Eynesford
Here you can find historic sold price data in order to help with your property search.
The average Property Paid Price for specific property types in the last three years are:
| Property Type | Average Sold Price | Sold Properties |
|---|---|---|
| Semi Detached House | £248,883.00 | 21 Semi Detached Houses |
| Detached House | £491,867.00 | 31 Detached Houses |
| Terraced House | £278,333.00 | 9 Terraced Houses |
| Flat | £405,000.00 | 1 Flat |

