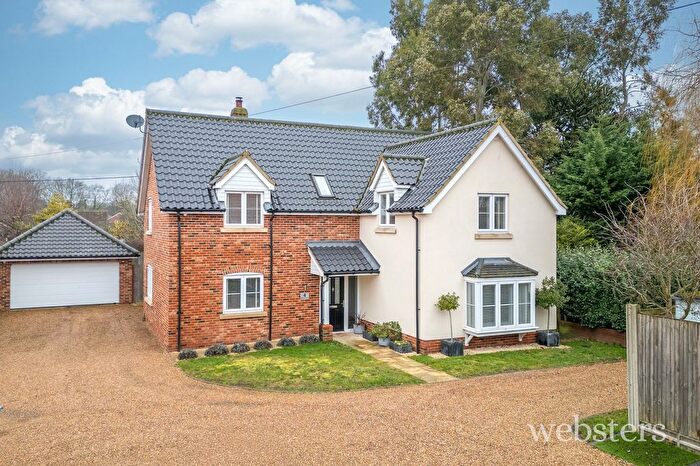
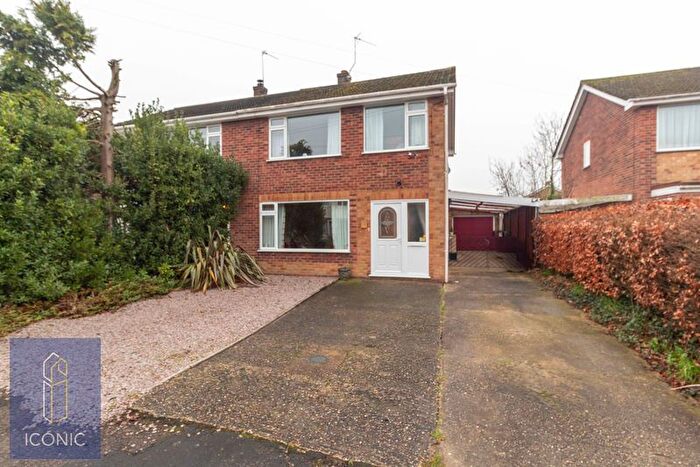
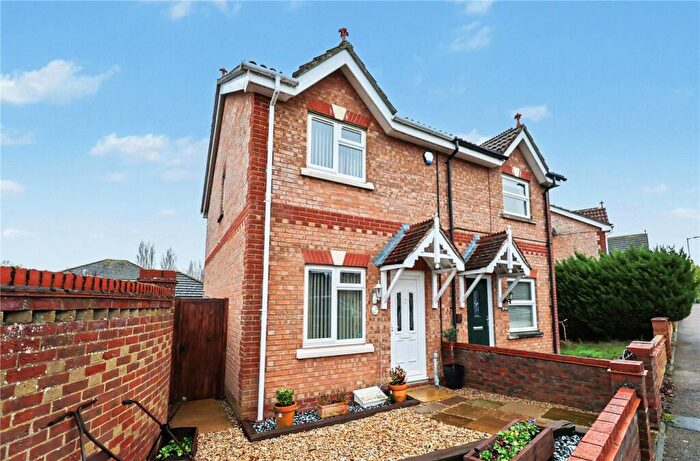
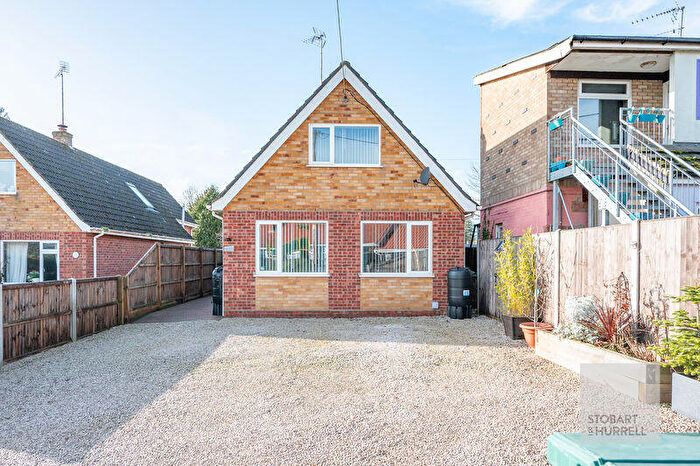
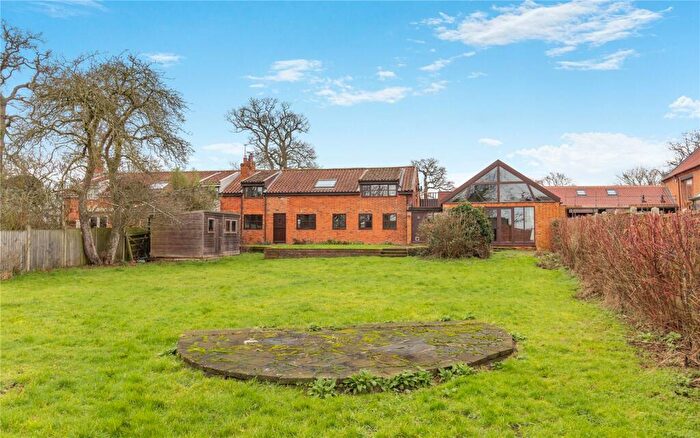
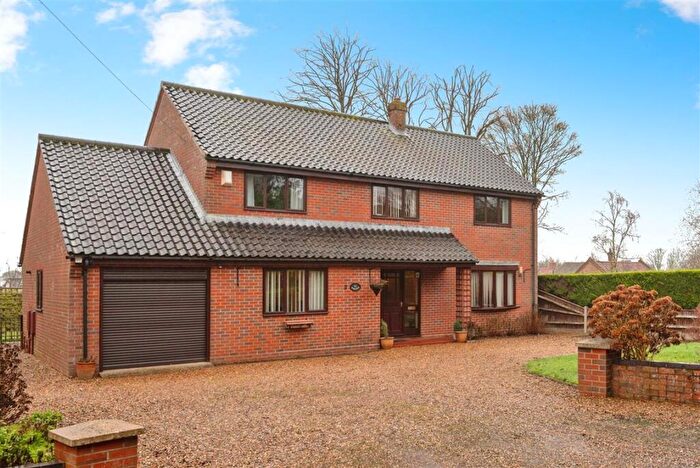
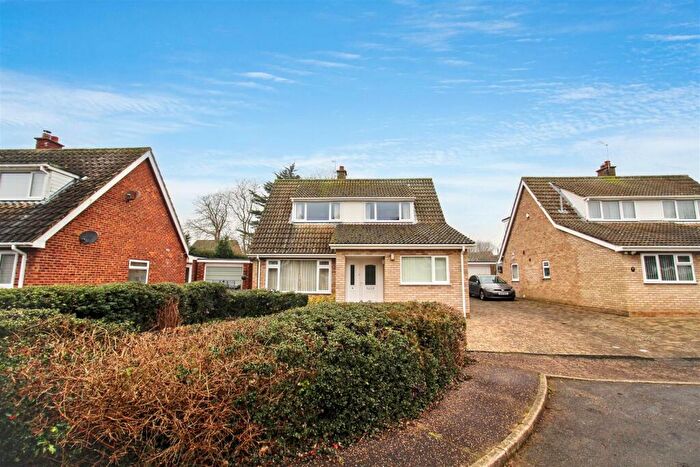
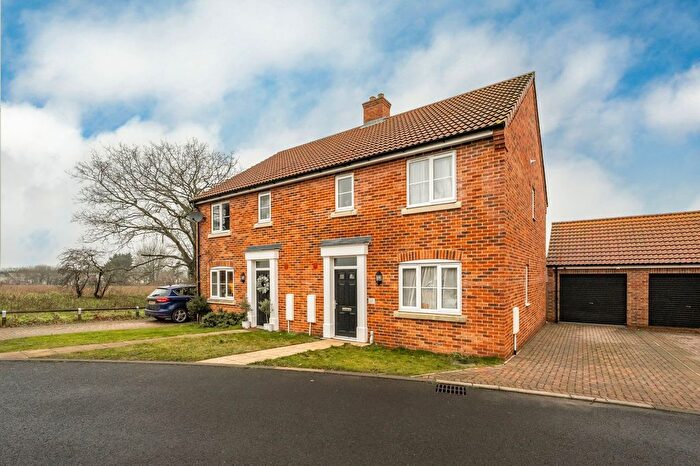
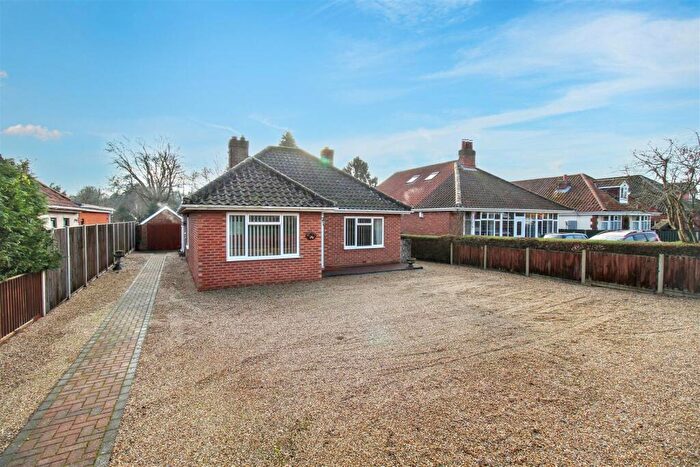
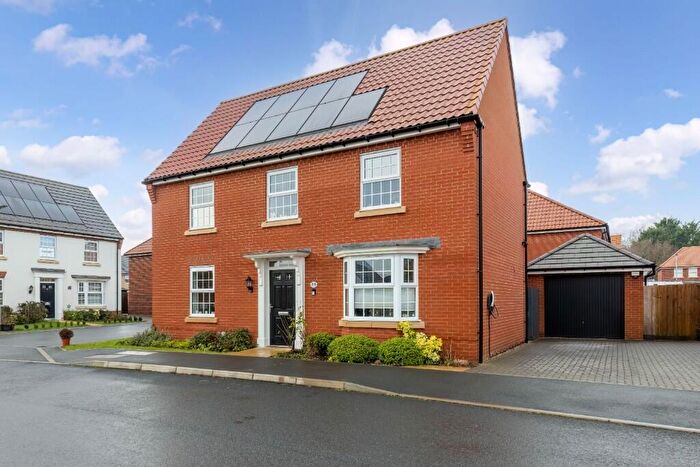
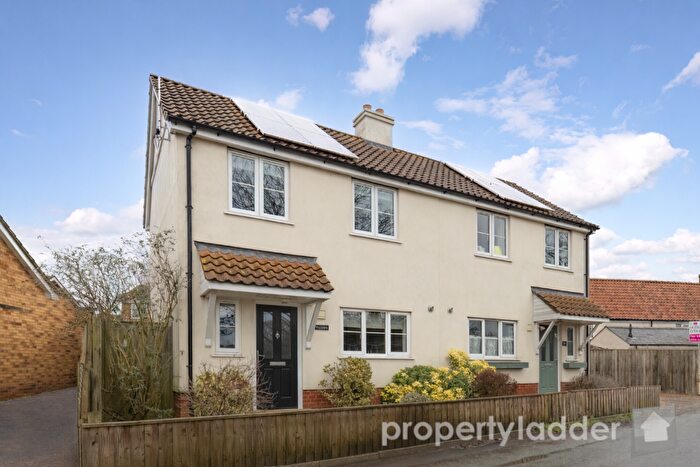
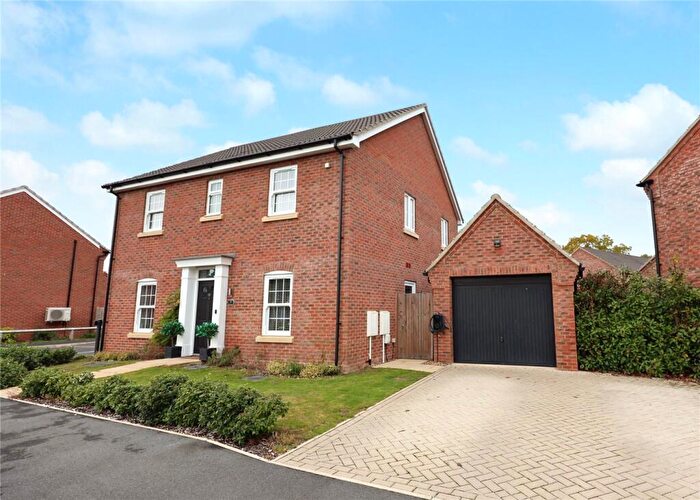
Houses for sale & to rent in Hevingham, Norwich
House Prices in Hevingham
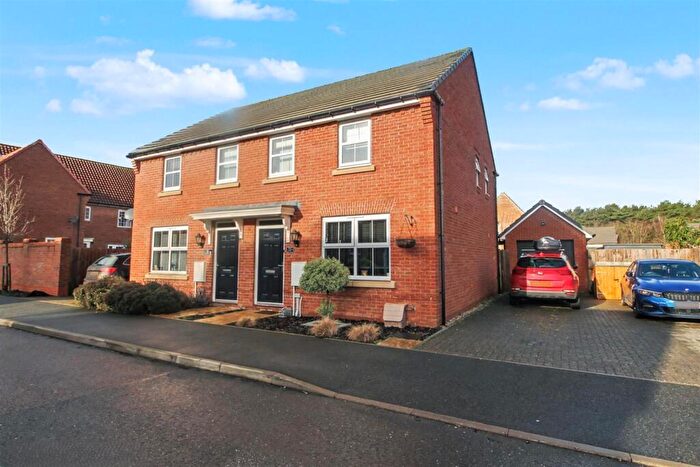
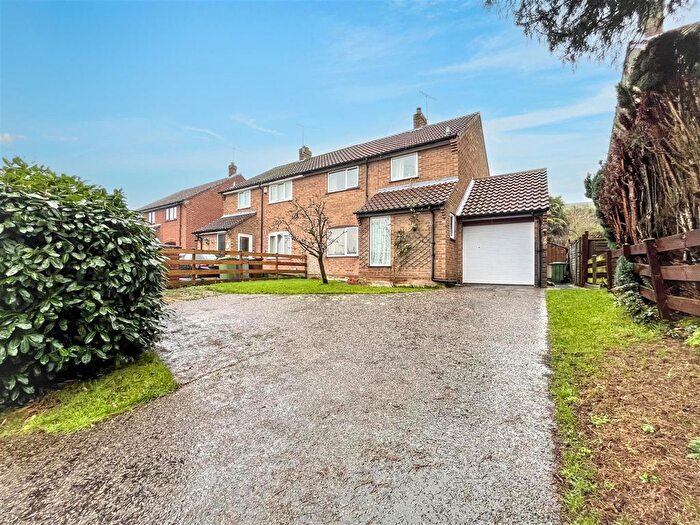
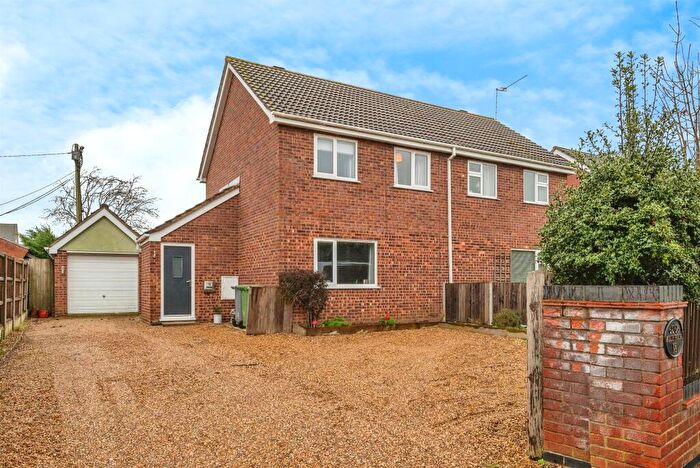
Properties in Hevingham have an average house price of £399,660.00 and had 65 Property Transactions within the last 3 years¹.
Hevingham is an area in Norwich, Norfolk with 1,161 households², where the most expensive property was sold for £1,000,000.00.
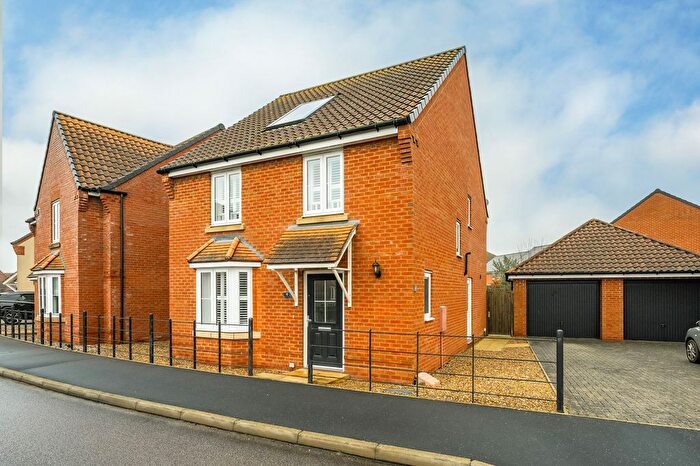
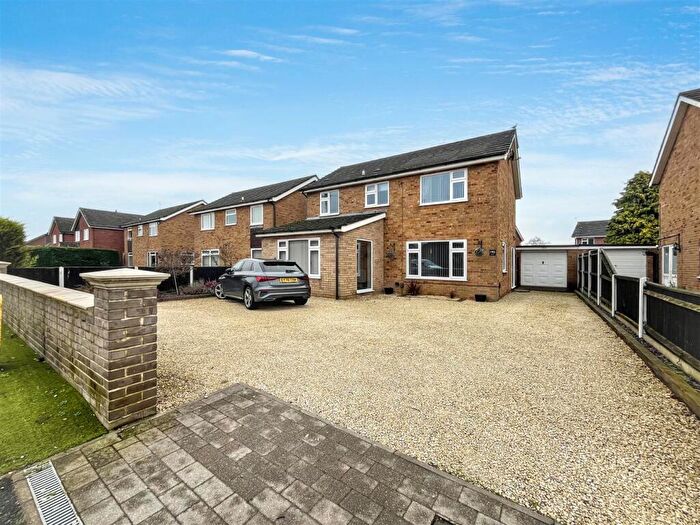
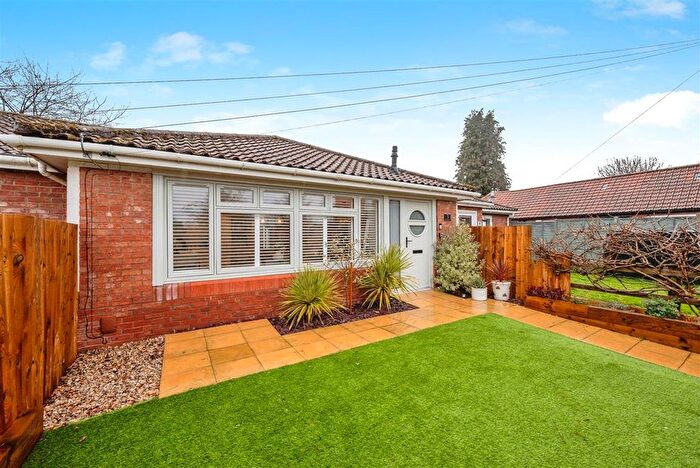
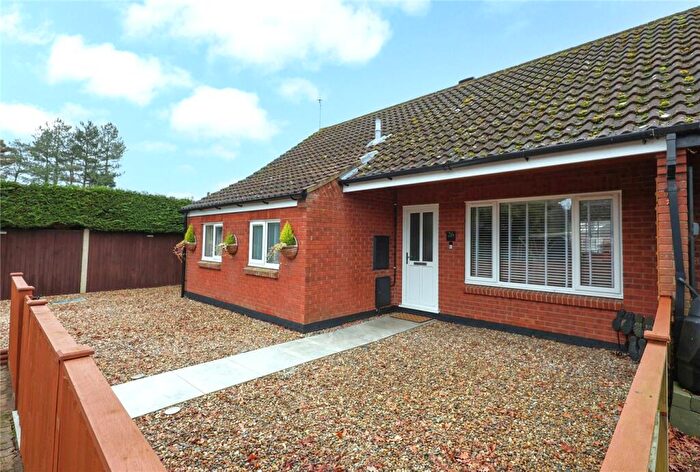
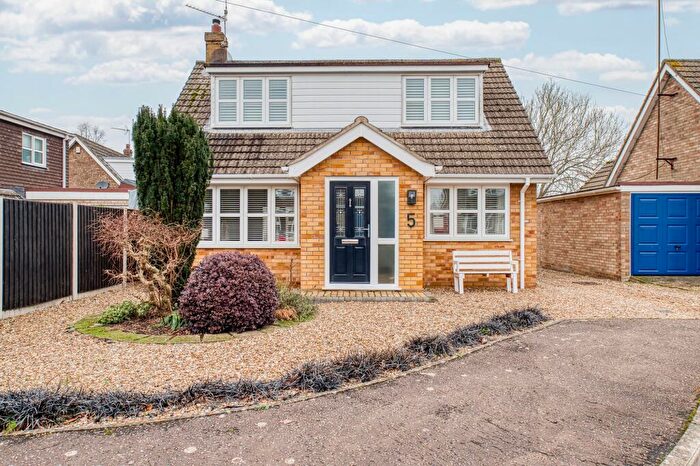
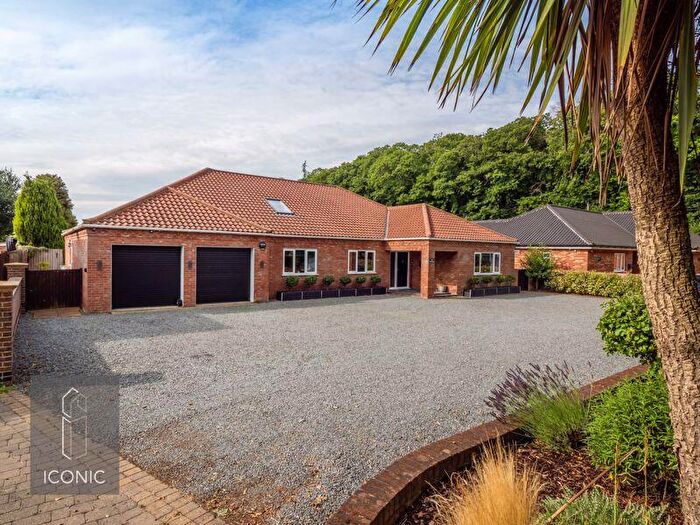
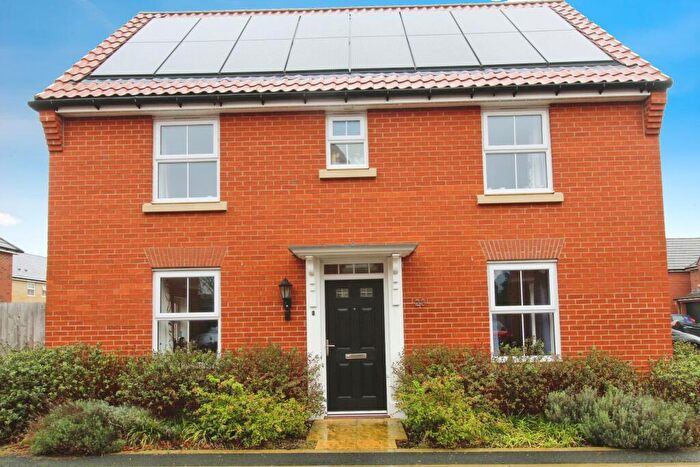
Properties for sale in Hevingham
Roads and Postcodes in Hevingham
Navigate through our locations to find the location of your next house in Hevingham, Norwich for sale or to rent.
| Streets | Postcodes |
|---|---|
| Bentons Way | NR10 5RP |
| Bingles Turn | NR10 5NF |
| Bracken Close | NR10 5RN |
| Brick Kiln Road | NR10 5NE NR10 5NL |
| Buxton Road | NR10 3BN NR12 7NQ NR10 3BL |
| Carters Lane | NR10 5AG |
| Chapel Road | NR10 3NA |
| Chequers Meadow | NR10 3FU |
| Church Lane | NR10 5QT |
| Church Road | NR10 5LN |
| Churchill Close | NR10 5PA |
| Cromer Road | NR10 3AT NR10 3AU NR10 5AD NR10 5LU NR10 5LX NR10 5QU NR10 5QX NR10 5LY |
| Doctors Hill | NR10 5NJ |
| Dumbs Lane | NR10 3BH |
| Edwin Close | NR10 5RY |
| Edwin Way | NR10 5BF |
| Frettenham Road | NR10 3BW |
| Grange Road | NR10 3BJ |
| Hainford Road | NR10 5LJ |
| Hall Road | NR10 3AA NR10 3LX |
| Halls Corner | NR10 5NG NR10 5NQ |
| Harvest Close | NR10 3TA |
| Holt Road | NR10 5NR NR10 5NP |
| Lady Lane | NR10 3LU |
| Leonard Medler Way | NR10 5LE |
| Low Lane | NR10 5QY |
| Mission Room Corner | NR10 5QR |
| Morgans Way | NR10 5PD NR10 5RD |
| Nelson Way | NR10 5PB |
| New Road | NR10 5QN |
| Newton Road | NR10 3BQ NR10 3LT NR10 3LY NR10 3LZ |
| Norwich Road | NR10 5LH |
| Old Church Road | NR10 3BG |
| Old Cromer Road | NR10 3BS |
| Parish Road | NR10 5LP NR10 5LW |
| Patches Plantation | NR10 3BP |
| Phillipo Way | NR10 5FA |
| Pollard Road | NR10 3BE |
| Pound Close | NR10 5ND |
| Pound Road | NR10 5NB |
| Serpentine Road | NR10 5NY |
| Short Thorn Road | NR10 4DE NR10 5NU NR10 5NX |
| Shortthorn Road | NR10 5NT |
| Spixworth Road | NR10 3BX |
| Stratton Road | NR10 3AY NR10 3AZ NR10 5LL |
| The Heath | NR10 5QL NR10 5QW |
| The Old Coach House Gardens | NR10 3BA |
| The Street | NR10 5NA |
| The Turn | NR10 5QP |
| Town Corner | NR10 5LZ |
| Waterloo Road | NR10 3AX |
| Wells Close | NR10 3NB |
| Westgate | NR10 5NH |
| Westgate Green | NR10 5RF |
| Westgate Street | NR10 5RG |
| Woodland View | NR10 5LS NR10 5LT NR10 5NZ |
| NR10 5LR NR10 5PG NR10 5QQ NR10 5QS |
Transport near Hevingham
-
Hoveton and Wroxham Station
-
Worstead Station
-
Salhouse Station
-
North Walsham Station
-
Norwich Station
-
Gunton Station
-
Brundall Gardens Station
- FAQ
- Price Paid By Year
- Property Type Price
Frequently asked questions about Hevingham
What is the average price for a property for sale in Hevingham?
The average price for a property for sale in Hevingham is £399,660. This amount is 30% higher than the average price in Norwich. There are 1,036 property listings for sale in Hevingham.
What streets have the most expensive properties for sale in Hevingham?
The streets with the most expensive properties for sale in Hevingham are Chequers Meadow at an average of £750,000, Short Thorn Road at an average of £682,500 and Newton Road at an average of £639,333.
What streets have the most affordable properties for sale in Hevingham?
The streets with the most affordable properties for sale in Hevingham are Churchill Close at an average of £200,000, Westgate Street at an average of £220,000 and Morgans Way at an average of £238,000.
Which train stations are available in or near Hevingham?
Some of the train stations available in or near Hevingham are Hoveton and Wroxham, Worstead and Salhouse.
Property Price Paid in Hevingham by Year
The average sold property price by year was:
| Year | Average Sold Price | Price Change |
Sold Properties
|
|---|---|---|---|
| 2025 | £494,923 | 26% |
13 Properties |
| 2024 | £365,726 | -6% |
26 Properties |
| 2023 | £385,961 | -18% |
26 Properties |
| 2022 | £456,181 | 20% |
33 Properties |
| 2021 | £365,151 | 8% |
39 Properties |
| 2020 | £337,057 | 5% |
26 Properties |
| 2019 | £319,490 | -1% |
27 Properties |
| 2018 | £322,239 | 3% |
36 Properties |
| 2017 | £311,712 | 7% |
29 Properties |
| 2016 | £288,665 | 5% |
46 Properties |
| 2015 | £274,970 | 13% |
43 Properties |
| 2014 | £238,200 | -4% |
34 Properties |
| 2013 | £246,722 | 11% |
31 Properties |
| 2012 | £219,165 | 2% |
33 Properties |
| 2011 | £213,854 | -3% |
21 Properties |
| 2010 | £220,738 | -5% |
31 Properties |
| 2009 | £231,326 | -10% |
26 Properties |
| 2008 | £254,376 | 9% |
18 Properties |
| 2007 | £232,428 | 4% |
41 Properties |
| 2006 | £222,277 | 6% |
43 Properties |
| 2005 | £207,940 | 12% |
37 Properties |
| 2004 | £182,392 | 5% |
49 Properties |
| 2003 | £173,940 | 10% |
52 Properties |
| 2002 | £156,568 | 24% |
48 Properties |
| 2001 | £119,657 | 16% |
44 Properties |
| 2000 | £100,447 | 18% |
35 Properties |
| 1999 | £82,510 | -1% |
66 Properties |
| 1998 | £83,148 | 8% |
52 Properties |
| 1997 | £76,562 | 17% |
57 Properties |
| 1996 | £63,715 | -7% |
38 Properties |
| 1995 | £68,120 | - |
24 Properties |
Property Price per Property Type in Hevingham
Here you can find historic sold price data in order to help with your property search.
The average Property Paid Price for specific property types in the last three years are:
| Property Type | Average Sold Price | Sold Properties |
|---|---|---|
| Semi Detached House | £261,317.00 | 17 Semi Detached Houses |
| Detached House | £474,383.00 | 43 Detached Houses |
| Terraced House | £227,400.00 | 5 Terraced Houses |

