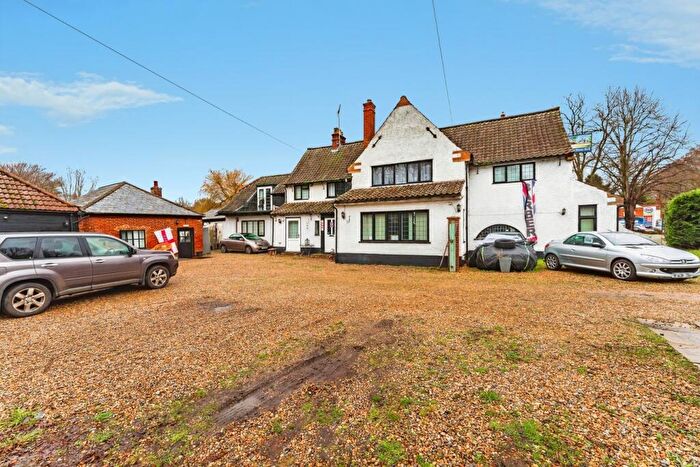
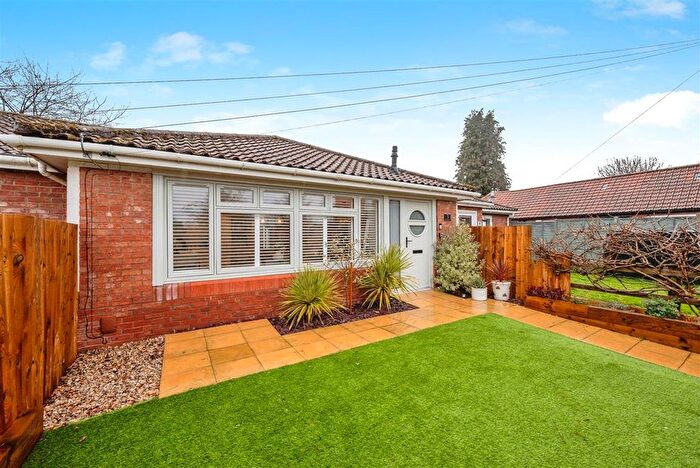
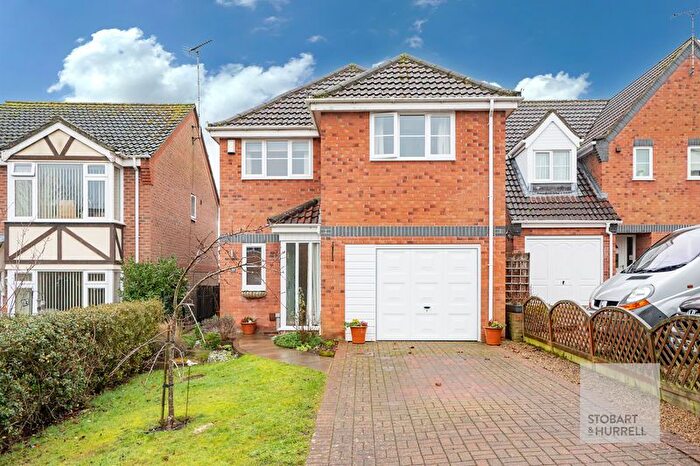
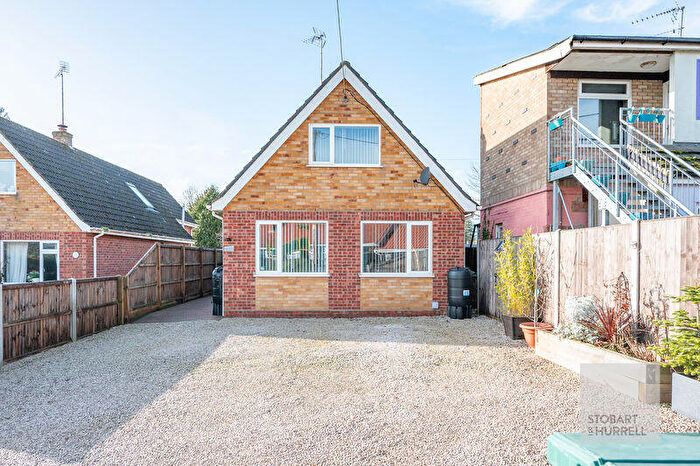
Houses for sale & to rent in Buxton, Norwich
House Prices in Buxton
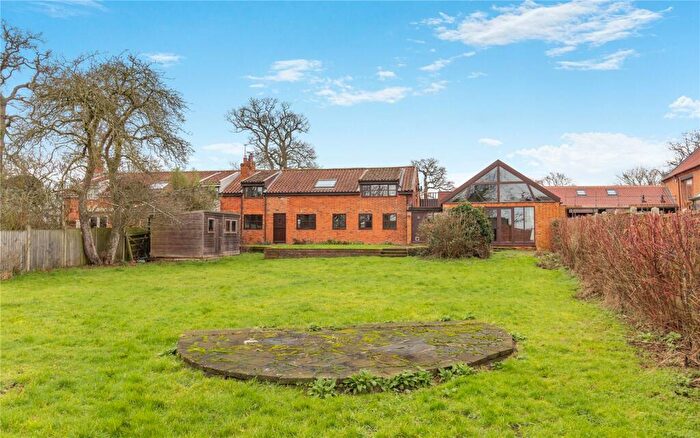
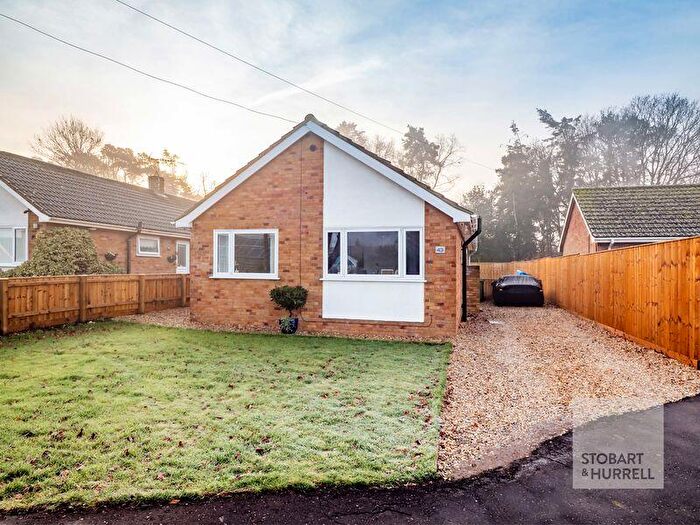
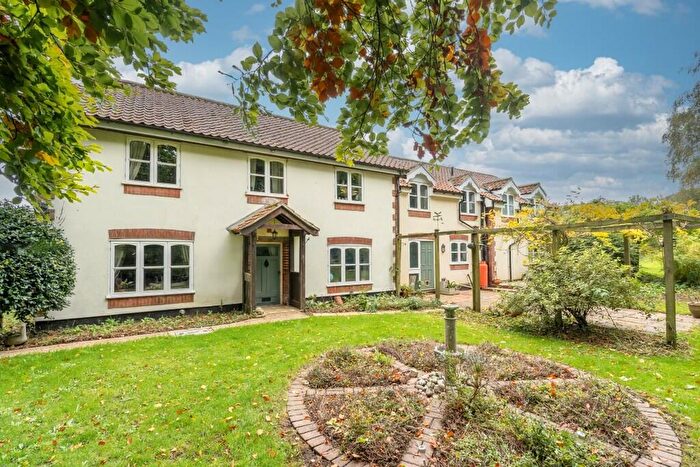
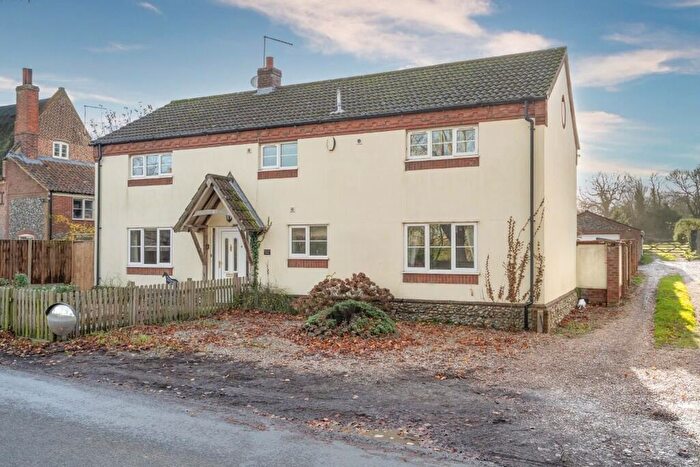
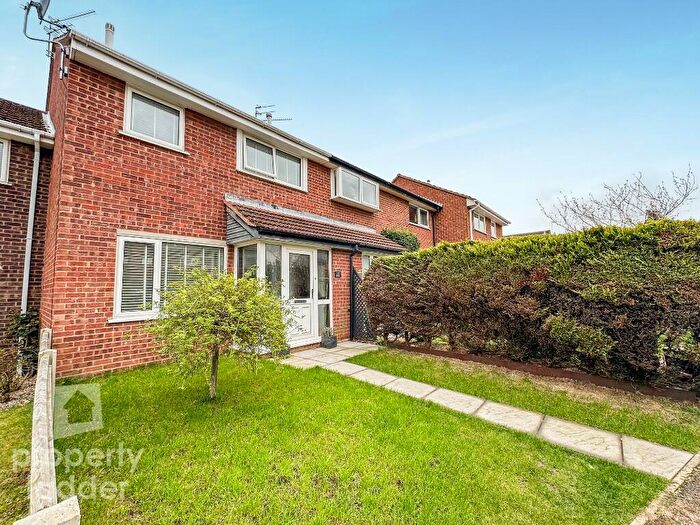
Properties in Buxton have an average house price of £332,275.00 and had 78 Property Transactions within the last 3 years¹.
Buxton is an area in Norwich, Norfolk with 1,068 households², where the most expensive property was sold for £975,000.00.
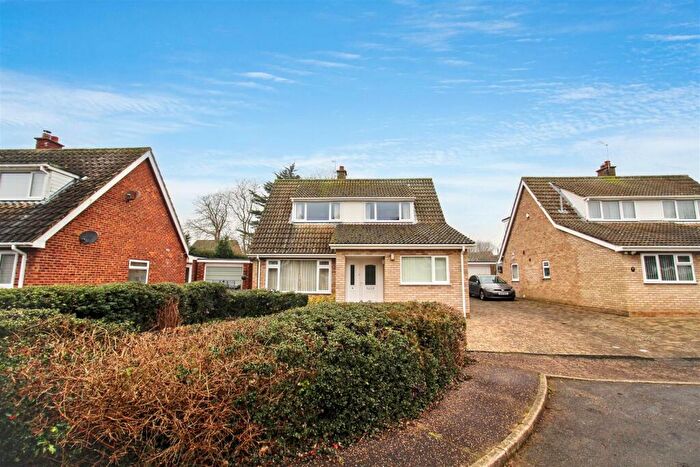
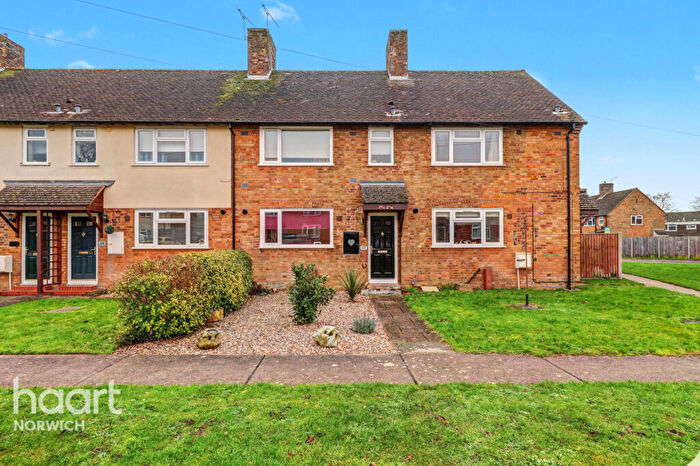
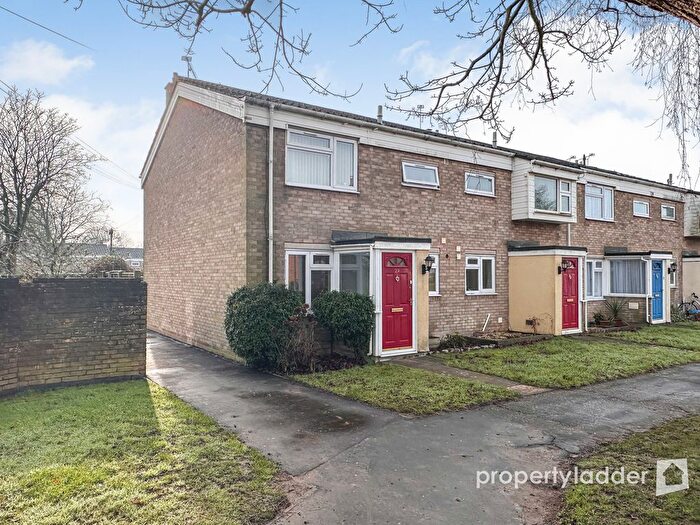
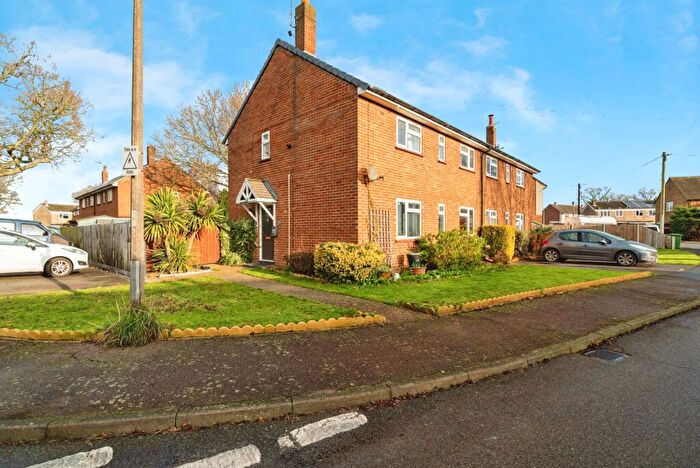
Properties for sale in Buxton
Roads and Postcodes in Buxton
Navigate through our locations to find the location of your next house in Buxton, Norwich for sale or to rent.
| Streets | Postcodes |
|---|---|
| Ashley Drive | NR12 7NE |
| Aylsham Road | NR10 5ES NR10 5EX NR10 5EZ |
| Back Lane | NR10 5HD |
| Barnby Road | NR10 5JN |
| Birbeck Way | NR12 7LG |
| Brook Street | NR10 5AB NR10 5HF |
| Bulwer Close | NR10 5HT |
| Bulwer Road | NR10 5HG |
| Bure Valley Close | NR10 5GA |
| Buxton Road | NR12 7NG NR12 7NH NR12 7NJ NR10 5FF |
| Cawston Road | NR10 5PE |
| Cedar Cottages | NR12 7NN |
| Chestnut Drive | NR10 5FG |
| Church Close | NR10 5ER |
| Church Lane | NR12 7LF NR12 7NR NR12 7NW |
| Coltishall Road | NR10 5HB NR10 5JD NR10 5JB |
| Common Lane | NR10 5BD |
| Court Hill | NR12 7NL |
| Crown Road | NR10 5EH NR10 5EN NR10 5EW NR10 5EP |
| Cubitts Meadow | NR10 5EF |
| Drakes Loke | NR10 5HU |
| Elizabeth Lane | NR10 5LQ |
| Filby Road | NR10 5JW |
| Follet Close | NR10 5HW |
| Fred Edge Close | NR12 7LU |
| Frettenham Road | NR12 7LZ |
| Freyden Way | NR12 7NB |
| Hall Lane | NR12 7LT NR12 7RW |
| Harbord Road | NR12 7ND |
| Hautbois Road | NR10 5JL |
| Horstead Lane | NR12 7LD |
| Jaguar Drive | NR10 5RZ |
| Langmere Lakes | NR12 7NP |
| Levishaw Close | NR10 5HQ |
| Lion Road | NR10 5HH NR10 5HJ NR10 5HL |
| Little Hautbois | NR12 7JR NR12 7JS |
| Little Hautbois Road | NR10 5JH |
| Manor Close | NR10 5HR |
| Marsham Road | NR10 5HN |
| Mayton Avenue | NR12 7LH |
| Mead Close | NR10 5EL |
| Mill Field Court | NR12 7NU |
| Mill Reach | NR10 5EJ |
| Mill Road | NR12 7LQ |
| Mill Street | NR10 5JE NR10 5JF |
| Norwich Road | NR10 5LF |
| Old Hall Gardens | NR10 5LD |
| Post Office Road | NR12 7AB |
| Redmere Close | NR12 7LN |
| Sandy Lane | NR10 5HZ |
| School Road | NR12 7LL |
| Scottow Road | NR10 5JJ |
| Sewell Cottages | NR10 5PF |
| Sewell Road | NR10 5EU |
| Shirley Close | NR12 7LW |
| St Andrews Close | NR10 5EY |
| Stakebridge Farm Cottages | NR10 5DQ |
| Stracey Road | NR10 5EG NR10 5ET |
| Stratton Road | NR10 5HY |
| The Heath | NR10 5JA |
| The Street | NR10 5AA NR10 5AF |
| Townsend | NR10 5HE |
| Well Green | NR12 7LS |
| Well Green Row | NR12 7GL |
| Woodland Walk | NR10 5HS |
| NR10 5HX NR10 5JG NR10 5JQ NR10 5HP NR11 6TW NR12 7NF |
Transport near Buxton
-
Hoveton and Wroxham Station
-
Worstead Station
-
Salhouse Station
-
North Walsham Station
-
Norwich Station
-
Gunton Station
-
Brundall Gardens Station
-
Brundall Station
- FAQ
- Price Paid By Year
- Property Type Price
Frequently asked questions about Buxton
What is the average price for a property for sale in Buxton?
The average price for a property for sale in Buxton is £332,275. This amount is 8% higher than the average price in Norwich. There are 1,217 property listings for sale in Buxton.
What streets have the most expensive properties for sale in Buxton?
The streets with the most expensive properties for sale in Buxton are Mill Reach at an average of £544,000, Stratton Road at an average of £520,000 and Mill Field Court at an average of £495,000.
What streets have the most affordable properties for sale in Buxton?
The streets with the most affordable properties for sale in Buxton are Stracey Road at an average of £165,000, Coltishall Road at an average of £170,000 and Woodland Walk at an average of £246,250.
Which train stations are available in or near Buxton?
Some of the train stations available in or near Buxton are Hoveton and Wroxham, Worstead and Salhouse.
Property Price Paid in Buxton by Year
The average sold property price by year was:
| Year | Average Sold Price | Price Change |
Sold Properties
|
|---|---|---|---|
| 2025 | £322,391 | 1% |
23 Properties |
| 2024 | £318,984 | -13% |
32 Properties |
| 2023 | £360,652 | 6% |
23 Properties |
| 2022 | £340,387 | 4% |
40 Properties |
| 2021 | £325,656 | 7% |
40 Properties |
| 2020 | £303,855 | 7% |
44 Properties |
| 2019 | £281,562 | -8% |
28 Properties |
| 2018 | £303,132 | 23% |
34 Properties |
| 2017 | £232,876 | -10% |
30 Properties |
| 2016 | £255,170 | 14% |
38 Properties |
| 2015 | £219,028 | -2% |
34 Properties |
| 2014 | £223,549 | -17% |
49 Properties |
| 2013 | £261,961 | 11% |
30 Properties |
| 2012 | £234,153 | 5% |
39 Properties |
| 2011 | £221,549 | 13% |
29 Properties |
| 2010 | £191,707 | 3% |
39 Properties |
| 2009 | £186,647 | -5% |
40 Properties |
| 2008 | £195,126 | -9% |
41 Properties |
| 2007 | £212,926 | -0,1% |
63 Properties |
| 2006 | £213,191 | 10% |
54 Properties |
| 2005 | £191,577 | 1% |
25 Properties |
| 2004 | £190,121 | 14% |
45 Properties |
| 2003 | £162,674 | 20% |
37 Properties |
| 2002 | £130,408 | 16% |
39 Properties |
| 2001 | £109,028 | -0,5% |
49 Properties |
| 2000 | £109,545 | 37% |
41 Properties |
| 1999 | £68,973 | -7% |
49 Properties |
| 1998 | £73,955 | 0,1% |
33 Properties |
| 1997 | £73,872 | 14% |
44 Properties |
| 1996 | £63,616 | 9% |
49 Properties |
| 1995 | £58,198 | - |
35 Properties |
Property Price per Property Type in Buxton
Here you can find historic sold price data in order to help with your property search.
The average Property Paid Price for specific property types in the last three years are:
| Property Type | Average Sold Price | Sold Properties |
|---|---|---|
| Semi Detached House | £265,250.00 | 28 Semi Detached Houses |
| Detached House | £423,442.00 | 35 Detached Houses |
| Terraced House | £237,115.00 | 13 Terraced Houses |
| Flat | £293,750.00 | 2 Flats |

