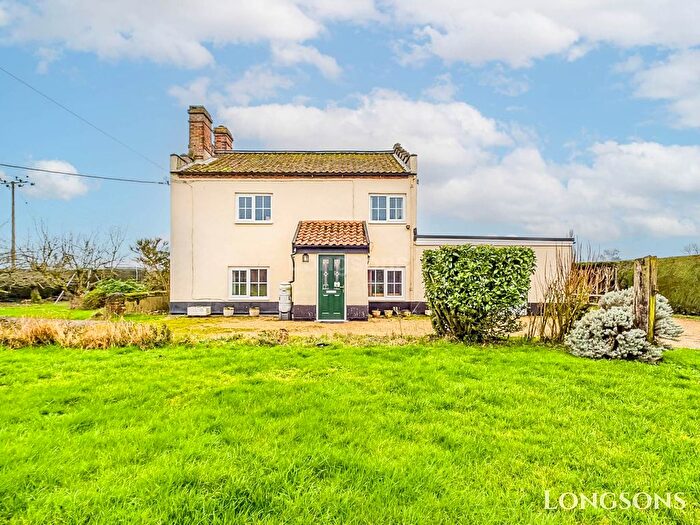
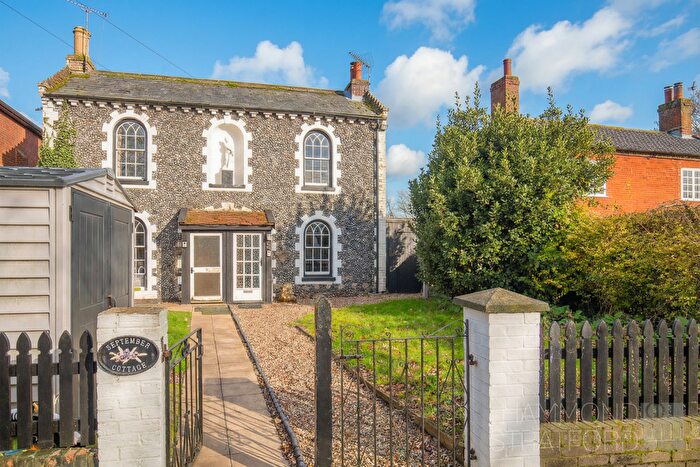
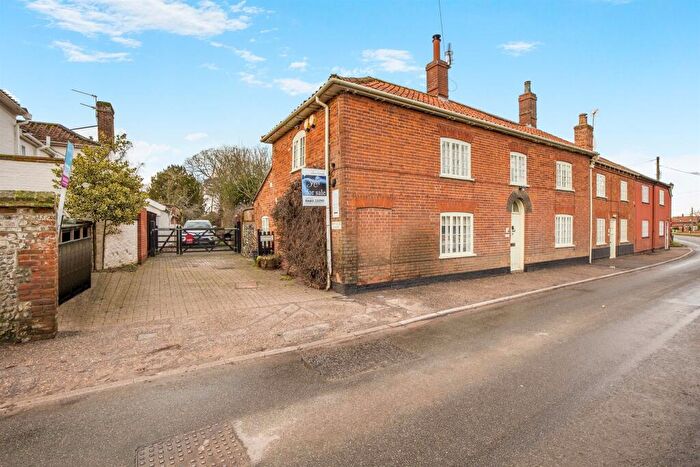
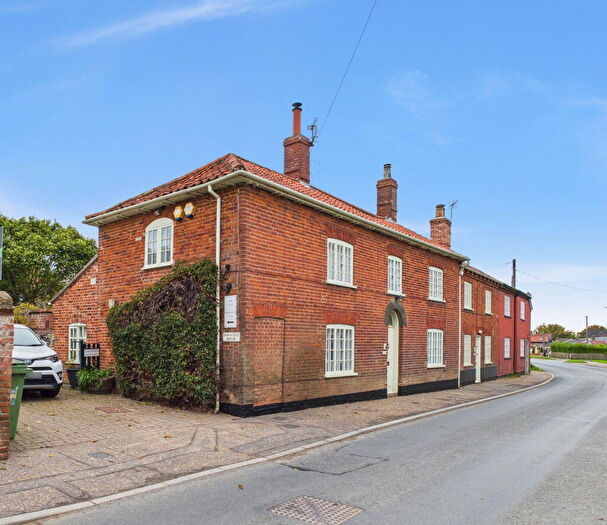
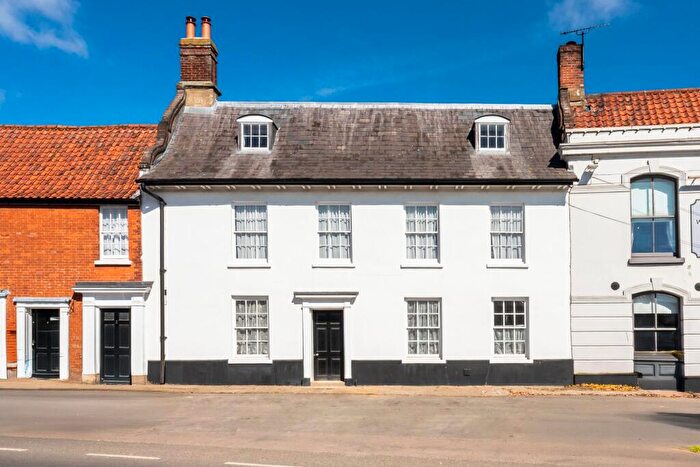
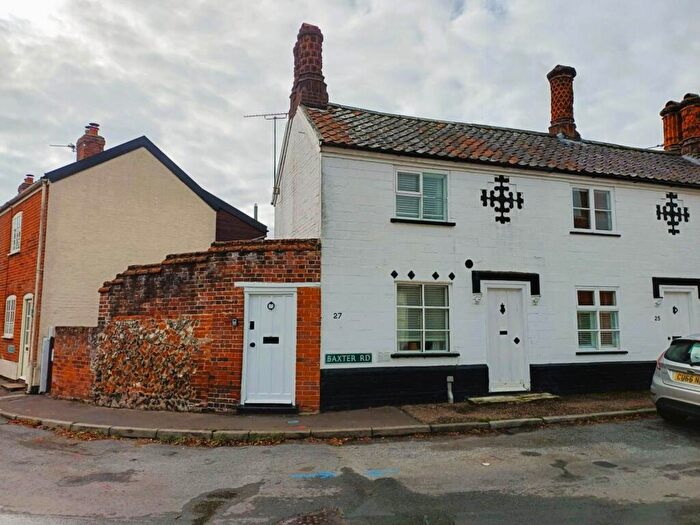
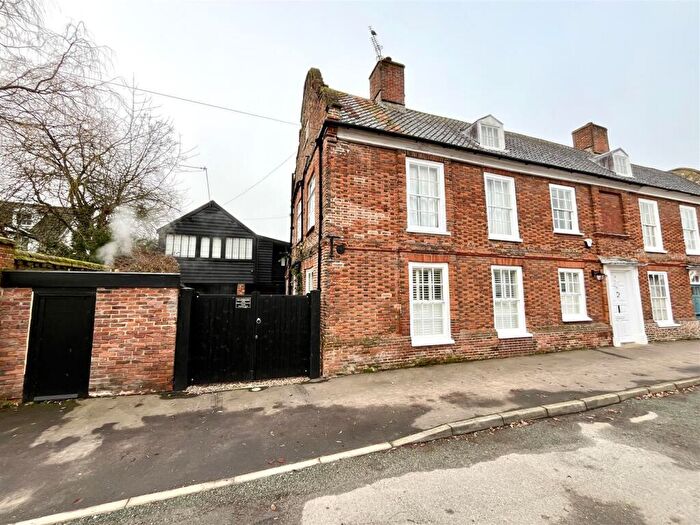
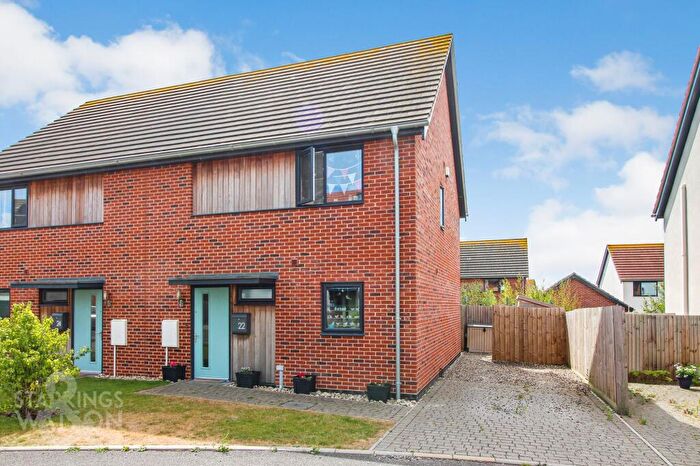
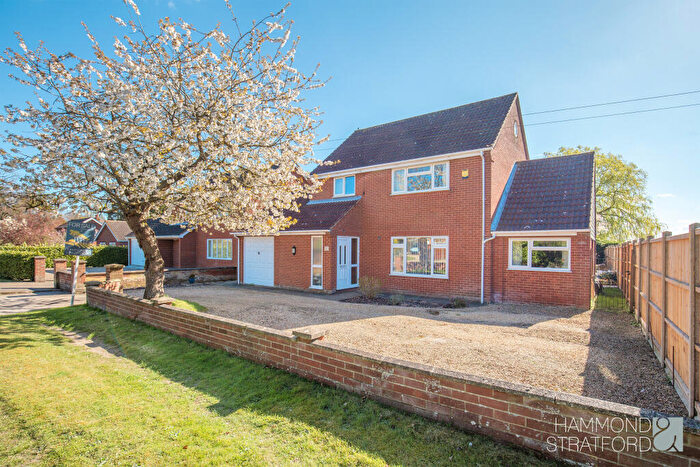
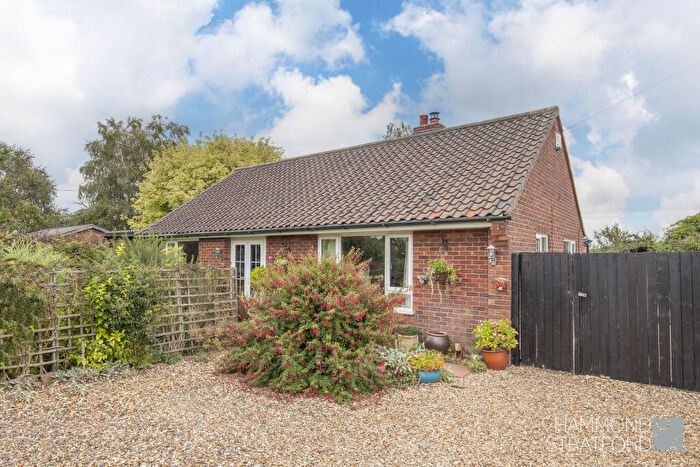
Houses for sale & to rent in Hingham And Deopham, Norwich
House Prices in Hingham And Deopham
Properties in Hingham And Deopham have an average house price of £337,158.00 and had 102 Property Transactions within the last 3 years¹.
Hingham And Deopham is an area in Norwich, Norfolk with 1,046 households², where the most expensive property was sold for £1,112,000.00.
Properties for sale in Hingham And Deopham
Roads and Postcodes in Hingham And Deopham
Navigate through our locations to find the location of your next house in Hingham And Deopham, Norwich for sale or to rent.
| Streets | Postcodes |
|---|---|
| Admirals Garden | NR9 4JW |
| Admirals Walk | NR9 4JL |
| Attleborough Road | NR9 4HP NR9 4NH NR9 4NQ NR9 4RF |
| Baxter Close | NR9 4HZ |
| Baxter Road | NR9 4HY |
| Bears Close | NR9 4LN |
| Bears Lane | NR9 4LL |
| Bell Meadow | NR9 4HT |
| Bond Street | NR9 4HA |
| Chapel Street | NR9 4JH |
| Church Street | NR9 4HL |
| Copper Lane | NR9 4JS |
| Deopham Road | NR9 4NL |
| Dereham Road | NR9 4HH NR9 4HU |
| Drinkwater Close | NR9 4LU |
| Fairland Terrace | NR9 4HR |
| Fleeters Hill | NR9 4LA |
| Folly Lane | NR9 4JE |
| Geoffrey Buckingham Close | NR9 4JP |
| Glebe Close | NR9 4HF |
| Greenacre Road | NR9 4HG |
| Hall Close | NR9 4JU |
| Hall Lane | NR9 4JX |
| Hall Moor Road | NR9 4LB NR9 4LE |
| Hardingham Road | NR9 4LX NR9 4LY |
| Hardingham Street | NR9 4JB NR9 4JD |
| Lincoln Avenue | NR9 4NA |
| Little Ellingham Road | NR9 4NE |
| Lonsdale Crescent | NR9 4ND |
| Low Road | NR9 4NG |
| Market Place | NR9 4AF |
| Mill Corner | NR9 4LG |
| Muir Drive | NR9 4PQ |
| Norwich Road | NR9 4LR NR9 4LS |
| Norwich Street | NR9 4JJ NR9 4LJ |
| Oak Lane | NR9 4JY |
| Park Close | NR9 4JA |
| Pitts Square | NR9 4LD |
| Pottles Alley | NR9 4HS |
| Primrose Road | NR9 4HQ |
| Rectory Gardens | NR9 4RG |
| Ringers Lane | NR9 4LT |
| Royal Oak Mews | NR9 4JF |
| Seamere Road | NR9 4LP NR9 4LW |
| Southburgh Lane | NR9 4PP |
| Springfield Way | NR9 4PR |
| St Andrews Close | NR9 4JT |
| Stone Lane | NR9 4LH |
| The Fairland | NR9 4HN NR9 4HW |
| The Fields | NR9 4JG |
| The Meadows | NR9 4JN |
| Watton Road | NR9 4HB NR9 4HD NR9 4HE NR9 4NN NR9 4NW |
| Wellingtonia Terrace | NR9 4HX |
| Wood Rising Road | NR9 4PN |
Transport near Hingham And Deopham
- FAQ
- Price Paid By Year
- Property Type Price
Frequently asked questions about Hingham And Deopham
What is the average price for a property for sale in Hingham And Deopham?
The average price for a property for sale in Hingham And Deopham is £337,158. This amount is 10% higher than the average price in Norwich. There are 202 property listings for sale in Hingham And Deopham.
What streets have the most expensive properties for sale in Hingham And Deopham?
The streets with the most expensive properties for sale in Hingham And Deopham are Lonsdale Crescent at an average of £632,500, Bears Lane at an average of £628,750 and Watton Road at an average of £575,750.
What streets have the most affordable properties for sale in Hingham And Deopham?
The streets with the most affordable properties for sale in Hingham And Deopham are Attleborough Road at an average of £135,000, Fairland Terrace at an average of £181,500 and Rectory Gardens at an average of £215,000.
Which train stations are available in or near Hingham And Deopham?
Some of the train stations available in or near Hingham And Deopham are Attleborough, Spooner Row and Wymondham.
Property Price Paid in Hingham And Deopham by Year
The average sold property price by year was:
| Year | Average Sold Price | Price Change |
Sold Properties
|
|---|---|---|---|
| 2025 | £336,591 | 9% |
35 Properties |
| 2024 | £306,557 | -20% |
33 Properties |
| 2023 | £367,441 | 12% |
34 Properties |
| 2022 | £324,312 | 11% |
38 Properties |
| 2021 | £288,433 | 1% |
53 Properties |
| 2020 | £286,027 | -7% |
37 Properties |
| 2019 | £306,290 | 7% |
39 Properties |
| 2018 | £286,300 | 7% |
35 Properties |
| 2017 | £265,068 | -6% |
43 Properties |
| 2016 | £280,551 | 29% |
39 Properties |
| 2015 | £199,674 | -2% |
63 Properties |
| 2014 | £203,135 | -8% |
41 Properties |
| 2013 | £220,130 | 9% |
36 Properties |
| 2012 | £199,892 | -1% |
38 Properties |
| 2011 | £201,947 | -13% |
40 Properties |
| 2010 | £228,411 | 16% |
42 Properties |
| 2009 | £192,002 | -12% |
48 Properties |
| 2008 | £215,564 | 1% |
35 Properties |
| 2007 | £213,150 | -3% |
62 Properties |
| 2006 | £219,640 | 10% |
48 Properties |
| 2005 | £196,731 | 3% |
41 Properties |
| 2004 | £190,291 | 16% |
49 Properties |
| 2003 | £159,718 | 22% |
53 Properties |
| 2002 | £124,175 | 1% |
75 Properties |
| 2001 | £123,214 | 8% |
78 Properties |
| 2000 | £113,853 | 26% |
41 Properties |
| 1999 | £84,651 | 7% |
54 Properties |
| 1998 | £78,507 | -6% |
38 Properties |
| 1997 | £83,086 | 20% |
45 Properties |
| 1996 | £66,436 | -4% |
52 Properties |
| 1995 | £69,384 | - |
37 Properties |
Property Price per Property Type in Hingham And Deopham
Here you can find historic sold price data in order to help with your property search.
The average Property Paid Price for specific property types in the last three years are:
| Property Type | Average Sold Price | Sold Properties |
|---|---|---|
| Semi Detached House | £272,078.00 | 37 Semi Detached Houses |
| Detached House | £386,064.00 | 50 Detached Houses |
| Terraced House | £375,000.00 | 12 Terraced Houses |
| Flat | £173,333.00 | 3 Flats |

