
Houses for sale in Hingham & Deopham, Norwich
House Prices in Hingham & Deopham
Properties in Hingham & Deopham have an average house price of £278k and had 11 Property Transactions within the last 3 years¹.
Hingham & Deopham is an area in Norwich, Norfolk with 119 households², where the most expensive property was sold for £660k.
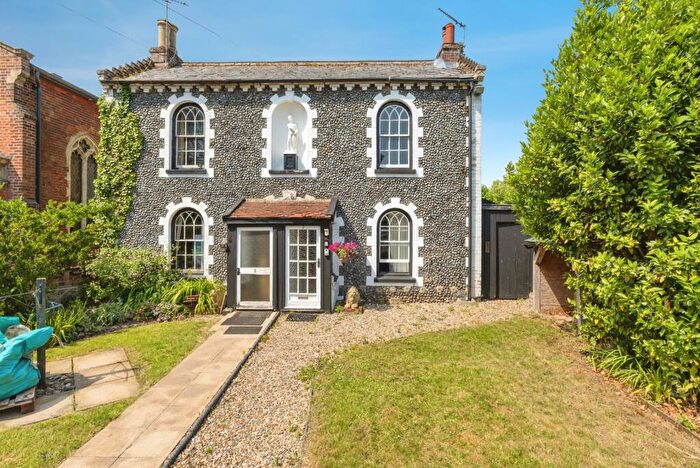
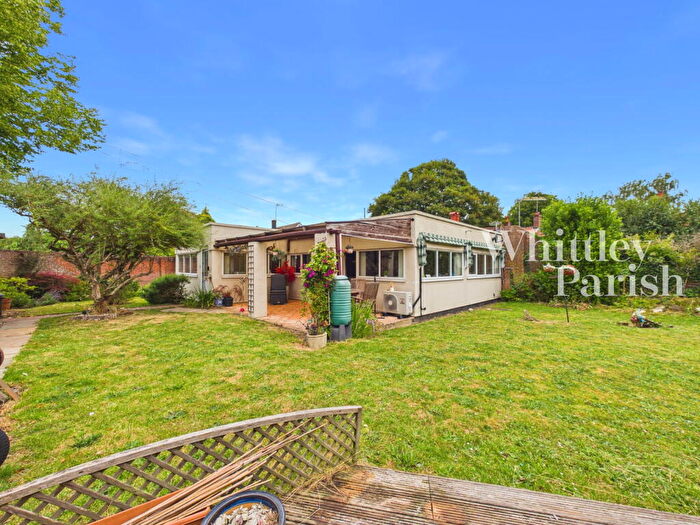
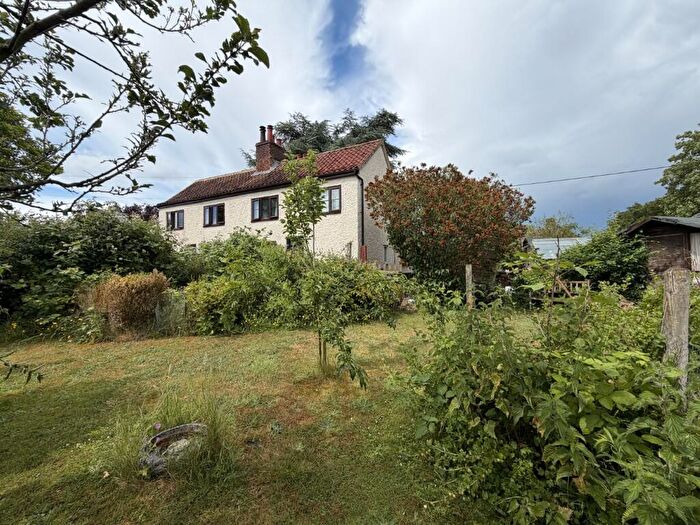
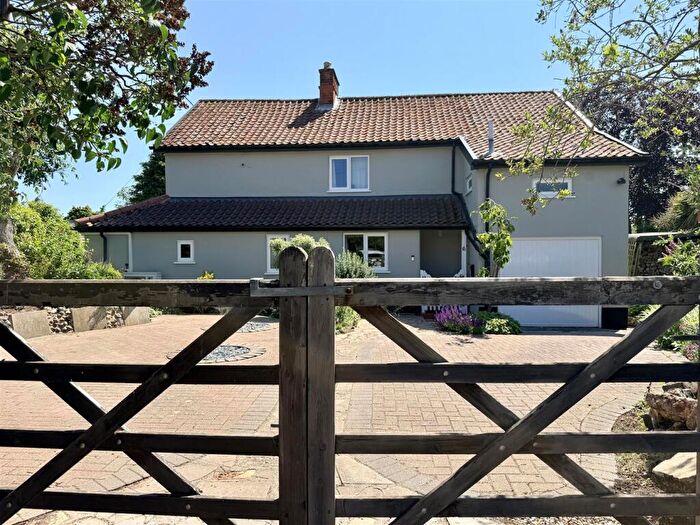
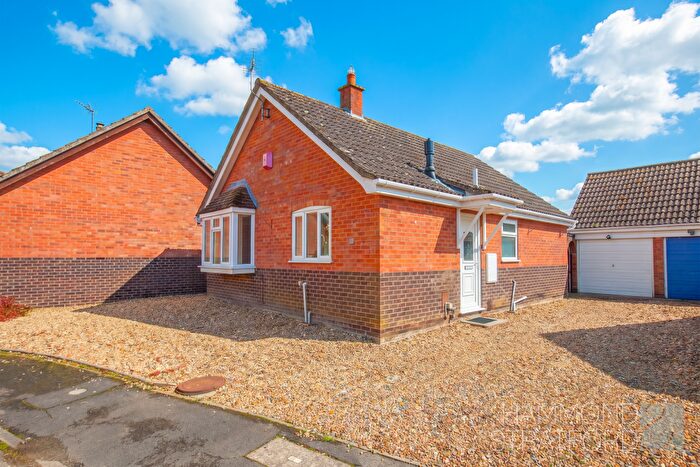
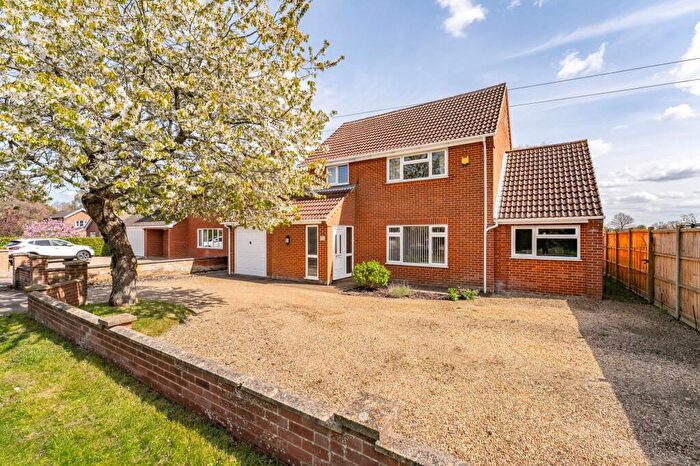
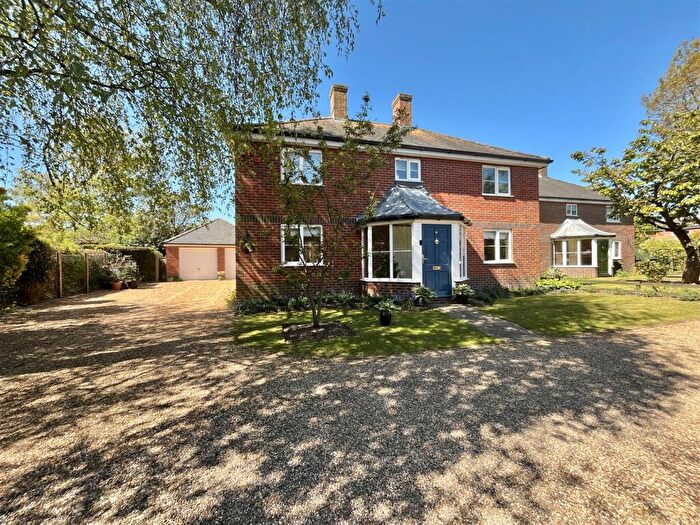
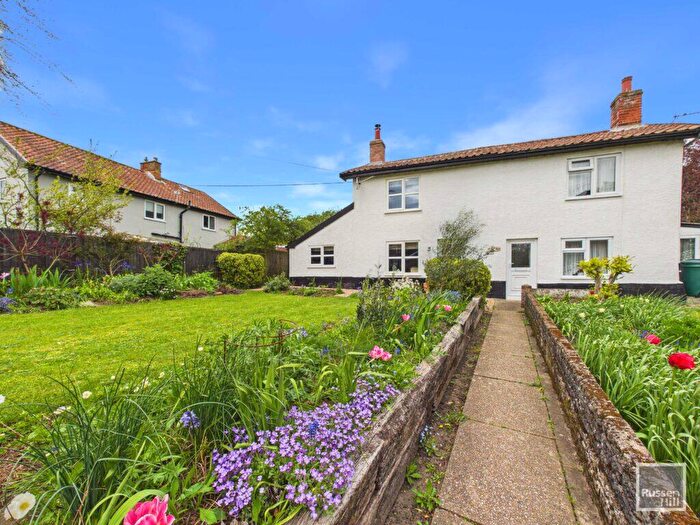
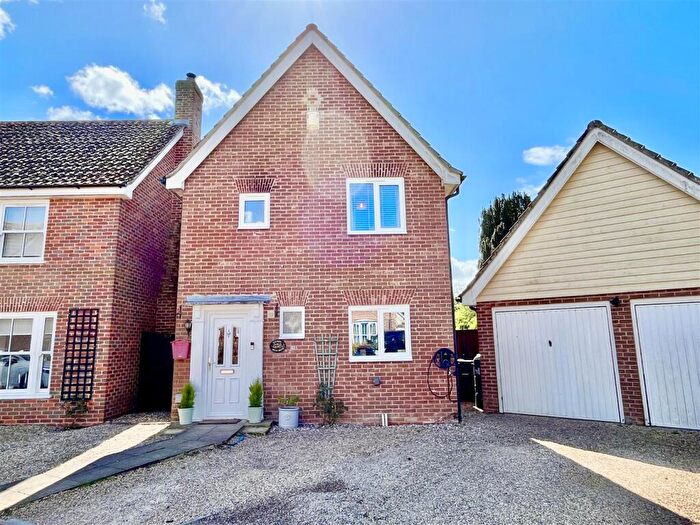
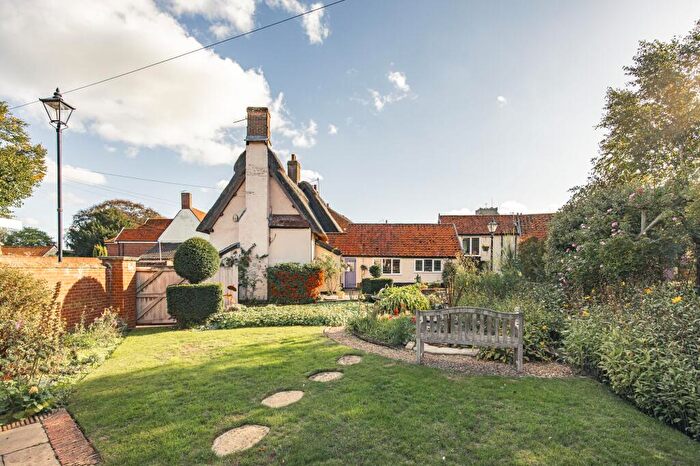
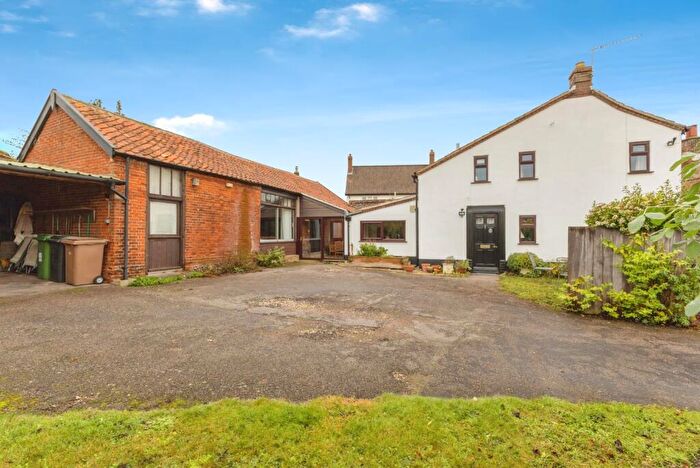
Properties for sale in Hingham & Deopham

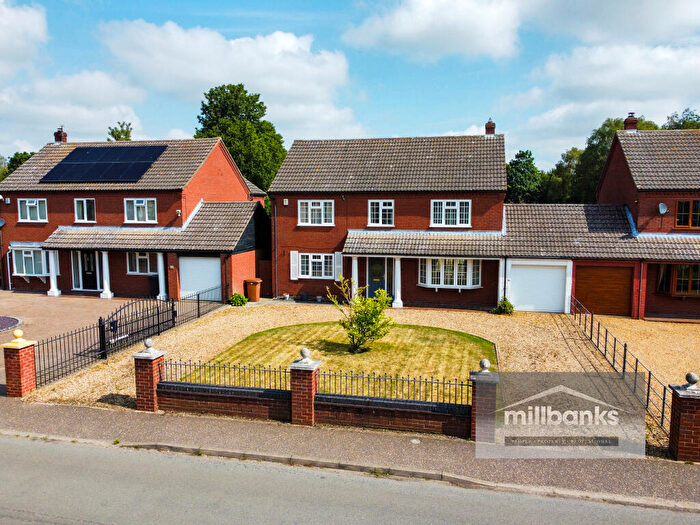
![]()
If you are looking to sell your house, let it out, or receive a property valuation, an expert can help you.
Click the button below to get started.


Roads and Postcodes in Hingham & Deopham
Navigate through our locations to find the location of your next house in Hingham & Deopham, Norwich for sale or to rent.
| Streets | Postcodes |
|---|---|
| Barleyfield Road | NR9 4EX |
| Coopers Crescent | NR9 4EY |
| Dereham Road | NR9 4PX |
| Granary Way | NR9 4FA |
| Hardingham Road | NR9 4LQ |
| Hopsack Road | NR9 4FB |
| Ironside Way | NR9 4LF |
| Lincoln Close | NR9 4LZ |
| Maltsters Drive | NR9 4FD |
| Money Hill | NR9 4NJ |
| The Dell | NR9 4HJ |
Property price trends in Hingham & Deopham
According to the latest Land Registry data, the average home in Hingham & Deopham sold for £402,000 in 2025. That figure comes from 100 sales logged over the past 10 years.
Prices have continued to climb over the last three years. Compared with 2022, when the typical sale came in around £244,871, that's a rise of roughly 64.2%.
Looking back five years, average prices are up about 49.7% since 2020, a gain of around £133,500 in cash terms.
Zoom out to the past decade for the fuller picture. Back in 2015, homes here averaged £98,000, so the typical sold price has climbed about 310.2% since then, roughly 15.2% a year.
Frequently asked questions about Hingham & Deopham
What is the average price for a property for sale in Hingham & Deopham?
The average price for a property for sale in Hingham & Deopham is £277,795. This amount is 10% lower than the average price in Norwich. There are 178 property listings for sale in Hingham & Deopham.
What streets have the most expensive properties for sale in Hingham & Deopham?
The streets with the most expensive properties for sale in Hingham & Deopham are Money Hill at an average of £660,000 and Maltsters Drive at an average of £290,000.
What streets have the most affordable properties for sale in Hingham & Deopham?
The streets with the most affordable properties for sale in Hingham & Deopham are Lincoln Close at an average of £123,187 and Hopsack Road at an average of £272,500.
Which train stations are available in or near Hingham & Deopham?
Some of the train stations available in or near Hingham & Deopham are Attleborough, Spooner Row and Wymondham.
Property Price Paid in Hingham & Deopham by Year
The average sold property price by year was:
| Year | Average Sold Price | Price Change |
Sold Properties
|
|---|---|---|---|
| 2025 | £402,000 | 42% |
2 Properties |
| 2024 | £234,500 | -12% |
4 Properties |
| 2023 | £262,750 | 7% |
5 Properties |
| 2022 | £244,871 | -0,1% |
7 Properties |
| 2021 | £245,187 | -10% |
8 Properties |
| 2020 | £268,500 | -2% |
2 Properties |
| 2019 | £274,727 | -7% |
11 Properties |
| 2018 | £295,277 | 7% |
18 Properties |
| 2017 | £274,166 | 26% |
30 Properties |
| 2016 | £202,083 | 52% |
12 Properties |
Property Price per Property Type in Hingham & Deopham
Here you can find historic sold price data in order to help with your property search.
The average Property Paid Price for specific property types in the last three years are:
| Property Type | Average Sold Price | Sold Properties |
|---|---|---|
| Semi Detached House | £280,600.00 | 5 Semi Detached Houses |
| Terraced House | £123,187.00 | 4 Terraced Houses |
| Detached House | £580,000.00 | 2 Detached Houses |
